[Preprint]. 2024 Jul 26:2024.07.26.605293.
doi: 10.1101/2024.07.26.605293.

PRAME expression in melanoma is negatively regulated by TET2-mediated DNA hydroxymethylation

Affiliations

PRAME expression in melanoma is negatively regulated by TET2-mediated DNA hydroxymethylation

Rui Fang et al. bioRxiv. .

Update in

Abstract

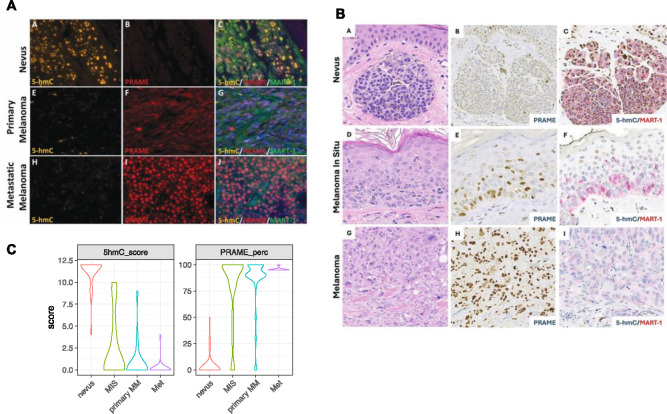
Preferentially Expressed Antigen in Melanoma (PRAME) and Ten-Eleven Translocation (TET) dioxygenase-mediated 5-hydroxymethylcytosine (5hmC) are emerging melanoma biomarkers. We observed an inverse correlation between PRAME expression and 5hmC levels in benign nevi, melanoma in situ, primary invasive melanoma, and metastatic melanomas via immunohistochemistry and multiplex immunofluorescence: nevi exhibited high 5hmC and low PRAME, whereas melanomas showed the opposite pattern. Single-cell multiplex imaging of melanoma precursors revealed that diminished 5hmC coincides with PRAME upregulation in premalignant cells. Analysis of TCGA and GTEx databases confirmed a negative relationship between TET2 and PRAME mRNA expression in melanoma. Additionally, 5hmC levels were reduced at the PRAME 5' promoter in melanoma compared to nevi, suggesting a role for 5hmC in PRAME transcription. Restoring 5hmC levels via TET2 overexpression notably reduced PRAME expression in melanoma cell lines. These findings establish a function of TET2-mediated DNA hydroxymethylation in regulating PRAME expression and demonstrate epigenetic reprogramming as pivotal in melanoma tumorigenesis.

Teaser: Melanoma biomarker PRAME expression is negatively regulated epigenetically by TET2-mediated DNA hydroxymethylation.

Keywords: 5-hmC; PRAME; TET2; biomarkers; epigenetics; melanoma.


Figures

Figure 1.
Figure 1.. The inversed PRAME and 5-hmC staining in nevi and melanoma.
A. Representative multiplex immunofluorescence staining of 5hmC (yellow), PRAME (red), MART-1 (green) in nevi, primary and metastasis melanoma, and counter staining with DAPI (blue). B. Representative IHC staining of nevus, melanoma in-situ and primary malignant melanoma. Panel a, d &g, H&E staining; panel b, e & h, PRAME, brown; panel c, f & I, dual IHC for 5hmC (nuclear positivity, brown) and melanocytic lineage marker MART-1 (membranous stain, red). C. Violin plot of PRAME and 5hmC scores combining cohort in A and B. PRAME is scored byt the percentage of PRAME positive cells. 5hmC, by either IF or IHC, are scored in a scale of 0–12 using a scheme based on intensity and percentage of positive cells. Nevus n=30; MIS n=19; Primary MM (primary malignant melanoma) n=38; Metastatic melanoma n=24.
Figure 2.
Figure 2.. Inverse correlation of PRAME and 5hmC in melanoma precursors.
A. An exemplary case (MEL18) highlighting the presence of progression-related histopathologic tissue regions (precursor, MIS) adjacent to a region of vertical growth phase melanoma. A proportion of the region with melanocytic atypia is magnified (green inset). Scale bars, 500 μm and 20 μm. B. Uniform manifold approximation and projection (UMAP) of single-cell data derived from CyCIF of 14 patient samples, labeled by patient ID (left) and the signal intensities of PRAME (middle) and 5hmC (right). C. CyCIF image of sample MEL14 showing the transition from precursor to melanoma in situ and invasion stained for DNA (blue), CK14 (white), SOX10 (red, top left) and PRAME (yellow, bottom left). The inset squares correspond to magnified panels on the right, with DNA (blue), PanCK (white), SOX10 (red), PRAME (yellow), 5hmC (green) and TET2 (cyan), highlighting the PRAME+ and PRAME-atypical melanocytes in the precursor region. Scale bars, 200 μm and 50 μm. D. Pearson correlation of PRAME, TET2 and 5hmC at the single cell level. E. Scatter plot of PRAME and 5hmC CyCIF mean fluorescence intensities of 2,511 SOX10+ single melanoma precursor cells in 32 precursor regions from 14 patients.
Figure 3.
Figure 3.. 5hmC levels are reduced the PRAME promoter, concurring with the down regulation of TET2 and TET3 gene expression in melanoma.
A. hMeDIP-seq detected decreased 5hmC levels at the 5’ promoter region of the PRAME gene in melanoma compared to nevi samples. Boxed region, 5hmC sites at PRAME promoter shown 5hmC loss in melanoma. Red bars, position of hMeDIP-qPCR primers in (B). The layered H3K4me1, H3K4me3 and H3K27ac from The Encyclopedia of DNA Elements (ENCODE) mark promoter and potential enhancers. B. hMeDIP-qPCR validation using independent melanoma and nevi samples. **, p<0.001; *, p<0.05. Error bar, standard deviation of triplicate qPCR reactions. Enrichment relative to SMCP 5hmC negative control region and normalize by inputs. C. Boxplot of TET1/2/3 expression in healthy and melanoma samples in the TCGA and GTEx RNA-seq databases. *, p<0.001 D. Correlation plot of PRAME with TET1, TET2, and TET3 gene expression in healthy and melanoma in the TCGA and GTEx RNA-seq databases. R, Pearson correlation coefficient.
Figure 4.
Figure 4.. TET2 ectopic expression restores 5hmC at PRAME promoter and suppresses PRAME gene expression.
A. hMeDIP-seq profile at PRAME genes in A2058 control and A2058 TET2-OE cells as in Fig. 3A. B. hMeDIP-qPCR validation using independent samples. *, p<0.05. Error bar, standard deviation of triplicate qPCR reactions. Enrichment relative to SMCP 5hmC negative control region and normalize by inputs. C. Immunofluorescence staining of 5hmC (green) and PRAME (red) A2058-Control and A2058-TETOE counter staining with DAPI (blue) D-E. Comparison of TET2 (B) and PRAME (C) mRNA levels in A2058-Control cells and A2058-TET2OE cells by qRT-PCR. F-G. Western blot of TET2 (F) and PRAME (G) in A2058-Control and A2058-TET2OE cell lines. β-actin was utilized as a loading control. Bottom panel, densitometry quantification of western blots. *, p<0.05; **, p<0.01; ***, p<0.001, by Student’s T-test.

References

    1. Lezcano C, Jungbluth AA, Busam KJ. PRAME Immunohistochemistry as an Ancillary Test for the Assessment of Melanocytic Lesions. Surgical Pathology Clinics. 2021;14(2):165–75. - PMC - PubMed
    1. Lezcano C, Jungbluth AA, Busam KJ. Immunohistochemistry for PRAME in Dermatopathology. The American Journal of Dermatopathology. 2023;45(11):733. - PMC - PubMed
    1. Lezcano C, Jungbluth AA, Nehal KS, Hollmann TJ, Busam KJ. PRAME Expression in Melanocytic Tumors. Am J Surg Pathol. 2018;42(11):1456–65. - PMC - PubMed
    1. Lezcano C, Pulitzer M, Moy AP, Hollmann TJ, Jungbluth AA, Busam KJ. Immunohistochemistry for PRAME in the Distinction of Nodal Nevi From Metastatic Melanoma. Am J Surg Pathol. 2020;44(4):503–8. - PMC - PubMed
    1. Lezcano C, Jungbluth AA, Busam KJ. Comparison of Immunohistochemistry for PRAME With Cytogenetic Test Results in the Evaluation of Challenging Melanocytic Tumors. Am J Surg Pathol. 2020;44(7):893–900. - PMC - PubMed

Publication types