[Preprint]. 2024 Jul 23:2024.07.22.604437.
doi: 10.1101/2024.07.22.604437.

A Hypothalamic Circuit that Modulates Feeding and Parenting Behaviors

Affiliations

A Hypothalamic Circuit that Modulates Feeding and Parenting Behaviors

Ivan C Alcantara et al. bioRxiv. .

Update in

  • A hypothalamic circuit that modulates feeding and parenting behaviours.
    Alcantara IC, Li C, Gao C, Rodriguez González S, Mickelsen LE, Papas BN, Goldschmidt AI, Cohen IM, Mazzone CM, de Araujo Salgado I, Piñol RA, Xiao C, Karolczak EO, Li JL, Cui G, Reitman ML, Krashes MJ. Alcantara IC, et al. Nature. 2025 Sep;645(8082):981-990. doi: 10.1038/s41586-025-09268-5. Epub 2025 Jul 30. Nature. 2025. PMID: 40739345

Abstract

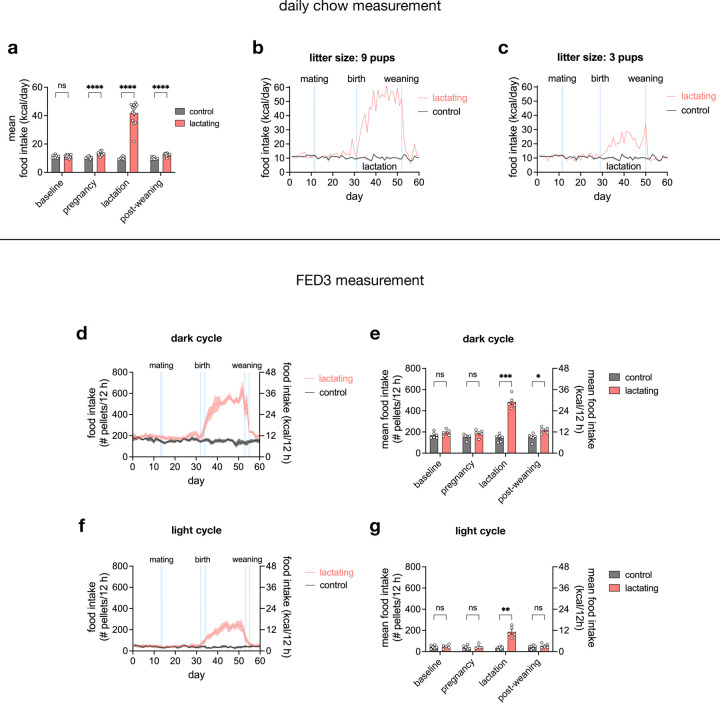
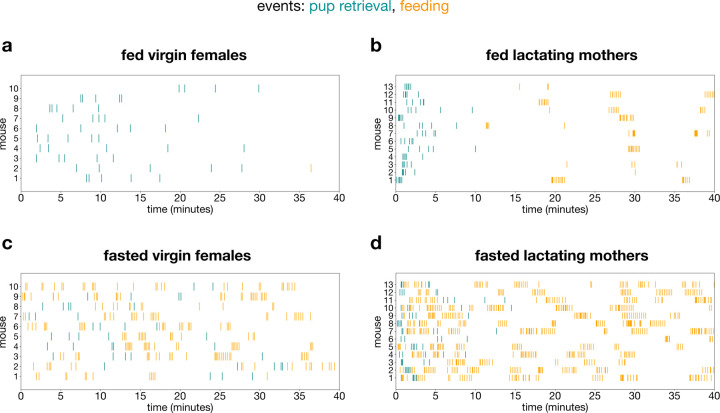
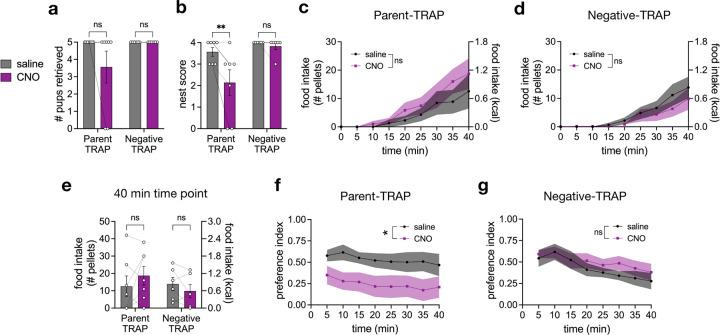
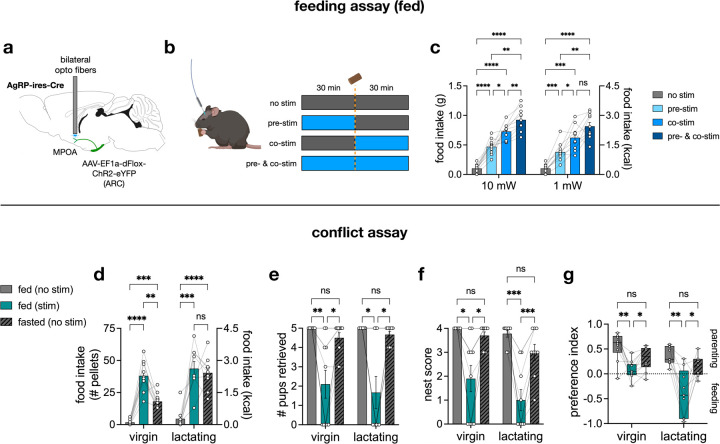
Across mammalian species, new mothers undergo considerable behavioral changes to nurture their offspring and meet the caloric demands of milk production1-5. While many neural circuits underlying feeding and parenting behaviors are well characterized6-9, it is unclear how these different circuits interact and adapt during lactation. Here, we characterized the transcriptomic changes in the arcuate nucleus (ARC) and the medial preoptic area (MPOA) of the mouse hypothalamus in response to lactation and hunger. Furthermore, we showed that heightened appetite in lactating mice was accompanied by increased activity of hunger-promoting agouti-related peptide (AgRP) neurons in the ARC. To assess the strength of hunger versus maternal drives, we designed a conflict assay where female mice chose between a food source or a chamber containing pups and nesting material. Although food-deprived lactating mothers prioritized parenting over feeding, hunger reduced the duration and disrupted the sequences of parenting behaviors in both lactating and virgin females. We discovered that ARCAgRP neurons directly inhibit bombesin receptor subtype-3 (BRS3) neurons in the MPOA, a population that governs both parenting and satiety. Selective activation of this ARCAgRP to MPOABRS3 circuit shifted behaviors from parenting to food-seeking. Thus, hypothalamic networks are modulated by physiological states and work antagonistically during the prioritization of competing motivated behaviors.


Figures

Extended Data Fig. 1 |
Extended Data Fig. 1 |. Lactating mice exhibit increased appetite during dark and light cycles.
a, mean daily food intake of control (n = 8) and lactating (n = 14) mice during baseline, pregnancy, lactation, and post-weaning. b-c, daily food intake of representative lactating mice with 9 pups (b) or 3 pups (c). d-g, daily food intake measurement using FED3 in the dark cycle (d-e) and light cycle (f-g) of control (n = 6) and lactating (n = 5) mice during baseline, pregnancy, lactation, and post-weaning. Plots show mean ± s.e.m. Data were analyzed using two-way RM-ANOVA with Šidák’s multiple comparisons test (a, e, g). See Supplementary Table 1 for detailed statistical information.
Extended Data Fig. 2 |
Extended Data Fig. 2 |. Agrp+ neuronal cluster in the ARC exhibits the most changes in gene expression upon fasting.
a, number of cells per ARC neuronal cluster split by group. b, heat map of relative expression of marker genes in each ARC neuronal cluster with dendrogram (top) showing similarities between clusters. c, FeaturePlot showing ARC neurons and clusters in UMAP space with Agrp expression localized in cluster 0. d, contribution of ARC clusters to first 8 PCs of the variance in gene expression between fasted virgin and fed virgin groups, highlighting Agrp+ cluster 0. Dashed red line shows contribution if all cluster contributed equally. e, visualization of how much ARC clusters change transcriptionally between fasted virgin and fed virgin groups based on clusters’ distance from the origin in PCA space, highlighting Agrp+ cluster 0.
Extended Data Fig. 3 |
Extended Data Fig. 3 |. MPOA neuronal clusters co-express several genetic markers for parenting-promoting neurons.
a, number cells per MPOA neuronal cluster separated by group. b, heat map of relative expression of marker genes in each MPOA neuronal cluster with dendrogram (top) showing similarities between clusters. c, fractions of MPOA neurons that are positive, i.e. contains at least 1 unique molecular identifier (UMI), for select genes. d, fractions of neurons that are Brs3+ per MPOA cluster, highlighting cluster 3 in green. e, co-expression matrix showing fraction of Gene A+ MPOA neurons that are also Gene B+, highlighting co-expression with Brs3 (e.g., 38% of Brs3+ neurons are Slc17a6+).
Extended Data Fig. 4 |
Extended Data Fig. 4 |. Lactation and fasted states affect pup retrieval and feeding behavioral sequences.
a-d, raster plots showing pup retrieval (blue) and feeding (orange) events in fed virgin females (a), fed lactating mothers (b), fasted virgin females (c), and fasted lactating mothers (d) (nvirgin = 10 mice, nlactating = 13 mice).
Extended Data Fig. 5 |
Extended Data Fig. 5 |. Photostimulation of ARCAgRP-eYFP projections to MPOA does not affect feeding or parenting behaviors.
a, sagittal view of the mouse brain (Allen Brain Atlas) depicting the surgery procedure for optogenetics. b, schematic of photostimulation paradigm in fed mice for feeding assay (n = 6 virgin females). c, 30 min food intake with or without photostimulation. d-g, data from conflict assay showing food intake (d), number of pups retrieved (e), nest score (f), and preference index (g) (n = 6 virgin females). Bar graphs show mean ± s.e.m. Box plots show median, upper/lower quartiles, and upper/lower extremes. Data were analyzed using a two-tailed paired t-test (c), one-way RM-ANOVA with Tukey’s multiple comparison’s test (d, g), or Friedman test with Dunn’s multiple comparisons test (e-f). *P < 0.05, **P < 0.01, ***P < 0.001, ****P < 0.0001. ns, non-significant. See Supplementary Table 1 for detailed statistical information.
Extended Data Fig. 6 |
Extended Data Fig. 6 |. Inhibition of Esr1, Calcr, Crh, or MC4R neurons in MPOA with hM4Di.
a-d, data from conflict assay showing (from left to right) food intake, number of pups retrieve, nest score, and preference index of animals expressing hM4Di in MPOAEsr1 (a, n = 8 virgin females), MPOACalcr (b, n = 10 virgin females), MPOACrh (c, n = 6 virgin females), or MPOAMC4R (d, n = 6 lactating mothers). Bar graphs show mean ± s.e.m. Box plots show median, upper/lower quartiles, and upper/lower extremes. Data were analyzed using two-way RM-ANOVA with Fisher’s LSD test. See Supplementary Table 1 for detailed statistical information.
Extended Data Fig. 7 |
Extended Data Fig. 7 |. Inhibition of parenting neurons in MPOA reduces parenting in fed lactating mothers.
a-g, data from conflict assay showing the number of pups retrieved (a), nest score (b), food intake over time in Parent-TRAP (c) and Negative-TRAP (d) animals, total food intake at 40 min time point (e), preference index over time in Parent-TRAP (f) and Negative-TRAP (g) animals (n = 7 Parent-TRAP lactating mothers, n = 6 Negative TRAP lactating mothers). Bar and line graphs show mean ± s.e.m. Box plots show median, upper/lower quartiles, and upper/lower extremes. Data were analyzed using two-way RM-ANOVA with Šidák’s multiple comparisons test. Significance symbols in c, d, f, g show the treatment effect of CNO. *P < 0.05, **P < 0.01, ***P < 0.001, ****P < 0.0001. ns, non-significant. See Supplementary Table 1 for detailed statistical information.
Extended Data Fig. 8 |
Extended Data Fig. 8 |. MPOABRS3 neurons are responsive to pups.
a, schematic of calcium imaging of MPOABRS3-GCaMP6s using a miniscope; created with BioRender. b-d, calcium dynamics traces of individual MPOABRS3 neurons in response to a pup that was retrieved (b), food (c), or an object (d) (n = 1 fed virgin female).
Fig. 1 |
Fig. 1 |. Lactating mice exhibit increased appetite and ARCAgRP neuronal activity.
a, food intake of lactating mice (n = 14) and female controls (n = 8). b, food intake during lactation (21 averaged days) vs. litter size (n = 14 lactating mice). c-e, FED3 measurements showing hourly food intake of 21 averaged days per mouse (c), inter-pellet intervals (d), and meal sizes (e) during lactation period (nlactating = 5 mice, nvirgin = 6 mice). Pellets consumed within 60 s are part of one meal. f, schematic of 4 groups of mice for scRNA-seq created with BioRender. g-i, Agrp+ ARC cluster: Venn diagrams of DEGs in fasted and lactating states (g), volcano plots of DEGs comparing fasted virgins vs. fed virgins (left) and fed lactating mothers vs. fed virgins (right) (h), and fold change correlation of shared DEGs in fasted and lactating states (i). j, firing rate of ARCNPY-hrGFP neurons (left, nvirgin = 94 neurons, nlactating = 88 neurons) and mean firing rate per mouse (right, n = 6 mice per group). k, fiber photometry recordings of ARCAgRP-GCaMP6s in fed and fasted virgin (n = 5) and lactating mice (n = 6). l, mean ΔF/F after food presentation. Plots show mean ± s.e.m. Data were analyzed using simple linear regression (b), unpaired two-tailed t-test (j), or 2-way repeated-measures analysis of variance (RM-ANOVA) with Fisher’s Least Significant Difference (LSD) test (l). *P < 0.05, **P < 0.01, ***P < 0.001, ****P < 0.0001. ns, non-significant. See Supplementary Table 1 for detailed statistical information.
Fig. 2 |
Fig. 2 |. An MPOA neuronal cluster (#3) is highly transcriptionally responsive to both lactation and fasted states.
a-c, comparison of fed lactating vs. fed virgin groups showing the contribution of each cluster to the first 9 PCs (a), magnitude of changes in transcriptomic profile of each cluster during lactation based on cluster’s distance from origin in PCA space (b), and DEGs in cluster 3 in the lactating state. d-f, comparison of fasted virgin vs. fed virgin groups showing the contribution of each cluster to the first 10 PCs (d), magnitude of changes in transcriptomic profile of each cluster during fasting based on cluster’s distance from origin in PCA space (e), and DEGs in cluster 3 in the fasted state (f). g, DotPlot of clusters 3, 5, and 14 showing expression of Slc17a6 (Vglut2), Slc32a1 (Vgat), top 5 enriched genes in cluster 3 (Pde1c, Ptprk, Esr1, Dgkb, Grm8), parenting markers (Gal, Calcr, Prlr, Pgr, Brs3), and NPY receptors (Npy1r, Npy2r). Dashed red line in a and d show contribution if all cluster contributed equally. Colors in c and f indicate select DEGs that have been implicated in parenting, appetite, endocrinology, metabolism, and other neuronal processes (green); other significant DEGs (gray); non-significant DEGs (black).
Fig. 3 |
Fig. 3 |. Hunger delays and reduces parenting behaviors in virgin females and lactating mothers.
a, schematic of 40-minute conflict assay created with BioRender and adapted FED3 cartoon from a previous publication19. b, percent of animals that either performed pup retrieval or feeding as their first behavior (nvirgin = 10 mice, nlactating = 13 mice). c-f, probability density (1-min bins) of pup retrieval and feeding events throughout the conflict assay (all trials). 1 total pellet consumed by 1 virgin female (fed, with pups) at time = 36.45 min is not shown to avoid skewing the visualization. g, transition probabilities between pup retrieval and feeding events in fasted virgin females and fasted lactating mothers. Only the feeding events prior to the completion of pup retrieval were used for the calculation. h, food intake. i, number of pups retrieved. j, latency to retrieve the first pup and last pup by lactating mothers. k, nest score. l, preference index based on time spent in parenting and feeding chambers. m, scatterplot of food intake (# pellets) vs. % time in parenting chamber of virgin and lactating females in the fasted (with pups) condition. Bar graphs show mean ± s.e.m. Box plots show median, upper/lower quartiles, and upper/lower extremes. Data were analyzed using two-way RM-ANOVA with Šidák’s multiple comparisons test (h-l) or simple linear regression (m). *P < 0.05, **P < 0.01, ***P < 0.001, ****P < 0.0001. ns, non-significant. See Supplementary Table 1 for detailed statistical information.
Fig. 4 |
Fig. 4 |. Optogenetic stimulation of ARCAgRP projections to MPOA drives feeding and reduces parenting.
a, sagittal view of the mouse brain (from Allen Brain Atlas) depicting the surgery procedure for optogenetics. b, schematic created with BioRender of stimulation paradigms in fed mice: no stim (light off), pre-stim (light on 30 min before food access), co-stim (light on 30 min during food access), and pre- & co-stim (light on 30 min before and 30 min during food access). c, 30 min food intake across different stimulation paradigms at 10 and 1 mW of light intensity; “no stim” datapoints are identical for 10 and 1 mW comparisons (n = 10 virgin females). d-g, results from the conflict assay showing food intake (d), number of pups retrieved (e), nest score (f), and preference index (g) (nvirgin = 10 mice, nlactating = 9 mice; same subjects). Bar graphs show mean ± s.e.m. Box plots show median, upper/lower quartiles, and upper/lower extremes. Data were analyzed using two-way RM-ANOVA (c) or mixed-effects model analysis (d-g) with Šidák’s multiple comparisons test. *P < 0.05, **P < 0.01, ***P < 0.001, ****P < 0.0001. ns, non-significant. See Supplementary Table 1 for detailed statistical information.
Fig. 5 |
Fig. 5 |. Inhibition of parenting neurons in MPOA reduces parenting and shifts priority to feeding in fasted lactating mothers.
a, schematic of TRAP system and TRAP induction strategy to label parenting-responsive MPOA neurons with hM4Di-mCherry; created using BioRender and the Allen Brain Atlas. b-k, data from the conflict assay with fasted lactating Parent-TRAP (n = 7) and Negative-TRAP (n = 6) mice injected with saline or CNO. b, number of pups retrieved. c, nest score. d-e, percent of total pellets consumed over time in Parent-TRAP mice (d) and Negative-TRAP mice (e). f-g, food intake of mice at 10 minutes (f) and 40 minutes (g). h-i, preference index of Parent-TRAP mice (h) and Negative-TRAP mice (i) over time. Each datapoint represents the mean preference index from time = 0 min to that time point. j-k, preference index at 10 minutes (j) and 40 minutes (k). Bar and line graphs show mean ± s.e.m. Box plots show median, upper/lower quartiles, and upper/lower extremes. Data were analyzed using two-way RM-ANOVA with Šidák’s multiple comparisons test. Significance symbol in d is a post-hoc comparison of saline and CNO at time = 10 min. Significance symbols in e, h, i show the treatment effect of CNO. *P < 0.05, **P < 0.01, ***P < 0.001, ****P < 0.0001. ns, non-significant. See Supplementary Table 1 for detailed statistical information.
Fig. 6 |
Fig. 6 |. MPOABRS3 neurons regulate parenting and feeding behaviors.
a-d, MPOABRS3-hM4Di virgin females (n = 8) run in the conflict assay showing number of pups retrieved (a), nest score (b), preference index (c), and food intake (d). e, food intake of fed MPOABRS3-hM4Di virgin females (n = 7). f, number of MPOABRS3-hM3Dq virgin males (n = 10) that retrieved or attacked pups, or neither. g, food intake of fasted MPOABRS3-hM3Dq virgin males (n = 6). h-m, fiber photometry recordings of MPOABRS3-GCaMP6s neurons in fed virgin females (n = 6) presented with either a pup or an object (h), representative female interacting with pup (i), signal aligned to 1st pup contact (j), mean signal pre- and post-pup contact (k), signal aligned to food access (l), and mean response to food in the fed and fasted states (m). n, circuit mapping strategy created with BioRender. o, averaged inhibitory post-synaptic current trace (32 trials) of a representative MPOABRS3 neuron following light stimulation (red, no picrotoxin) and following light stimulation with picrotoxin (black). Bar and line graphs show mean ± s.e.m. Box plots show median, upper/lower quartiles, and upper/lower extremes. Data were analyzed using two-way RM-ANOVA (a-e, g) with Fisher’s LSD test (a-d), Chi-square test (f), or Wilcoxon matched-pairs signed rank test (k, m). Significance symbols in e and g show the treatment effect of CNO by two-way RM-ANOVA. *P < 0.05, **P < 0.01, ***P < 0.001, ****P < 0.0001. ns, non-significant. See Supplementary Table 1 for detailed statistical information.

References

    1. Prentice A. M. & Prentice A. Energy costs of lactation. Annu Rev Nutr 8, 63–79, doi: 10.1146/annurev.nu.08.070188.000431 (1988). - DOI - PubMed
    1. Fleming A. S. & Rosenblatt J. S. Maternal behavior in the virgin and lactating rat. J Comp Physiol Psychol 86, 957–972, doi: 10.1037/h0036414 (1974). - DOI - PubMed
    1. Brunton P. J. & Russell J. A. The expectant brain: adapting for motherhood. Nat Rev Neurosci 9, 11–25, doi: 10.1038/nrn2280 (2008). - DOI - PubMed
    1. Numan M. & Woodside B. Maternity: neural mechanisms, motivational processes, and physiological adaptations. Behav Neurosci 124, 715–741, doi: 10.1037/a0021548 (2010). - DOI - PubMed
    1. Woodside B., Budin R., Wellman M. K. & Abizaid A. Many mouths to feed: the control of food intake during lactation. Front Neuroendocrinol 33, 301–314, doi: 10.1016/j.yfrne.2012.09.002 (2012). - DOI - PubMed

Publication types

LinkOut - more resources