[Preprint]. 2025 Mar 3:2024.07.23.604803.
doi: 10.1101/2024.07.23.604803.

Prdm16-dependent antigen-presenting cells induce tolerance to intestinal antigens

Affiliations

Prdm16-dependent antigen-presenting cells induce tolerance to intestinal antigens

Liuhui Fu et al. bioRxiv. .

Update in

Abstract

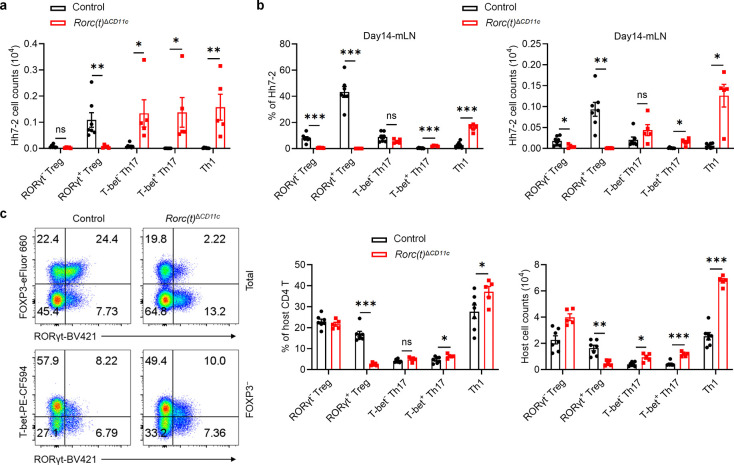
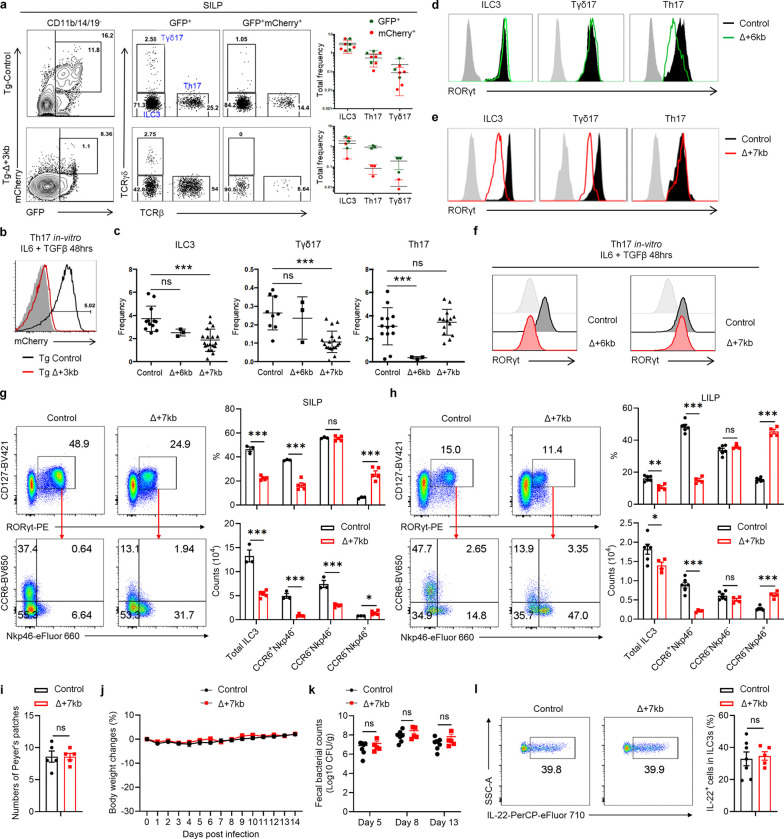
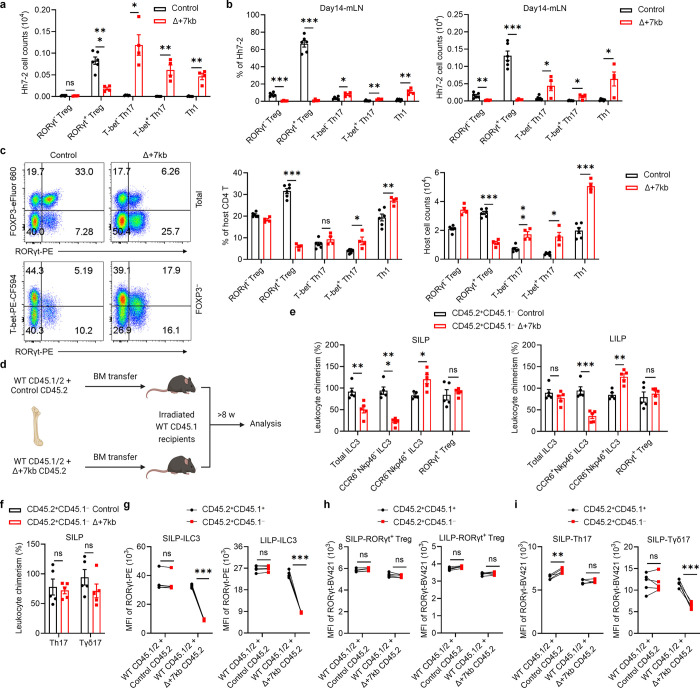
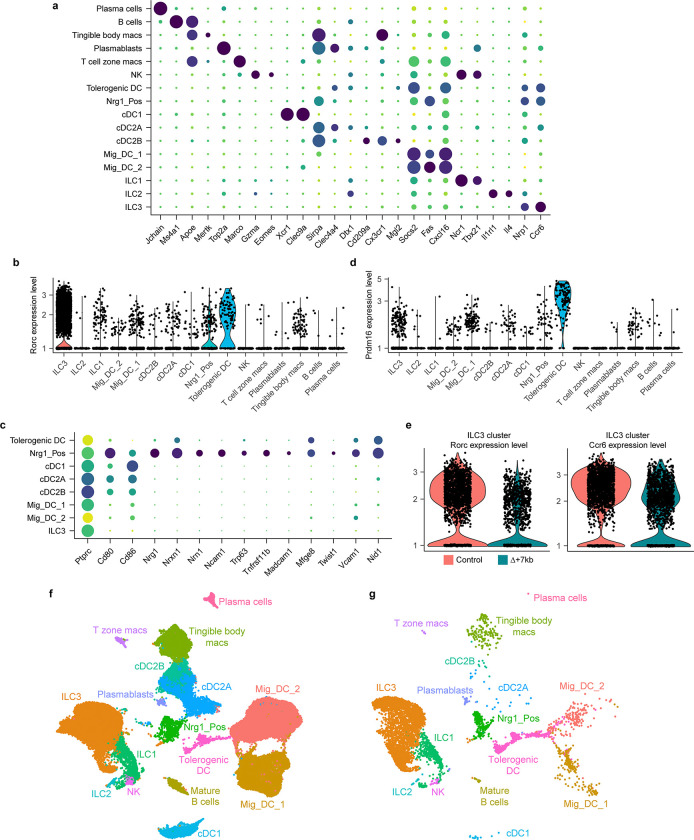
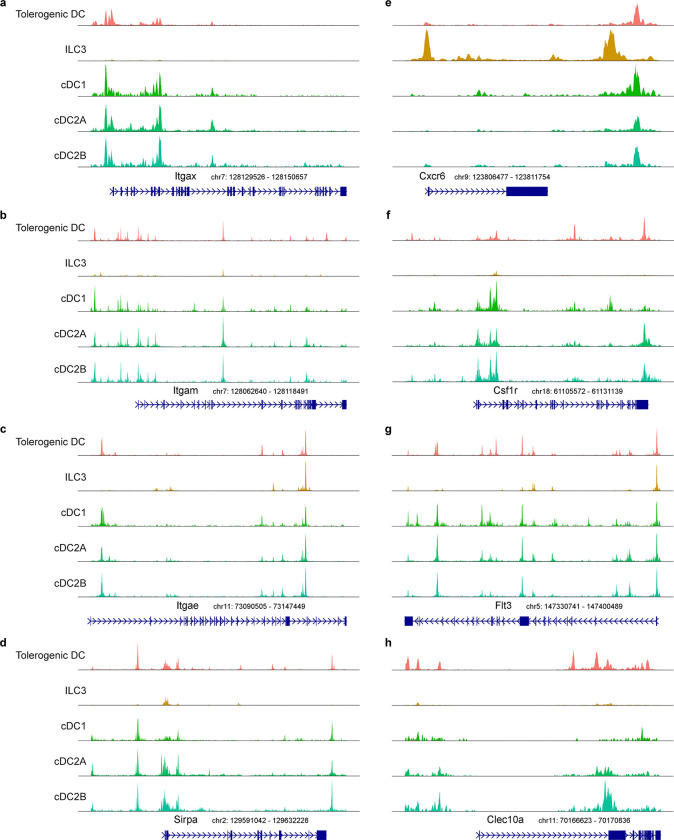
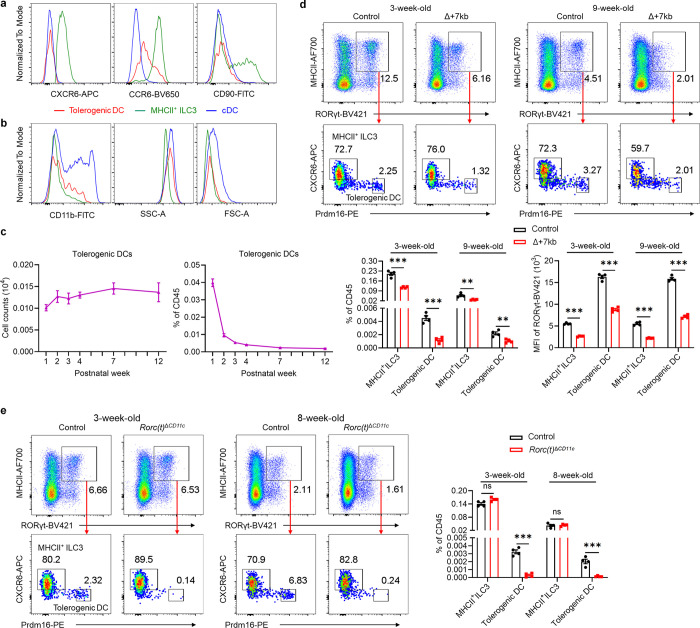
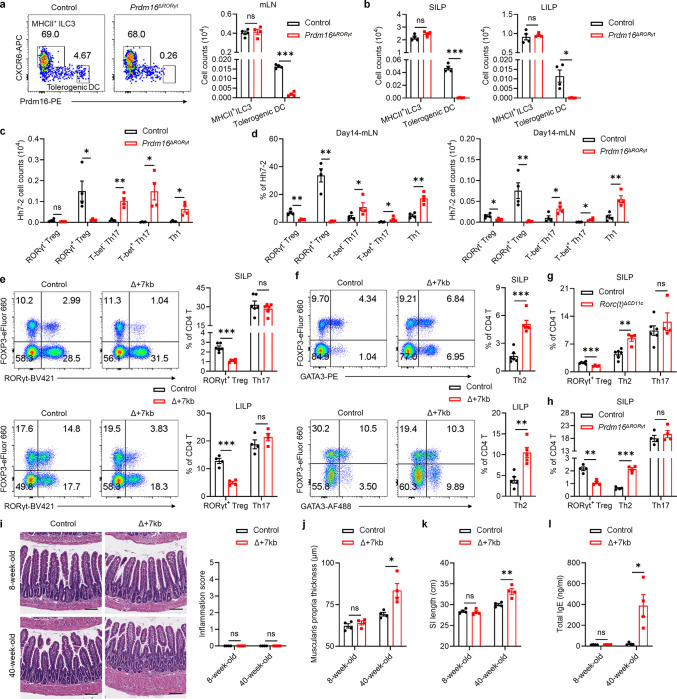
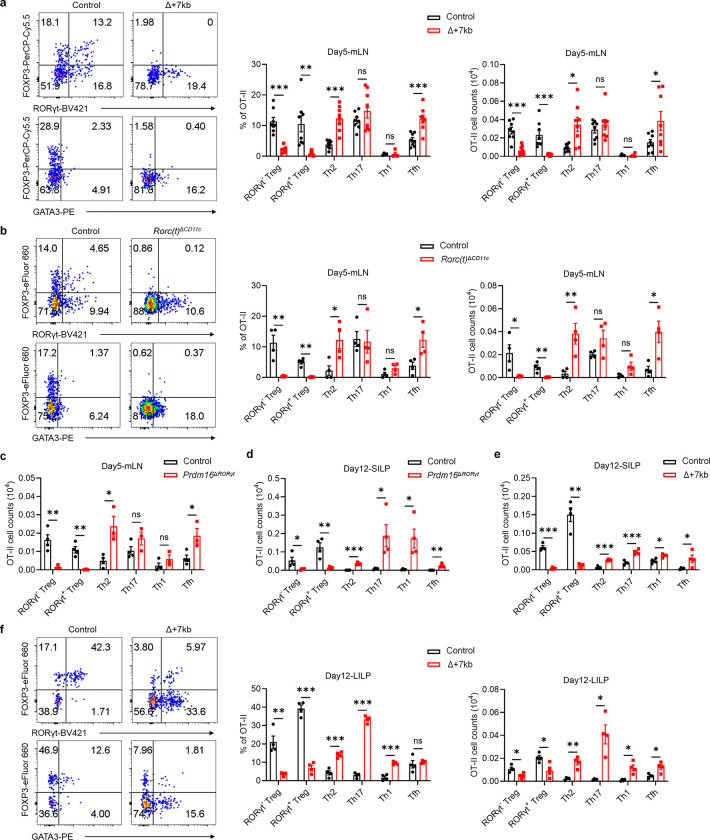
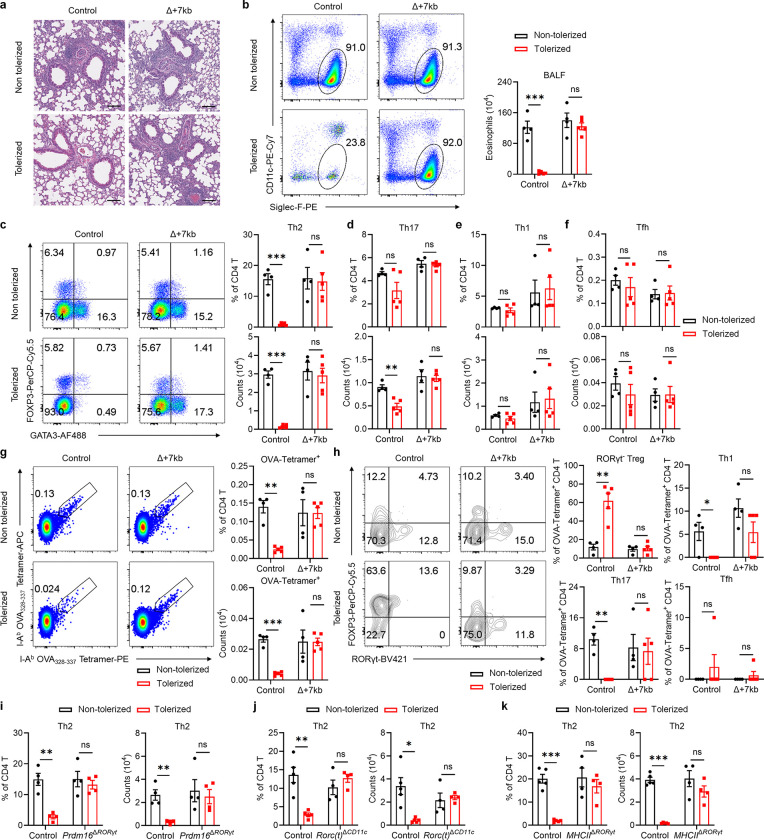
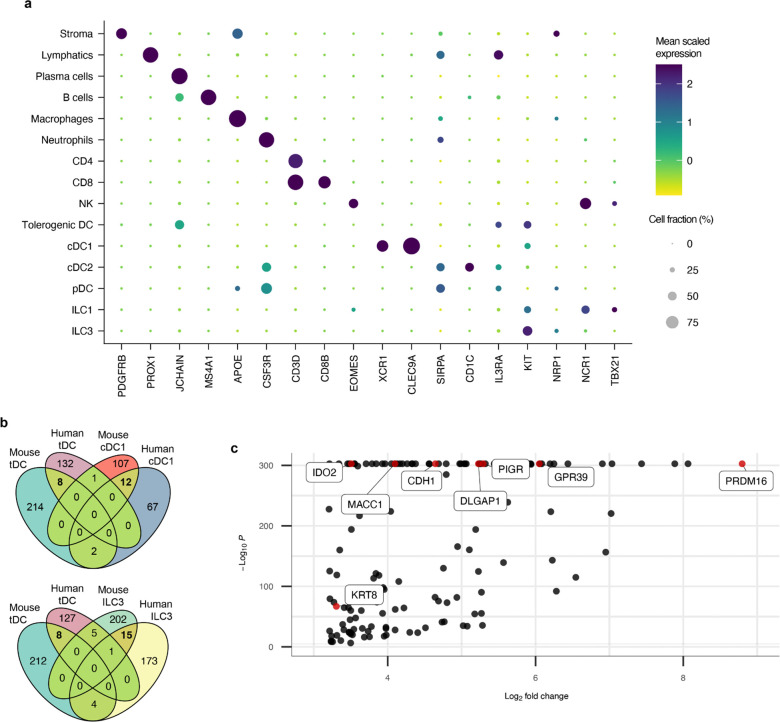
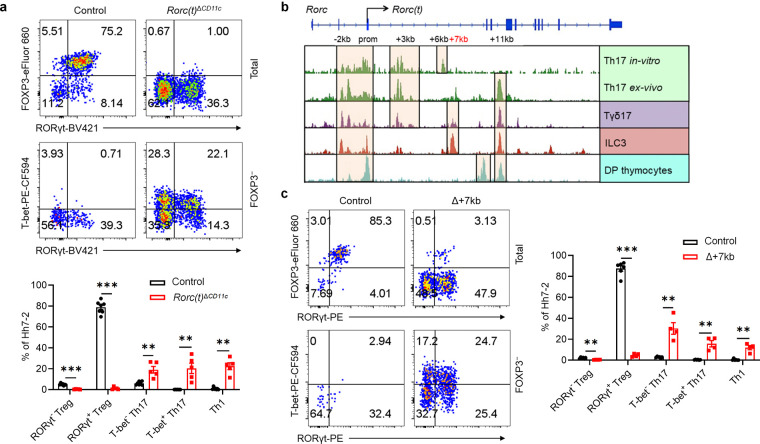
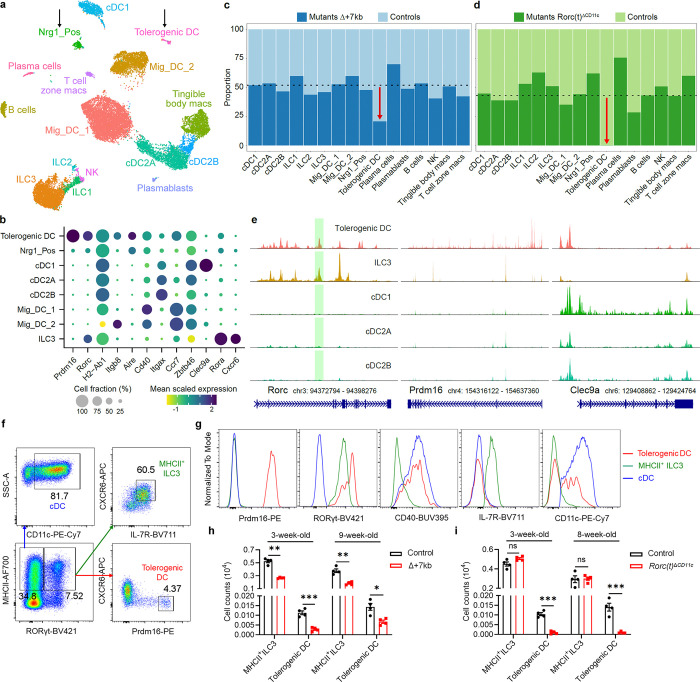
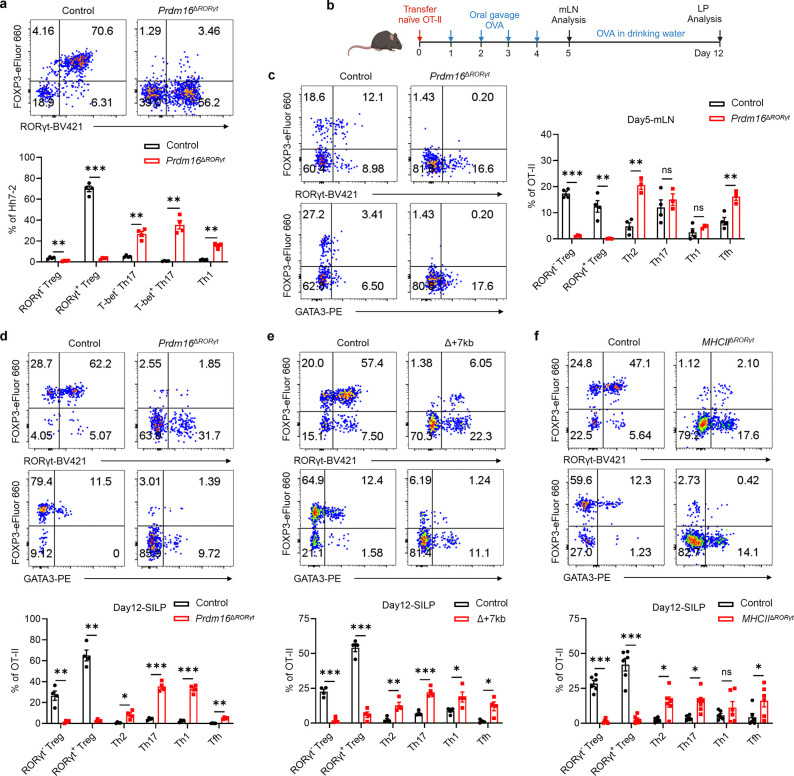
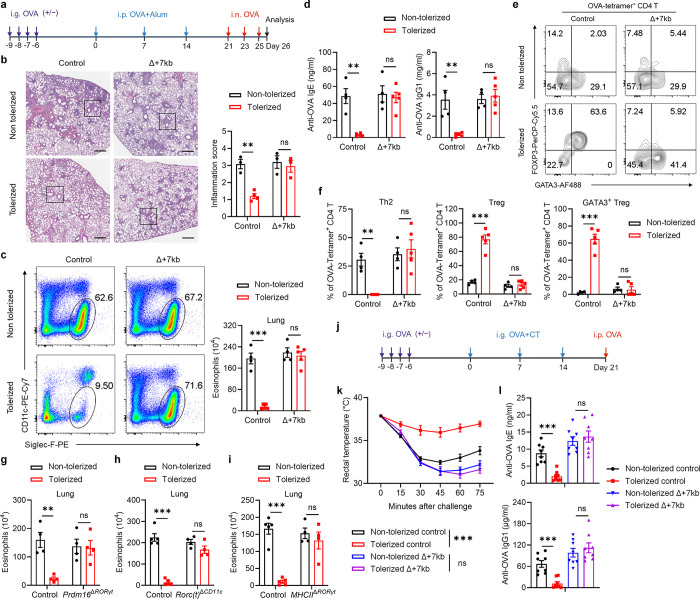
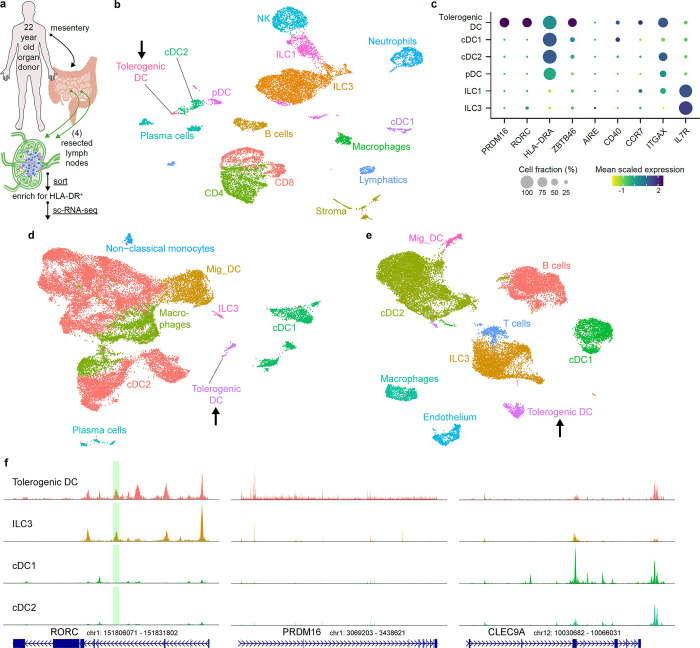
The gastrointestinal tract is continuously exposed to foreign antigens in food and commensal microbes with potential to induce adaptive immune responses. Peripherally induced T regulatory (pTreg) cells are essential for mitigating inflammatory responses to these agents1-4. While RORγt+ antigen-presenting cells (RORγt-APCs) were shown to program gut microbiota-specific pTreg5-7, their definition remains incomplete, and the APC responsible for food tolerance has remained elusive. Here, we identify a distinct subset of RORγt-APCs, designated tolerogenic dendritic cells (tDC), required for differentiation of both food- and microbiota-specific pTreg cells and for establishment of oral tolerance. tDC development and function require expression of the transcription factors Prdm16 and RORγt, as well as a unique Rorc(t) cis-regulatory element. Gene expression, chromatin accessibility, and surface marker analysis establish tDC as myeloid in origin, distinct from ILC3, and sharing epigenetic profiles with classical DC. Upon genetic perturbation of tDC, we observe a substantial increase in food antigen-specific T helper 2 (Th2) cells in lieu of pTreg, leading to compromised tolerance in mouse models of asthma and food allergy. Single-cell analyses of freshly resected mesenteric lymph nodes from a human organ donor, as well as multiple specimens of human intestine and tonsil, reveal candidate tDC with co-expression of PRDM16 and RORC and an extensive transcriptome shared with mice, highlighting an evolutionarily conserved role across species. Our findings suggest that a better understanding of how tDC develop and how they regulate T cell responses to food and microbial antigens could offer new insights into developing therapeutic strategies for autoimmune and allergic diseases as well as organ transplant tolerance.


Conflict of interest statement

Competing interests D.R.L. is cofounder of Vedanta Biosciences and ImmunAI, on the advisory boards of IMIDomics, Sonoma Biotherapeutics, NILO Therapeutics, and Evommune, and on the board of directors of Pfizer Inc. All other authors declare no competing interests.

Figures

Extended Data Fig. 1 |
Extended Data Fig. 1 |. RORγt expression in CD11c lineage APC is necessary for directing the differentiation of gut microbiota-specific pTregs.
a, Numbers of Hh-specific pTreg, Th17 and Th1 cells in the LILP of Hh-colonized control (n = 7) and Rorc(t)ΔCD11c (n = 5) mice at 14 days after adoptive transfer of naïve Hh7–2tg CD4+ T cells. b, Phenotype of Hh-specific T cells in the mLN of mice shown in a. c, Phenotype of host CD4 T cells in the LILP of mice shown in a, with representative flow cytometry profiles (left) and aggregate quantitative data (right). The flow cytometry plots are gated on total (upper) and FOXP3 (lower) host CD4 T cells (CD45+B220TCRγδTCRβ+CD4+CD90.1). Data are pooled from two independent experiments. Data are means ± s.e.m.; ns, not significant; statistics were calculated by unpaired two-sided t-test.
Extended Data Fig. 2 |
Extended Data Fig. 2 |. Characterization of lineage-specific Rorc(t) cis-regulatory elements.
a,b, Representative flow cytometry plots and summary graphs depicting comparison of SILP GFP+ and mCherry+ populations (a) as well as mCherry expression of in vitro differentiated Th17 cells (b) in BAC transgenic mice bred to RORγt GFP reporter mice (heterozygous for gfp knockout allele), Tg (Control Rorc(t)-mCherry);Rorc(t)+/gfp and Tg (Δ+3kb Rorc(t)-mCherry);Rorc(t)+/gfp mice. c, Summary of indicated SILP RORγt+ populations as frequency of SILP mononuclear cells from control, Δ+6kb and Δ+7kb mice. d,e, Representative histograms showing RORγt expression in the SILP RORγt+ populations from mice shown in c. f, RORγt expression among in vitro differentiated Th17 cells isolated from mice shown in c. g,h, Phenotype of ILC3 (CD45+LinCD127+RORγt+) subsets in the SILP (g) and LILP (h) of control and Δ+7kb mice. SILP: control mice, n = 3; Δ+7kb mice, n = 5. LILP: control mice, n = 6; Δ+7kb mice, n = 4. i, Numbers of Peyer’s patches in control (n = 5) and Δ+7kb (n = 5) mice. j-l, Body weight changes (j), fecal C. rodentium counts (k) and frequencies of IL-22+ cells in RORγt+ ILC3 (day 14, ex vivo stimulation with IL-23) in the LILP (l) of control (n = 7) and Δ+7kb (n = 5) mice post C. rodentium infection. Data in j-l are pooled from two independent experiments. Data in g-i are representative of two (g,h) or three (i) independent experiments. Data are means ± s.d.; ns, not significant; statistics were calculated by unpaired two-sided t-test.
Extended Data Fig. 3 |
Extended Data Fig. 3 |. Rorc(t) +7kb regulates RORγt+ Treg in a cell-extrinsic manner.
a, Numbers of Hh-specific T cells in the LILP of Hh-colonized control (n = 6) and Δ+7kb (n = 4) mice at 14 days after adoptive transfer of naïve Hh7–2tg CD4+ T cells. b, Phenotype of Hh-specific T cells in the mLN of mice shown in a. c, Phenotype of host CD4 T cells in the LILP of mice shown in a. d, Experimental design for the bone marrow (BM) chimeric experiments in e-i. e,f, Relative CD45.2+CD45.1 leukocyte chimerism normalized to CD45.2+CD45.1 splenic B cells (n = 5). g-i, RORγt mean fluorescence intensity (MFI) of CD45.2+CD45.1+ and CD45.2+CD45.1 RORγt+ cells in the SILP and LILP (n = 5). Data are representative of two independent experiments. Data are means ± s.e.m.; ns, not significant; statistics were calculated by unpaired two-sided t-test (a-c,e,f) and paired two-sided t-test (g-i).
Extended Data Fig. 4 |
Extended Data Fig. 4 |. Sequencing annotation and analysis of Δ+7kb mouse model mLN and multiome datasets.
a, Dot plot of all 16 cell types from Δ+7kb mouse model mLN (mutant and control mice combined), demonstrating canonical genes used to annotate each cluster. b, Violin plot of Rorc expression across all clusters. c, Dot plot of select APC clusters, examining genes described for Nrg1_Pos as well as FRC/mTEC cell types. d, Violin plot of Prdm16 expression across all clusters. e, Violin plots of Rorc and Ccr6 expression within the ILC3 cluster, comparing Δ+7kb mutant versus control biological conditions. f, Annotated UMAP with datasets combined from all murine experiments (all mutant and control animals, as well subsequent multi-ome experiment). g, Re-analysis of raw data from Akagbosu et al., which was computationally integrated alongside data in f.
Extended Data Fig. 5 |
Extended Data Fig. 5 |. Comparing the epigenetic landscape across APC populations.
a-h, Chromatin accessibility profiles for Itgax, Itgam, Itgae, Sirpa, Cxcr6, Csf1r, Flt3, and Clec10a loci across the indicated mouse APC populations.
Extended Data Fig. 6 |
Extended Data Fig. 6 |. Selective loss of tolerogenic DC in Rorc(t)ΔCD11c mice.
a,b, Expression of the indicated proteins in tolerogenic DC, MHCII+ ILC3 and cDC, as gated in Fig. 2f. c, Numbers and frequencies of tolerogenic DC (CD45+Ly6GB220TCRγδTCRβMHCII+RORγt+CXCR6Prdm16high) in mLN from week 1 to week 12 (n = 5–6 per timepoint). d, Representative flow cytometry plots (top), frequencies (bottom left) and RORγt MFI (bottom right) of tolerogenic DC and MHCII+ ILC3 in the mLN of 3-week-old and 9-week-old control (n = 4) and Δ+7kb (n = 4) mice. e, Representative flow cytometry plots (left) and frequencies (right) of tolerogenic DCs and MHCII+ ILC3 in the mLN of 3-week-old and 8-week-old control (n = 4) and Rorc(t)ΔCD11c (n = 4) mice. The top flow cytometry plots are gated on CD45+Ly6GB220TCRγδTCRβ. Data in a,b,d,e are representative of two (d,e) or three (a,b) independent experiments. Data are means ± s.e.m.; ns, not significant; statistics were calculated by unpaired two-sided t-test.
Extended Data Fig. 7 |
Extended Data Fig. 7 |. Tolerogenic DC deficiency leads to type 2 gastrointestinal pathology.
a,b, Representative flow cytometry plots and numbers of tolerogenic DC and MHCII+ ILC3 in the mLN (a), SILP and LILP (b) of control (n = 4) and Prdm16ΔRORγt (n = 4) mice. The flow cytometry plots are gated on CD45+Ly6GB220TCRγδTCRβMHCII+RORγt+. c, Numbers of Hh-specific T cells in the LILP of Hh-colonized control (n = 4) and Prdm16ΔRORγt (n = 4) mice at 14 days after adoptive transfer of naïve Hh7–2tg CD4+ T cells. d, Phenotype of Hh-specific T cells in the mLN of mice shown in c. e,f, Representative flow cytometry plots and frequencies of RORγt+ Treg, Th17 and Th2 cells in the SILP and LILP of control (n = 4–6) and Δ+7kb mice (n = 4–6). g,h, Frequencies of RORγt+ Treg, Th2 and Th17 cells in the SILP of control and mutant mice. g, control mice, n = 6; Rorc(t)ΔCD11c mice, n = 4. h, control mice, n = 4; Prdm16ΔRORγt mice, n = 4. i,j, Hematoxylin and eosin staining and inflammation score (i), and average muscularis propria thickness (j) of the distal small intestine sections in 8-week-old and 40-week-old control (n = 4) and Δ+7kb (n = 4) mice. Scale bars, 100 μm. k,l, Small intestine length (k) and serum total IgE levels (l) of 8-week-old and 40-week-old control (n = 4) and Δ+7kb (n = 4) mice. Data are representative of two (a-d,g,h) or three (e,f) independent experiments. Data are means ± s.e.m.; ns, not significant; statistics were calculated by unpaired two-sided t-test.
Extended Data Fig. 8 |
Extended Data Fig. 8 |. Tolerogenic DC are essential for the differentiation of food antigen-specific pTregs.
a-e, Phenotype of OT-Ⅱ pTreg, Th2, Th17, Th1 and Tfh cells in the mLN, SILP and LILP of OVA-fed control and mutant mice at 5 and 12 days post-adoptive transfer of naïve OT-Ⅱ CD4+ T cells. a, mLN: control mice, n = 8; Δ+7kb mice, n = 8. b, mLN: control mice, n = 4; Rorc(t)ΔCD11c mice, n = 4. c, mLN: control mice, n = 4; Prdm16ΔRORγt mice, n = 3. d, SILP: control mice, n = 4; Prdm16ΔRORγt mice, n = 4. e, SILP: control mice, n = 4; Δ+7kb mice, n = 4. f, LILP: control mice, n = 4; Δ+7kb mice, n = 4. Data in a are pooled from two independent experiments. Data in b,d-f are representative of two (b,d) or three (e,f) independent experiments. Data are means ± s.e.m.; ns, not significant; statistics were calculated by unpaired two-sided t-test.
Extended Data Fig. 9 |
Extended Data Fig. 9 |. Tolerogenic DC are required for establishing oral tolerance against allergic airway responses.
a, Magnified images of the lung sections in Fig. 4b. Scale bars, 100 μm. b-h, Eosinophil numbers in the BALF (bronchoalveolar lavage fluid) (b), phenotype of total CD4 T cells (c-f) and OVA:I-Ab tetramer+ CD4 T cells (g,h) in the lung of control and Δ+7kb mice shown in Fig. 4c–f. Flow cytometry plots in g,h were generated by concatenating the samples from each group. i, Phenotype of total Th2 cells in the lung of control and Prdm16ΔRORγt shown in Fig. 4g. j, Phenotype of total Th2 cells in the lung of control and Rorc(t)ΔCD11c shown in Fig. 4h. k, Phenotype of total Th2 cells in the lung of control and MHCIIΔRORγt shown in Fig. 4i. Data in b-h are representative of two independent experiments. Data are means ± s.e.m.; ns, not significant; statistics were calculated by unpaired two-sided t-test.
Extended Data Fig. 10 |
Extended Data Fig. 10 |. Analysis of differentially upregulated genes shared by human and mouse tDC.
a, Dot plot of all 15 cell types from human mLN sc-RNA-seq experiment, demonstrating canonical genes used to annotate each cluster. b, Enumeration of differentially upregulated genes above a threshold of Log2(Fold Change) = 3.2 after integrating all available data, from all tissues, for indicated murine and human APC populations. Overlaps within the Venn diagrams demonstrate conserved genes. c, Volcano plot of all 141 genes differentially upregulated in human tDC, with explicit annotation of the 8 genes shared with mouse tDC, as seen in b.
Fig. 1 |
Fig. 1 |. RORγt is required by tolerogenic APC to promote microbiota-specific pTreg differentiation.
a, Representative flow cytometry plots (top) and frequencies (bottom) of Hh-specific pTreg (FOXP3+RORγt+/−), Th17 (FOXP3RORγt+T-bet+/−) and Th1 (FOXP3RORγtT-bet+) cells in the LILP of Hh-colonized control (Rorc(t)fl/gfp, Rorc(t)wt/gfp, and Cd11ccreRorc(t)wt/gfp; n = 7) and Rorc(t)ΔCD11c (Cd11ccreRorc(t)fl/gfp; n = 5) mice at 14 days after adoptive transfer of naïve Hh7–2tg CD4+ T cells. The upper panels of the flow cytometry plots are gated on total Hh7–2tg cells (CD45+B220TCRγδTCRβ+CD4+Vβ6+CD90.1+), and the lower panels are gated on FOXP3⁻ Hh7–2tg cells. b, Bulk ATAC-seq data showing accessible regions in the Rorc locus of several RORγt-expressing cell types, including DP thymocytes (CD4+CD8+), in vitro differentiated Th17 cells, and SILP-derived Th17 (TCRβ+CD4+IL23R-GFP+) cells, Tγδ17 (TCRγδ+IL23R-GFP+) cells and ILC3 (LinIL-7R+Klrb1b+NK1.1). c, Phenotype of Hh-specific T cells in the LILP of Hh-colonized control (Rorc(t) +7kb+/+; n = 6) and Δ+7kb (Rorc(t) +7kb−/−; n = 4) mice at 14 days after adoptive transfer of naïve Hh7–2tg CD4+ T cells. The flow cytometry plots are gated on total (upper) and FOXP3 (lower) Hh7–2tg cells. Data in a are pooled from two independent experiments. Data in c are representative of two independent experiments. Data are means ± s.e.m.; ns, not significant; statistics were calculated by unpaired two-sided t-test.
Fig. 2 |
Fig. 2 |. RORγt regulates development of Prdm16-expressing tolerogenic DC within mLN.
a, UMAP representation of 21,504 transcriptomes obtained from scRNA-seq of MHCII-expressing innate immune system cells (CD45+Ly6GB220TCRγδTCRβMHCII+ ) in the mLN, combining data from 3-week-old Δ+7kb mutants (n = 7) and controls (n = 7) for joint clustering. Black arrows label two non-ILC3 clusters positive for Rorc. b, Dot plot of indicated clusters from a examining expression of genes previously ascribed to proposed RORγt-APC subsets. c, Stacked bar plots comparing proportion of each cluster in a, as derived from Δ+7kb mutant versus control animals. Dotted line at 51.2% indicates total contribution from Δ+7kb mutants. Red arrow indicates 60% loss within tolerogenic DC cluster of expected Δ+7kb contribution. d, Stacked bar plots analogous to experiment a-c, but now comparing proportion of cell clusters as derived from Rorc(t)ΔCD11c mutants versus controls (n = 4 mice, each condition). Dotted line at 43% indicates total contribution from Rorc(t)ΔCD11c mutants. Red arrow indicates complete loss within tolerogenic DC cluster of expected mutant contribution. e, Chromatin accessibility profiles for Rorc, Prdm16, and Clec9a loci across the indicated cell types. Green shaded range demarcates Rorc(t) +7kb CRE. f, Gating strategy for tolerogenic DC, MHCII+ ILC3 and classical DC (cDC). The bottom left flow cytometry plot is gated on CD45+Ly6GB220TCRγδTCRβ and was generated by concatenating samples from four wild-type mice. g, Expression of the indicated proteins in tolerogenic DC, MHCII+ ILC3 and cDC, as gated in f. h, Numbers of tolerogenic DC and MHCII+ ILC3 in the mLN of 3-week-old and 9-week-old control (n = 4) and Δ+7kb (n = 4) mice. i, Numbers of tolerogenic DC and MHCII+ ILC3 in the mLN of 3-week-old and 8-week-old control (n = 4) and Rorc(t)ΔCD11c (n = 4) mice. Data in f-i are representative of two (h,i) or three (f,g) independent experiments. Data are means ± s.e.m.; ns, not significant; statistics were calculated by unpaired two-sided t-test.
Fig. 3 |
Fig. 3 |. Prdm16-dependent tolerogenic DC promote both microbiota and food antigen-specific pTreg differentiation.
a, Phenotype of Hh-specific T cells in the LILP of Hh-colonized control (Prdm16fl/fl, Prdm16fl/wt; n = 4) and Prdm16ΔRORγt (Rorc(t)crePrdm16fl/fl; n = 4) mice at 14 days after adoptive transfer of naïve Hh7–2tg CD4+ T cells. b, Experimental design for the experiments in c-f. OVA, ovalbumin; mLN, mesenteric lymph nodes; LP, lamina propria. c-f, Representative flow cytometry plots and frequencies of OT-Ⅱ pTreg (FOXP3+RORγt+/−), Th2 (FOXP3GATA3+), Th17 (FOXP3GATA3RORγt+), Th1 (FOXP3GATA3RORγtT-bet+) and Tfh (FOXP3GATA3RORγtT-betBCL6+) cells in the mLN (c) and SILP (d-f) of OVA-treated control and mutant mice at 5 and 12 days post-adoptive transfer of naïve OT-Ⅱ CD4+ T cells. The flow cytometry plots are gated on total OT-Ⅱ cells (CD45+B220TCRγδTCRβ+CD4+Vα2+Vβ5.1/5.2+GFP+). c, mLN: control mice, n = 4; Prdm16ΔRORγt mice, n = 3. d, SILP: control mice, n = 4; Prdm16ΔRORγt mice, n = 4. e, SILP: control mice, n = 4; Δ+7kb mice, n = 4. f, SILP: control (I-ABfl/fl) mice, n = 6; MHCIIΔRORγt (Rorc(t)creI-ABfl/fl) mice, n = 6. Data in f are pooled from two independent experiments. Data in a,d,e are representative of two (a,d) or three (e) independent experiments. Data are means ± s.e.m.; ns, not significant; statistics were calculated by unpaired two-sided t-test.
Fig. 4 |
Fig. 4 |. Tolerogenic DC are required to develop oral tolerance.
a, Experimental design for the airway allergy experiments in b-h. i.g., intragastric; i.p., intraperitoneal; i.n., intranasal. b, Hematoxylin and eosin staining and inflammation score of the lung sections in control and Δ+7kb mice. Scale bars, 500 μm. Non-tolerized control mice, n = 3; tolerized control mice, n = 4; non-tolerized Δ+7kb mice, n = 3; tolerized Δ+7kb mice, n = 3. c-f, Eosinophil (CD45+CD11b+CD11clow/−Siglec-F+) numbers in the lung (c), OVA-specific IgE and IgG1 levels in the serum (d), phenotype of OVA:I-Ab tetramer+ CD4 T cells (e,f) in the lung of control and Δ+7kb mice. Flow cytometry plots in e were generated by concatenating the samples from each group. Non-tolerized control mice, n = 4; tolerized control mice, n = 5; non-tolerized Δ+7kb mice, n = 4; tolerized Δ+7kb mice, n = 5. g, Eosinophil numbers in the lung of control and Prdm16ΔRORγt mice. n = 4. h, Eosinophil numbers in the lung of control and Rorc(t)ΔCD11c mice. n = 4–5. i, Eosinophil numbers in the lung of control and MHCIIΔRORγt mice. n = 4–5. j, Experimental design for the food allergy experiments in k,l. CT, cholera toxin. k,l, Changes in rectal temperature (k) and OVA-specific IgE and IgG1 levels in the serum (l) of control and Δ+7kb mice. n = 8. Data in k,l are pooled from two independent experiments. Data in b-f are representative of two independent experiments. Data are means ± s.e.m.; ns, not significant; statistics were calculated by unpaired two-sided t-test (b-d,f-i,l) and two-stage step-up method of Benjamini, Krieger, and Yekutieli (k).
Fig. 5 |
Fig. 5 |. PRDM16-expressing tolerogenic DC are conserved in humans.
a, Input scheme for human sc-RNA-seq, with four mLN resected and enriched for APCs. b, UMAP of 12,928 resultant human mLN transcriptomes. c, Dot plot of indicated clusters from b examining expression of genes previously ascribed to RORγt-APC subsets. d, UMAP derived from public datasets of human lamina propria (ileum and colon) resected from 6 donors, enriched for APCs. e, UMAP derived from public datasets of human tonsil from 9 donors, enriched for APCs. Black arrows in b,d,e highlight populations of tolerogenic DC. f, Chromatin accessibility profiles for RORC, PRDM16, and CLEC9A loci across the indicated cell types. Green shaded range demarcates human ortholog of murine Rorc(t) +7kb CRE, part of conserved non-coding sequence 9 (CNS9).

Similar articles

References

    1. Bilate A. M. & Lafaille J. J. Induced CD4+Foxp3+ regulatory T cells in immune tolerance. Annu. Rev. Immunol. 30, 733–758 (2012). - PubMed
    1. Josefowicz S. Z., Lu L.-F. & Rudensky A. Y. Regulatory T cells: mechanisms of differentiation and function. Annu. Rev. Immunol. 30, 531–564 (2012). - PMC - PubMed
    1. Whibley N., Tucci A. & Powrie F. Regulatory T cell adaptation in the intestine and skin. Nat. Immunol. 20, 386–396 (2019). - PubMed
    1. Ramanan D. et al. Regulatory T cells in the face of the intestinal microbiota. Nat. Rev. Immunol. 23, 749–762 (2023). - PubMed
    1. Kedmi R. et al. A RORγt+ cell instructs gut microbiota-specific Treg cell differentiation. Nature 610, 737–743 (2022). - PMC - PubMed

Publication types

LinkOut - more resources