[Preprint]. 2024 Jul 25:2024.07.25.605139.
doi: 10.1101/2024.07.25.605139.

The axillary lymphoid organ - an external, experimentally accessible immune organ in the zebrafish

Affiliations

The axillary lymphoid organ - an external, experimentally accessible immune organ in the zebrafish

Daniel Castranova et al. bioRxiv. .

Update in

Abstract

Lymph nodes and other secondary lymphoid organs play critical roles in immune surveillance and immune activation in mammals, but the deep internal locations of these organs make it challenging to image and study them in living animals. Here, we describe a previously uncharacterized external immune organ in the zebrafish ideally suited for studying immune cell dynamics in vivo, the axillary lymphoid organ (ALO). This small, translucent organ has an outer cortex teeming with immune cells, an inner medulla with a mesh-like network of fibroblastic reticular cells along which immune cells migrate, and a network of lymphatic vessels draining to a large adjacent lymph sac. Noninvasive high-resolution imaging of transgenically marked immune cells can be carried out in the lobes of living animals, and the ALO is readily accessible to external treatment. This newly discovered tissue provides a superb model for dynamic live imaging of immune cells and their interaction with pathogens and surrounding tissues, including blood and lymphatic vessels.


Conflict of interest statement

Competing interests: Authors declare that they have no competing interests.

Figures
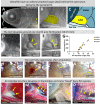
Fig. 1.
Fig. 1.. Axillary lymphoid organ (ALO) in the zebrafish.
A. Maximum intensity projection confocal micrograph of the red fluorescent surface of a 32 day old zebrafish soaked in BODIPY 633. B. Magnified image of the boxed area in panel A, with the ALO pseudocolored yellow. C. Schematic diagram of the anatomical features shown in panel B. D-F. Maximum intensity projection confocal micrographs of 9.3 mm (28 dpf) (D), 11.1 mm (34 dpf) (E), and 14.8 mm (34 dpf) (F) juvenile zebrafish soaked in BODIPY 633, showing stages prior to ALO emergence, initial ALO budding, and further ALO expansion, respectively. G. Measurement of ALO length (μm) vs. fish standard length (mm). ALO’s emerge when fish reach approximately 9–10 mm in body length. H-K. Brightfield images of adult zebrafish ALO pre-amputation (H), immediately post-amputation (I), 3 days post-amputation (J), and 14 days post-amputation (K), with yellow dashed lines and arrows marking the border of the ALO. L-O Images of ALOs found on other fish species, with yellow arrows noting the locations of the ALOs. Scale bars = 500 μm (A,H), 250 μm (B), 200 μm (D,E,F), 1 mm (L,M), and 2mm (N,O)
Fig 2.
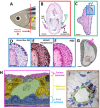
Fig 2.. Histology and electron microscopy of the axillary lymphoid organ (ALO).
Histological characterization of ALO morphology. A. Schematic diagram showing the plane of section in panel (B). B. Alcian Blue PAS-stained transverse paraffin section through the anterior trunk of an adult zebrafish. The green box indicates the region shown in panel C. C. Magnified image of the boxed region in panel B, showing the right ALO. The blue box indicates the region shown in panel D. D-F. Magnified images of serial transverse paraffin sections through the anterior trunk of an adult zebrafish stained with Alcian Blue PAS (D), Movat Pentachrome (E), and H&E (F). Panel D shows the boxed region in panel C. G. Transmission electron micrograph (TEM) of a transverse section through an adult zebrafish ALO. The boxed regions show areas with comparable (H) or actual (I) magnified TEM images in subsequent panels. H. Pseudocolored TEM showing the dermal cortex of the ALO with presumptive surface epithelial cells magenta, mid-level epithelial cells yellow, club cell green, and basal epithelial cells blue. I. Magnified TEM image of box I in panel G, showing the medulla of the ALO with lymphatic vessel pseudocolored green, blood vessels magenta, and fibroblastic reticular cells (FRCs) blue (I). Scale bars = 1 mm (B), 50 μm (C), 25 μm (D), 100 um (G), 10 μm (H,I).
Fig 3.
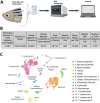
Fig 3.. Single-cell RNA-seq of the ALO.
A. Schematic diagram showing the workflow for ALO single cell RNA sequencing. B. Metrics for the ALO scRNA-seq procedure. C. Uniform Manifold Approximation and Projection (UMAP) plot of data from the ALO scRNA-seq procedure, with 14 clusters annotated by cell identity.
Fig 4.
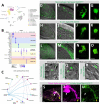
Fig 4.. Resident cell types of the ALO dermal cortex.
A. UMAP plot of ALO scRNA-seq data highlighting seven clusters that include resident cell types of the ALO cortex. B. Schematic diagram of the ALO cortex (comparable to the area marked by the red box in the ALO confocal image at upper left), with the cell types represented by each of the highlighted clusters in panel (A) shown using the same colors. C,E,G,I,K,M,O,Q. Confocal micrographs of the cortex of l hybridization chain reaction (HCR) stained (C,E,G,I,M) or transgene-expressing (K,O,Q) ALOs isolated from adult zebrafish. D,F,H,J,L,N,P,R. Pseudocolored 2D sections from an array tomography stack of the ALO cortex with the same cell types shown in the adjacent confocal image panels highlighted in pink. The confocal images and electron micrographs show surface epithelial cells (C,D), mid-level epithelial cells (E,F), basal epithelial cells (G, H), goblet cells (I, J), Merkel cells (K, L), chemosensory type 1 cells (M, N), chemosensory type 2 cells (O, P), and club cells (Q, R). Scale bars = 10 μm (C, E, G, I, K, M, O, Q) or 5 μm (D, F, H, J, L, N, P, R).
Fig. 5.
Fig. 5.. The ALO contains a network of blood and lymphatic vessels.
A-D. Confocal micrographs of an adult Tg(mrc1a:egfp)y251, Tg(kdrl:mcherry)y205 double transgenic zebrafish with mrc1a-positive lymphatics in green and kdrl-positive blood vessels in magenta. This animal was also injected intravascularly with Hoechst 33342 dye, marking blood cell nuclei with blue fluorescence. Images include (A), an overview image of the head, with the position of the ALO noted, (B), higher magnification image of the area in panel A noted by an arrow, showing a network of blood (magenta) and lymphatic (green) vessels in the ALO, with blood circulation (blue) in blood vessels, (C,D), higher magnification images of the area noted by an arrow in panel B, showing that blood vessels (magenta) but not lymphatics (green) contain circulating RBCs (blue). E. Schematic diagram of procedure for intralobular injection of quantum dots. F,G. Confocal micrographs of an adult Tg(mrc1a:egfp)y251 zebrafish ALO after intra-organ injection of 705 nm quantum dots (Qdots), with mrc1a-positive lymphatics in green and Qdots in magenta. Panel F shows an overview of the ALO vicinity, noting the higher-magnification area shown in panel G. The injected Qdots drain via lymphatics into an adjacent deeper large lymph sac, noted with an arrow in panel G. H-J. Transmission electron micrographs of ALO vessels, showing overview of adjacent vessels (H) and higher magnification images of vessel cell-cell junctions (I,J). Scale bars = 1 mm (A), 500 μm (F), 100 μm (G), 50 μm (B), 25 μm (D).
Fig. 6.
Fig. 6.. The ALO medulla is made up of fibroblastic reticular cells.
A. UMAP plot of ALO scRNA-seq data highlighting the medullary fibroblastic reticular cell (FRC) cluster. B. Dot plot showing the relative gene expression of genes used to identify and characterize the FRC cluster. C-E. Confocal (C,D) and DIC (E) micrographs of an ALO excised from an adult Tg(pdgfrb:EGFP)ncv22 transgenic zebrafish with green fluorescent FRCs. Panel C shows an ALO overview image, panels D and E show higher magnification images of the yellow boxed area in panel C. F-G. Confocal micrographs of the ALO of an adult zebrafish subjected to hybridization chain reaction (HCR) for spock3 (magenta), with DAPI counterstain shown in white. Panel G shows a higher magnification image of the boxed area in panel F. H. Successive images from a timelapse DIC videomicrograph of an immune cell (pseudocolored magenta) migrating along the FRC network. Images are selected frames from Supplemental Movie 6. I-K. Transmission electron micrographs of the ALO medulla. Panels J and K show immune cells (pseudocolored magenta) in close apposition to FRCs (pseudocolored blue). Panel K shows FRC cell bodies adjacent to and embedded in the matrix surrounding a lymphatic vessel. Scale bars = 100 μm (C), 50 μm (F), 20 μm (D, G), 10 μm (H), 5 μm (I, J, K).
Fig. 7.
Fig. 7.. The ALO is an immune cell hub.
A. UMAP plot of ALO scRNA-seq data highlighting blood and immune cell clusters. B. Dot plot showing the relative expression of genes used to identify and characterize blood and immune cell clusters. C. CellChat plot of likely chemokine signaling in the ALO based on expression of chemokine ligands and receptors in different ALO scRNAseq clusters. Basal epithelial and fibroblastic reticular cells both appear to be hubs for chemokine signaling to immune cells. D-O. Confocal + DIC (D,E,H,I,L,M) or confocal only (F,G,J,K,N,O) micrographs of ALOs from adult immune cell transgenic reporter zebrafish. Images include ALO overviews (D,H,L), side views of the dermal cortex and medulla (E,I,M), and higher magnification images of individual cells (F,G,J,K,N,O). Images show Tg(mpeg1:EGFP)gl22 positive macrophages (D-G), Tg(cd79b:EGFP)fcc89 positive B-cells (H-K), and Tg(lck:EGFP)cz2 positive T-cells (L-O). P-R. Single-plane confocal + DIC images of Tg(mpeg1:EGFP)gl22 positive macrophages (P), Tg(cd79b:EGFP)fcc89 positive B cells (Q), and Tg(lck:EGFP)cz2 T-cells (R) migrating on fibroblastic reticular cells in adult ALO medullae (see Supp. Movies 6–9). P-R. Confocal micrographs of a 5 week-old Tg(cd79b:EGFP)fcc89, Tg(lck:mcherry)nz107 double transgenic zebrafish with T-cells in magenta and B-cells in green, showing large numbers of cells migrating between the thymus (white arrow) and the ALO (yellow arrow). Images show an overview of the head (S) and higher magnification images of T cells (T) connecting the thymus and ALO and B cells (U) starting above the thymus and moving down to the ALO (see Supp. Fig. 10 for whole-fish overview images). Scale Bars = 50 μm (D, H, L), 20 μm (E, I, M), 5μm (F, G, J, K, N, O), 10 μm (P, Q, R), and 500 μm (S, T, U).
Fig. 8.
Fig. 8.. The ALO is heavily infiltrated with leukemic T-cells in a zebrafish model of T-ALL. A-F.
Fluorescence images of Tg(lck:EGFP)cz2 wild type sibling (A,C,D) or T-ALL HLKdz102 mutant (B,E,F) adult animals. Panels show overview images of the ALO/pectoral area taken with a fluorescent stereomicroscope (A,B), confocal images of most of the ALO (C,E), and higher magnification confocal images of the ALO cortex and underlying medulla (D,F). The images in panels D and F correspond to the boxed regions in panels C and E, respectively. The image in panel A was taken with 4X higher exposure and 3X higher gain than the image in panel B, because this area was much brighter in the T-ALL fish than in the WT fish. G-J. H&E stained paraffin histological sections of ALOs from adult wild type (G,H) or T-ALL HLKdz102 mutant (I,J) adult animals. The images in panels H and J correspond to the boxed regions in panels G and I, respectively. The T-ALL HLKdz102 ALO is almost entirely filled with leukemic T cells. Scale bars = 1 mm (A, B), 100 μm (C, E), 25 μm (D,F,G,I).

References

    1. Neely H. R., Flajnik M. F., Emergence and Evolution of Secondary Lymphoid Organs. Annu Rev Cell Dev Biol 32, 693–711 (2016). - PMC - PubMed
    1. Victora G. D., Nussenzweig M. C., Germinal Centers. Annu Rev Immunol 40, 413–442 (2022). - PubMed
    1. Willard-Mack C. L., Normal structure, function, and histology of lymph nodes. Toxicol Pathol 34, 409–424 (2006). - PubMed
    1. Li L., Wu J., Abdi R., Jewell C. M., Bromberg J. S., Lymph node fibroblastic reticular cells steer immune responses. Trends Immunol 42, 723–734 (2021). - PMC - PubMed
    1. Siegert S., Luther S. A., Positive and negative regulation of T cell responses by fibroblastic reticular cells within paracortical regions of lymph nodes. Front Immunol 3, 285 (2012). - PMC - PubMed

Publication types