[Preprint]. 2025 Aug 28:2024.07.24.604987.
doi: 10.1101/2024.07.24.604987.

DNA O-MAP uncovers the molecular neighborhoods associated with specific genomic loci

Affiliations

DNA O-MAP uncovers the molecular neighborhoods associated with specific genomic loci

Yuzhen Liu et al. bioRxiv. .

Abstract

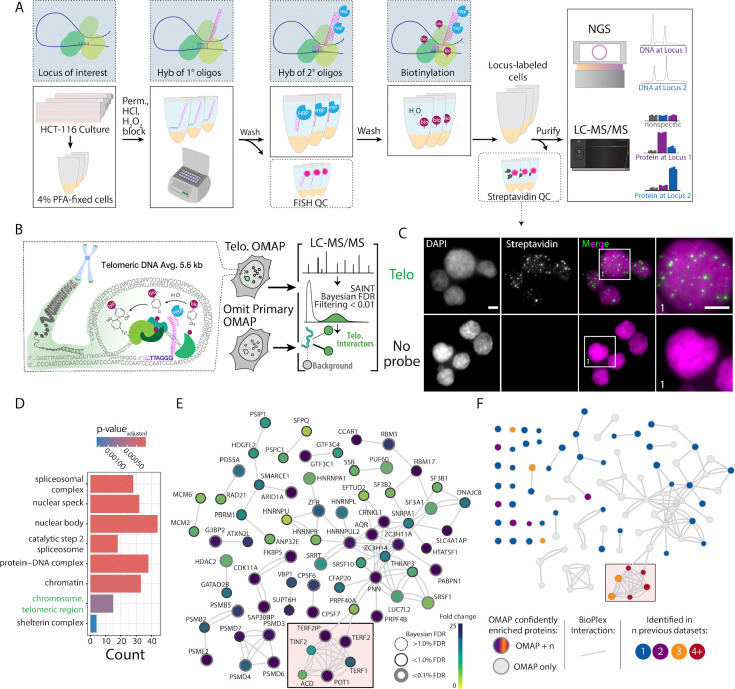
The accuracy of crucial nuclear processes such as transcription, replication, and repair, depends on the local composition of chromatin and the regulatory proteins that reside there. Understanding these DNA-protein interactions at the level of specific genomic loci has remained challenging due to technical limitations. Here, we introduce a method termed "DNA O-MAP", which uses programmable peroxidase-conjugated oligonucleotide probes to biotinylate nearby proteins. We show that DNA O-MAP can be coupled with sample multiplexed quantitative proteomics, targeted chemical perturbations, and next-generation sequencing to quantify DNA-protein and DNA-DNA interactions at specific genomic loci. Furthermore, we establish that DNA O-MAP \ is applicable to both repetitive and unique genomic loci of varying sizes (kilobases to megabases), and that DNA O-MAP can measure proximal molecular effectors in a homolog-specific manner.


Conflict of interest statement

Competing Interest Statement D.K.S. is a collaborator with Thermo Fisher Scientific, Genentech, Calico Labs, and AI Proteins. C.K.C., A.F.T., E.K., D.M.S., and B.J.B. have filed a patent application covering aspects of this work. B.J.B. is listed as an inventor on patent applications related to the SABER technology related to this work.

Figures

Figure 1.
Figure 1.. Overview of DNA O-MAP workflow and label-free quantitative proteomics analysis of telomeres.
A) Schematic of DNA O-MAP. B) Overview of telomere targeted DNA O-MAP experiment. C) Fluorescent microscopy data showing the observed patterns of DNA (DAPI, left) and in situ biotinylation detected by staining with fluorescent streptavidin conjugates (middle, left). D) Significant gene sets identified by the Gene Set Enrichment Analysis of the proteins enriched by the telomere probe. E) DNA O-MAP telomeric proteins mapped onto the BioPlex interaction network,. The red box highlights shelterin complex proteins. Nodes are colored by the fold-enrichment compared to a no-primary-probe control shown in C, excluding unconnected nodes. F) Telomeric proteins observed in five previous datasets (PICh, C-BERST, CAPLOCUS, CAPTURE, BioID) superimposed onto Figure 1E, colored by the number of prior datasets where the protein was present and including unconnected nodes. Scale bars, 5 μm.
Figure 2.
Figure 2.. DNA O-MAP reveals distinct features of the sub-proteomes at peri-centromeric alpha satellites, telomeres, and the mitochondrial genome.
A) Workflow of DNA O-MAP integrated with sample multiplexing quantitative proteomics B) Schematic of the three DNA loci examined in the TMT16plex experiment: peri-centromeric alpha satellites, telomeres, and mitochondrial genomes. C) Co-localization of DNA FISH and the streptavidin staining of the proteins biotinylated by DNA O-MAP targeting the peri-centromeric alpha satellites, telomeres, and mitochondrial genomes. Scale bar: 5 μm. D) Principal component analysis of scaled intensities of proteins enriched by the pan-alpha probe, telomere probe, mitochondrial genome oligo pool, and no-primary-probe control. E) Unsupervised hierarchical clustering of scaled intensities of proteins enriched by the pan-alpha probe, telomere probe, mitochondrial genome oligo pool, and no-primary-probe control. F) Log2 fold change of proteins compared to no-primary-probe control, grouped by HPA subcellular location. Significance calculated based on Welch’s t-test for pairwise comparisons (****: p-value <0.0001). G–J) Log2 fold change of proteins compared to mitochondrial probe enriched proteins for the RNA Polymerases (G), mtDNA nucleoid packaging proteins (H), Shelterin (I), and CENP-A nucleosomal complexes (J). Significance calculated based on Welch’s t-test for pairwise comparisons (p-value: *<0.05, **<0.01, ***<0.001, ****<0.0001).
Figure 3.
Figure 3.. DNA O-MAP efficiently labels single-copy chromatin loop anchors.
A) Workflow of DNA O-MAP integrated with biotin purification sequencing B) Schematic of a pair of chromatin loop anchors on a hypothetical Hi-C map and 3-dimensional space C) DNA FISH and the streptavidin staining of the proteins biotinylated by DNA O-MAP targeting anchors of chromatin loops on chromosome 3 and chromosome 19 D) Table listing the three anchors (Track 1–3) and no-primary-probe control (Track 4) biotinylated by DNA O-MAP and their expected anchors in contact in each track (top). Desthiobiotin purification sequencing signals across the 9-Mb region on chromosome 3 corresponding to the chr3 chromatin loop (middle). Desthiobiotin purification sequencing signals and pairwise contact map at 5-kb resolution across the 2.5-Mb region on chromosome 3 corresponding to the chr3 chromatin loop. Black circle on the contact map indicates the presence of a loop. (bottom). E) Table listing the three chromatin loop anchors (Track 1–2) and no-primary-probe controls (Track 3–4) biotinylated by DNA O-MAP in duplicates and their expected anchors in contact in each track (top). Desthiobiotin purification sequencing signals across the 8-Mb region on chromosome 10 corresponding to the chr10 chromatin loop targeted (middle). Desthiobiotin purification sequencing signals and pairwise contact map at 5-kb resolution across the 1-Mb region on chromosome 10 corresponding to the chr10 chromatin loop. Black circle on the contact map indicates the presence of a loop. (bottom). F) Desthiobiotin purification sequencing signals across the 7-Mb region on chromosome 19 corresponding to the chr19 chromatin loops targeted (top). Desthiobiotin purification sequencing signals and pairwise contact map at 5-kb resolution across the 1-Mb region on chromosome 19 corresponding to the chr19 chromatin loops. Black circles on the contact map indicate the presence of loops (bottom).
Figure 4.
Figure 4.. DNA O-MAP efficiently identifies the local proteome of the Hox A & B gene clusters.
A) Schematic of DNA O-MAP being applied to the Hox A and Hox B gene clusters for identification of differentially enriched proteins. B) Representative images depicting overlap of FISH and Streptavidin labeling at Hox A and Hox B loci. C) Volcano plot of proteins identified at Hox A and Hox B loci. Each dot represents a single protein with proteins of interest called out in black. Green dots indicate proteins that passed significant enrichment thresholds of greater than 2-fold change and corrected p-value < 0.05. D) ENCODE ChIP-seq data in K562 cells at Hox A and Hox B gene cluster loci for HDAC3. E) Schematic depicting the use of GSK126 with DNA O-MAP. F) Bar chart showing proteins with significantly altered abundance following treatment with GSK126 at Hox A. G. Bar chart showing proteins with significantly altered abundance at HoxA and HoxB following treatment with GSK126. Corrected p-value < 0.05.
Figure 5.
Figure 5.. DNA O-MAP elucidates the homolog-resolved chromosome X proteome.
A) Schematic of DNA O-MAP being applied to Xi and Xa for identification of differentially enriched proteins. B) Schematic showing the region of the X chromosome targeted by our primary hybridization probes. C) Representative images depicting overlap of Xist FISH and Xi Streptavidin labeling while spatially differentiated from Xa. Scale bar is 10 uM. D) Volcano plot of proteins identified at Xa and Xi. Each dot represents a single protein with proteins of interest called out in black. Green dots indicate proteins that passed significant enrichment thresholds of greater than 2-fold change and corrected p-value < 0.05. E) Bar chart showing example proteins with significant enrichment at Xi. Corrected p-value < 0.1. F) ENCODE ChIP-seq data in mouse fibroblast cells at chromosome X for SMC3. G) Protein interaction network of selected proteins enriched at Xi. Node width is a function of corrected p-value, and node color is a function of enrichment (Log2 Fold Change).

References

    1. Bickmore W. A. & van Steensel B. Genome architecture: domain organization of interphase chromosomes. Cell 152, 1270–1284 (2013). - PubMed
    1. Jerkovic I. & Cavalli G. Understanding 3D genome organization by multidisciplinary methods. Nat. Rev. Mol. Cell Biol. 22, 511–528 (2021). - PubMed
    1. Johnson D. S., Mortazavi A., Myers R. M. & Wold B. Genome-wide mapping of in vivo protein-DNA interactions. Science 316, 1497–1502 (2007). - PubMed
    1. Ho J. W. K., Alekseyenko A. A., Kuroda M. I. & Park P. J. Genome-wide mapping of protein-DNA interactions by ChIP-seq. in Tag-Based Next Generation Sequencing 139–151 (Wiley-VCH Verlag GmbH & Co. KGaA, Weinheim, Germany, 2012).
    1. van Steensel B. & Henikoff S. Identification of in vivo DNA targets of chromatin proteins using tethered dam methyltransferase. Nat. Biotechnol. 18, 424–428 (2000). - PubMed

Publication types

LinkOut - more resources