[Preprint]. 2024 Jul 25:2024.07.25.605203.
doi: 10.1101/2024.07.25.605203.

The evolutionary fate of Neanderthal DNA in 30,780 admixed genomes with recent African-like ancestry

Affiliations

The evolutionary fate of Neanderthal DNA in 30,780 admixed genomes with recent African-like ancestry

Aaron Pfennig et al. bioRxiv. .

Abstract

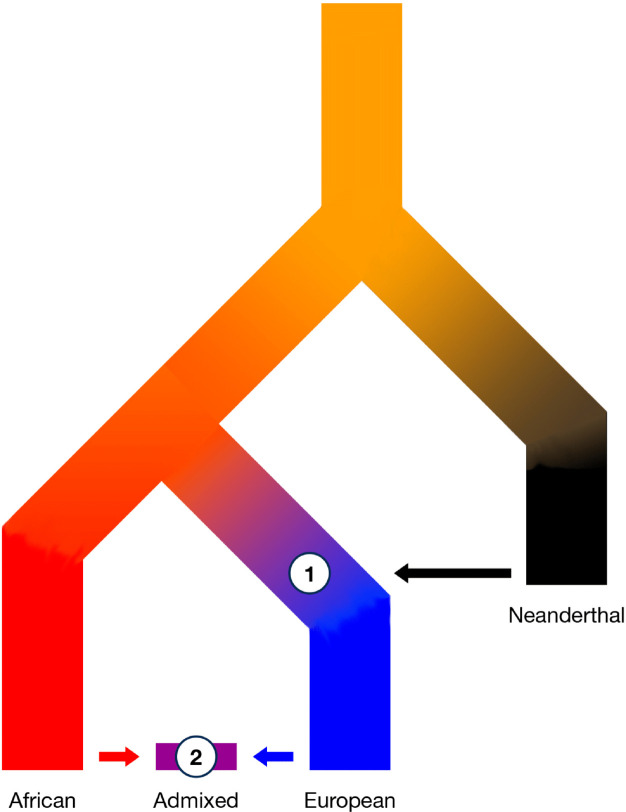
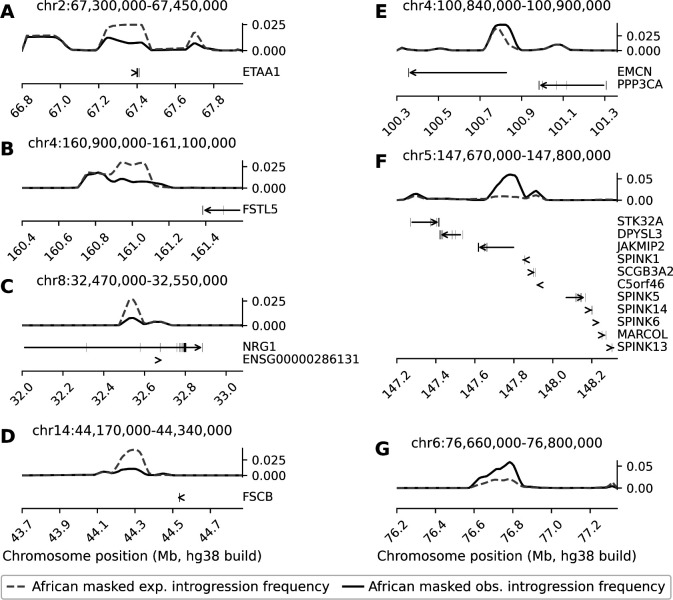
Following introgression, Neanderthal DNA was initially purged from non-African genomes, but the evolutionary fate of remaining introgressed DNA has not been explored yet. To fill this gap, we analyzed 30,780 admixed genomes with African-like ancestry from the All of Us research program, in which Neanderthal alleles encountered novel genetic backgrounds during the last 15 generations. Observed amounts of Neanderthal DNA approximately match expectations based on ancestry proportions, suggesting neutral evolution. Nevertheless, we identified genomic regions that have significantly less or more Neanderthal ancestry than expected and are associated with spermatogenesis, innate immunity, and other biological processes. We also identified three novel introgression desert-like regions in recently admixed genomes, whose genetic features are compatible with hybrid incompatibilities and intrinsic negative selection. Overall, we find that much of the remaining Neanderthal DNA in human genomes is not under strong selection, and complex evolutionary dynamics have shaped introgression landscapes in our species.

Keywords: Admixture; Hybrid incompatibilities; Introgression; Natural Selection; Neanderthal.


Conflict of interest statement

7Declaration of interests The authors declare no competing interests.

Figures

Fig. 1
Fig. 1
Secondary contact has brought Neanderthal DNA into novel genomic contexts. (1) Neanderthal DNA introgressed into non-African populations ~50 kya, leading to an initial purging of Neanderthal ancestry. (2) During the past 15 generations, recent admixture of individuals with African-like ancestry and European-like ancestry has introduced Neanderthal variants into a novel genetic background, potentially leading to secondary selection.
Fig. 2
Fig. 2
Amounts of Neanderthal ancestry in global populations and correlations with recent ancestry proportions in 30,780 admixed individuals from All of Us. A) Inferred amounts of Neanderthal ancestry in Mb per individual for different continental reference subpopulations, using IBDmix. East Asian/Native American populations (green) show the highest amounts of Neanderthal ancestry, immediately followed by European populations (blue). African populations (red) have the lowest amounts of inferred Neanderthal ancestry. Admixed genomes (purple; AOU-Admixed) contain intermediate amounts of Neanderthal ancestry. The whiskers indicate 1.5 times the inter-quartile range. See also Figure S2 for amounts of introgressed sequence per individual after applying the African mask B) The amount of Neanderthal ancestry in admixed genomes is negatively correlated with the African-like (AFR-like) ancestry proportion and C) positively correlated with the European-like (EUR-like) ancestry proportion. D) Due to our inclusion criteria, there is only a weak correlation between the amount of Neanderthal ancestry and the amount of East Asian/Native American-like (EAS/NA-like) ancestry in the admixed genomes. The p-value (p) and Pearson’s correlation coefficient (r) for separate linear regressions are given in the respective panels. See also Figure S3.
Fig. 3
Fig. 3
Observed amounts of Neanderthal ancestry per individual are largely compatible with neutral evolution in 30,780 admixed genomes from All of Us after correcting for incomplete lineage sorting and false positives by removing segments that overlapped with putative Neanderthal segments in African reference genomes. A) Slightly more Neanderthal ancestry is observed than expected, but the slope of the regression line is close to one (m=1.05, 95%CI: 1.04 – 1.05), and the y-intercept is close to zero (b=0.22, 95% CI:0.19 – 0.24). The p-value (p) and Pearson’s correlation coefficient (r) of the regression line are given in the panel. B) Differences in expected and observed Neanderthal admixture fractions are centered near zero for empirical data (purple) and data from neutral coalescence simulations (gray). The mean difference in the Neanderthal admixture fraction in the empirical data is 0.34 Mb (0.012% of the entire genome). See also Figures S4, S5, S6, and S7.
Fig. 4
Fig. 4
Spectra of expected vs. observed Neanderthal introgression frequencies in 50 kb windows after applying the African mask for empirical and simulated data. That is, we removed any Neanderthal segment that overlapped with a predicted segment in African reference genomes. A) and B) show expected vs observed introgression frequencies in the 30,780 admixed individuals from All of Us and aggregated simulated data, respectively. C) shows the positive residuals when panel B is subtracted from panel A. Two regions in the spectrum were identified in which the empirical data had significantly more windows with significantly less (lower ellipse) and more (upper ellipse) Neanderthal ancestry than expected. Only windows with an expected introgression frequency greater than zero, less than 50% masked sites, intermediate recombination rate (i.e., ≥0.65 cm/Mb and ≤1.52 cM/Mb), and that have at least 50% African-like, at least 10% European-like, and less than 5% East Asian/Native American-like ancestry were included in these analyses. Densities and residuals were normalized to a range between 0 and 1. See also Figures S8 and S9.
Fig. 5
Fig. 5
Expected and observed Neanderthal introgression frequencies as well as the localization of protein-coding genes within 500 kb in regions with significantly less (A-D) and more (E-G) Neanderthal ancestry than expected. Expected and observed introgression frequencies were calculated based on the African masked call set. Positions of the genomic regions with significantly less or more Neanderthal DNA than expected are shown in each panel. Gene locations were taken from GENCODE v46 (Frankish et al., 2023), and genomic positions are in hg38. See also Table S1.
Fig. 6
Fig. 6
The localization and evolutionary genetics of novel introgression desert-like regions and previously known deserts. A) The genome-wide distribution of African masked Neanderthal haplotypes (purple) and the localization of novel desert-like regions (red) and previously known introgression deserts (orange) (Vernot et al., 2016; Chen et al., 2020). Genomic positions are in hg38. B) Novel introgression desert-like regions are subject to stronger background selection (lower B-statistic) than the genome-wide background and previously known deserts (Mann-Whitney U p ≤ 10−6 and p ≤ 10−6). Previously known deserts are also subject to stronger background selection than the genome-wide background (Mann-Whitney U p ≤ 10−6). C) Neanderthal-derived alleles in novel introgression desert-like regions and previously known introgression are younger than expected by chance (Mann-Whitney U p = 6.47×10⁻⁴ and p = 8.15×10⁻⁶). D) Genes overlapping the novel desert-like regions and previously known deserts interact with slightly more proteins than random genes (p = 2.05×10⁻³ and p = 1.37×10⁻³) when considering medium confidence protein-protein interactions in STRING (i.e., score > 400). E) The shifts for genes with more interactions disappear when only considering high-confidence interaction in STRING (score > 700; p = 0.28 and p = 0.42). F) Novel introgression desert-like regions and previously known deserts show a small shift towards greater phastCons scores compared to the genome-wide background (Mann-Whitney U p ≤ 10−6 and p ≤ 10−6). See also Tables S2 and S3.

References

    1. Agresti A, Coull BA (1998) Approximate is Better than “Exact” for Interval Estimation of Binomial Proportions. The American Statistician 52(2):119–126. 10.1080/00031305.1998.10480550 - DOI
    1. Aqil A, Speidel L, Pavlidis P, et al. (2023) Balancing selection on genomic deletion polymorphisms in humans. eLife 12:e79111. 10.7554/eLife.79111 - DOI - PMC - PubMed
    1. Auton A, Abecasis GR, Altshuler DM, et al. (2015) A global reference for human genetic variation. Nature 526(7571):68–74. 10.1038/nature15393 - DOI - PMC - PubMed
    1. Bass TE, Luzwick JW, Kavanaugh G, et al. (2016) ETAA1 acts at stalled replication forks to maintain genome integrity. Nature Cell Biology 18(11):1185–1195. 10.1038/ncb3415 - DOI - PMC - PubMed
    1. Baumdicker F, Bisschop G, Goldstein D, et al. (2021) Efficient ancestry and mutation simulation with msprime 1.0. Genetics 220(3). 10.1093/genetics/iyab229 - DOI - PMC - PubMed

Publication types

LinkOut - more resources