[Preprint]. 2024 Jul 22:2024.07.18.603996.
doi: 10.1101/2024.07.18.603996.

γ-aminobutyric acid receptor B signaling drives glioblastoma in females in an immune-dependent manner

Affiliations

γ-aminobutyric acid receptor B signaling drives glioblastoma in females in an immune-dependent manner

Asmita Pathak et al. bioRxiv. .

Abstract

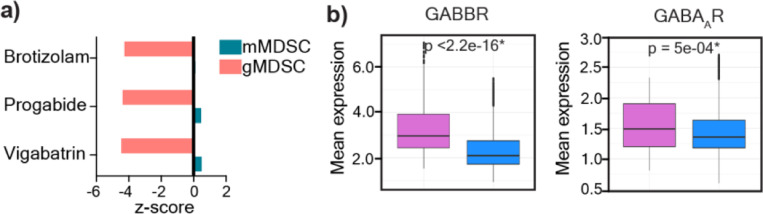
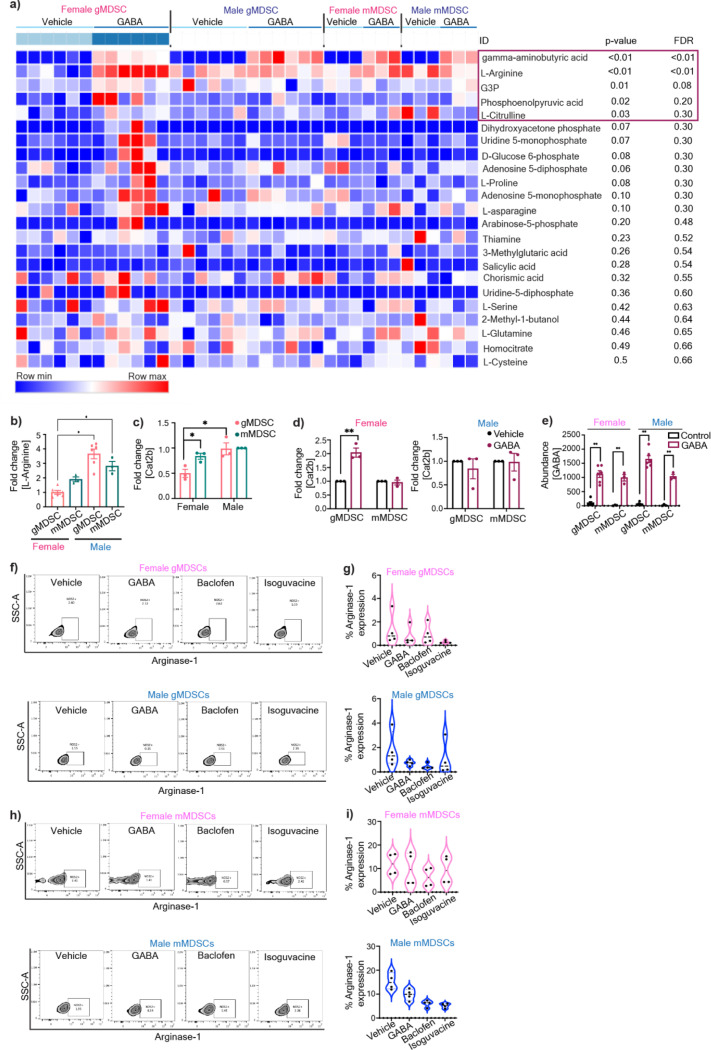
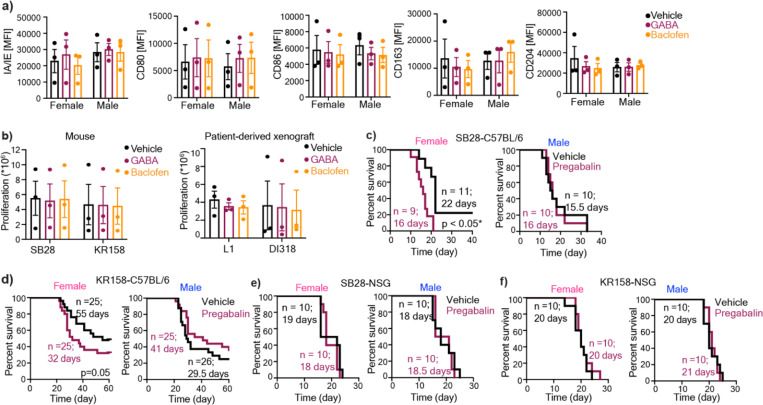
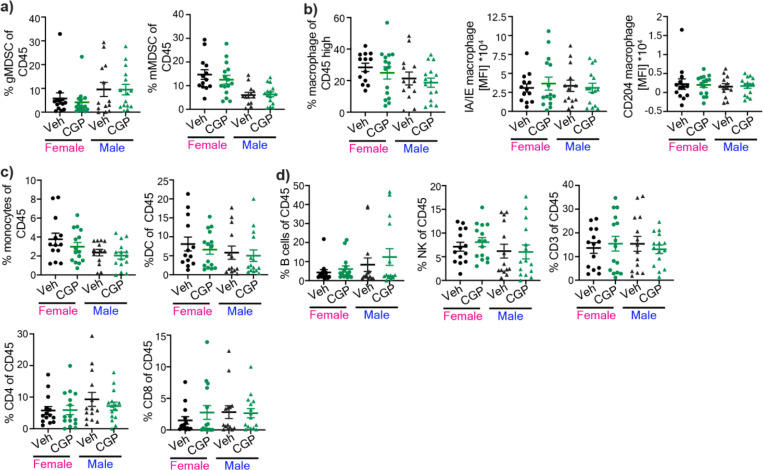
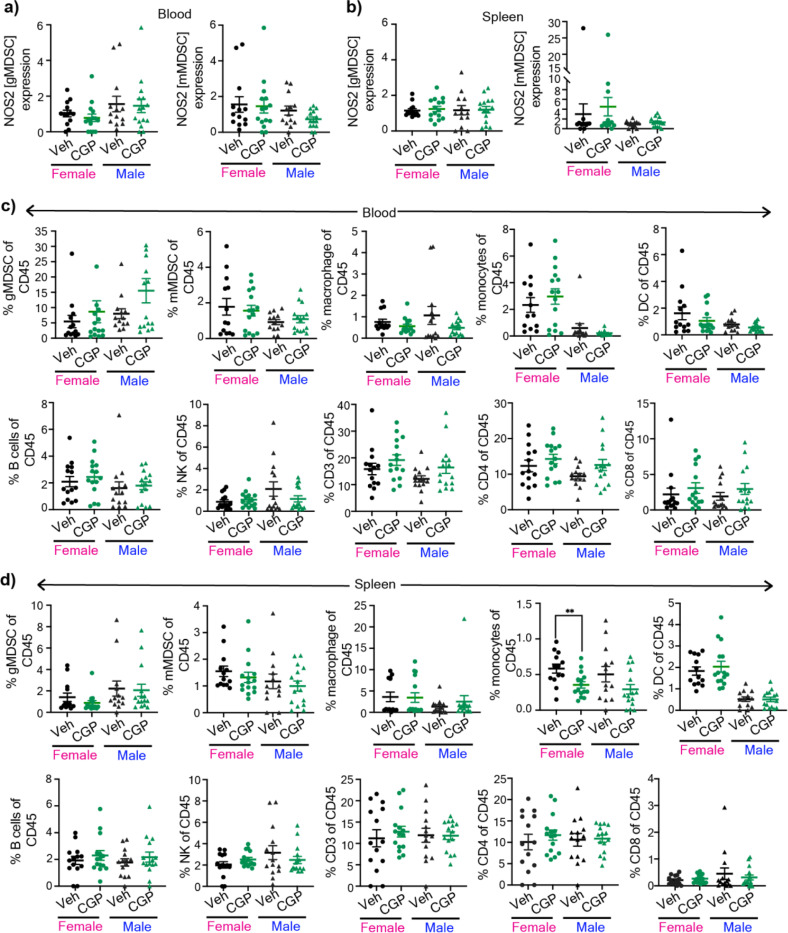
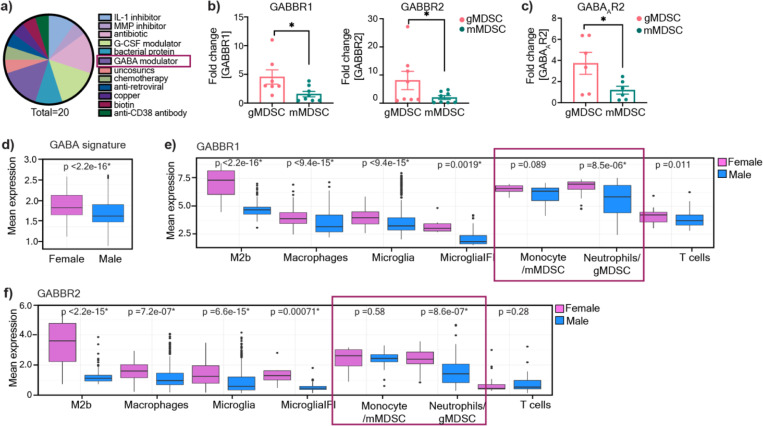
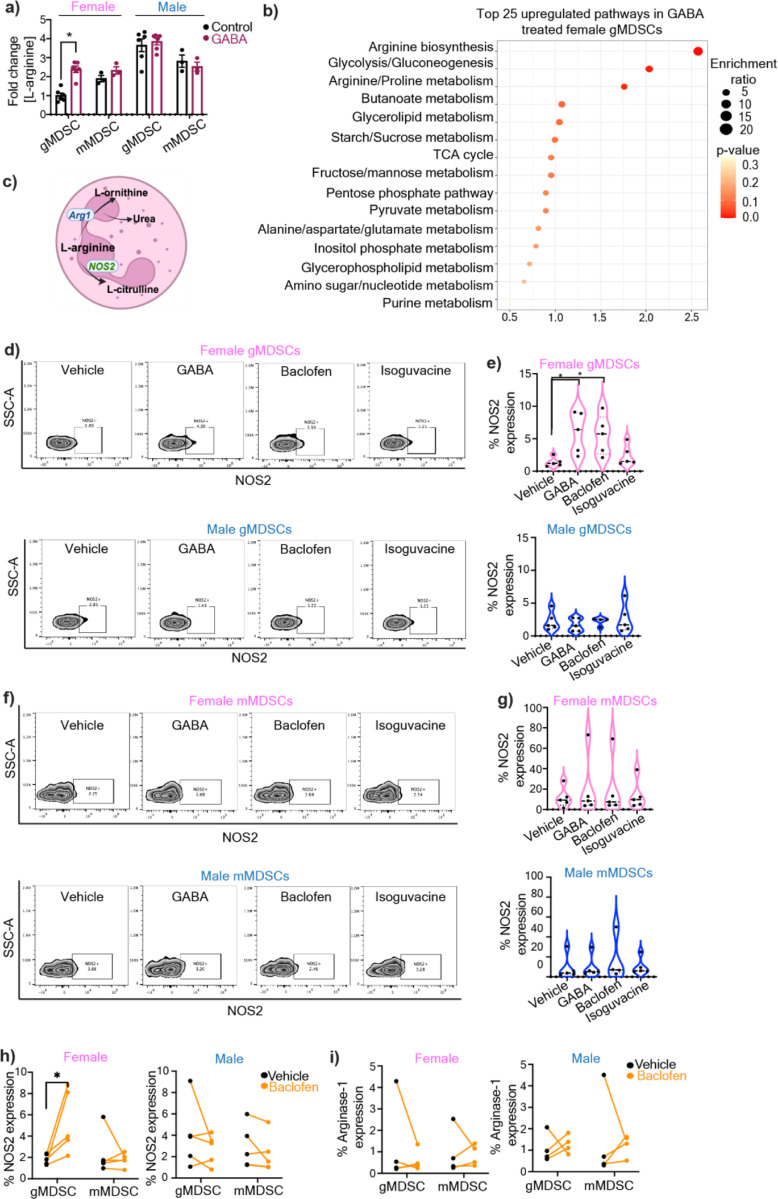
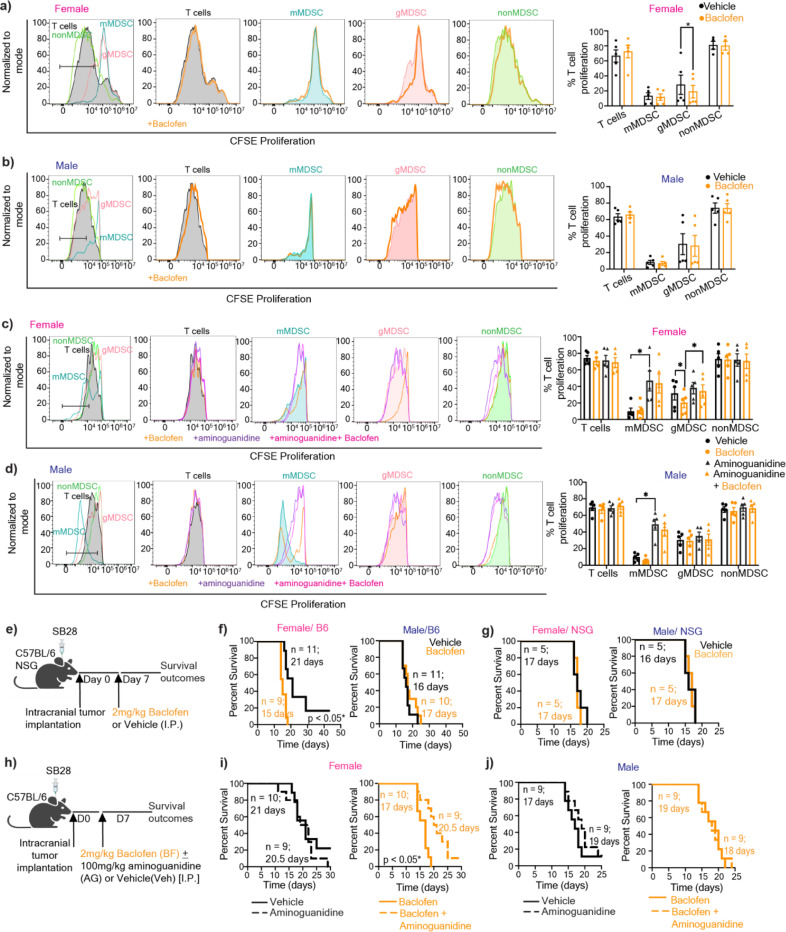
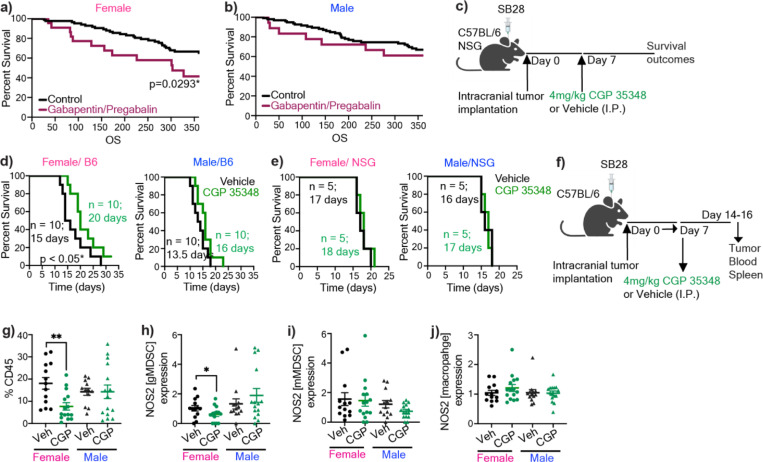
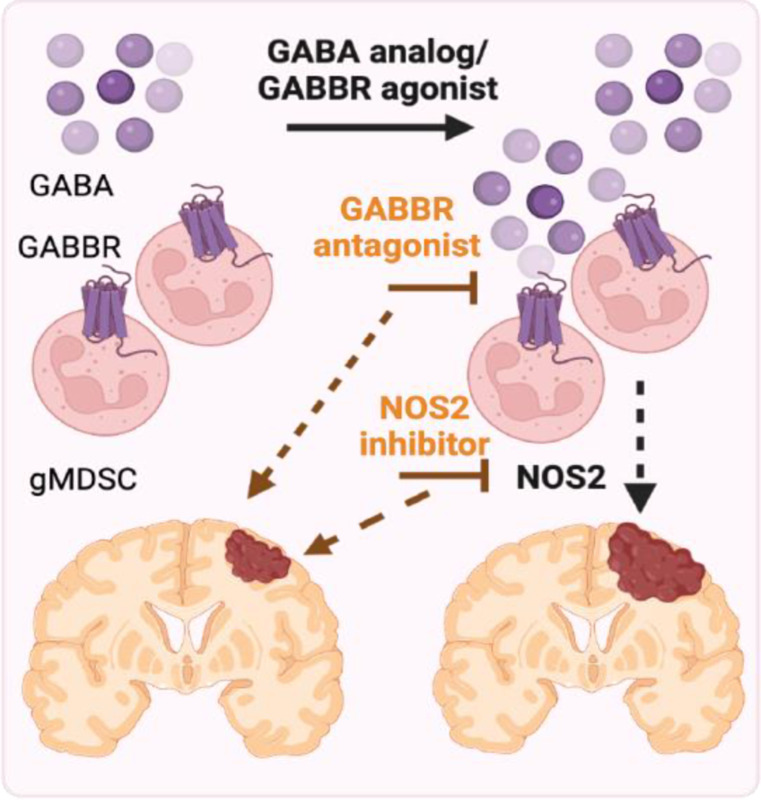
Sex differences in immune responses impact cancer outcomes and treatment response, including in glioblastoma (GBM). However, host factors underlying sex specific immune-cancer interactions are poorly understood. Here, we identify the neurotransmitter γ-aminobutyric acid (GABA) as a driver of GBM-promoting immune response in females. We demonstrated that GABA receptor B (GABBR) signaling enhances L-Arginine metabolism and nitric oxide synthase 2 (NOS2) expression in female granulocytic myeloid-derived suppressor cells (gMDSCs). GABBR agonist and GABA analog promoted GBM growth in females in an immune-dependent manner, while GABBR inhibition reduces gMDSC NOS2 production and extends survival only in females. Furthermore, female GBM patients have enriched GABA transcriptional signatures compared to males, and the use of GABA analogs in GBM patients is associated with worse short-term outcomes only in females. Collectively, these results highlight that GABA modulates anti-tumor immune response in a sex-specific manner, supporting future assessment of GABA pathway inhibitors as part of immunotherapy approaches.

Keywords: GABA; L-arginine; glioblastoma; myeloid-derived suppressor cells; nitric oxide synthase 2; sex differences.


Conflict of interest statement

Conflict of interest: In the past three years, C.A.L. has consulted for Astellas Pharmaceuticals, Odyssey Therapeutics, Third Rock Ventures, and T-Knife Therapeutics, and is an inventor on patents pertaining to Kras regulated metabolic pathways, redox control pathways in pancreatic cancer, and targeting the GOT1-ME1 pathway as a therapeutic approach (US Patent No: 2015126580-A1, 05/07/2015; US Patent No: 20190136238, 05/09/2019; International Patent No: WO2013177426-A2, 04/23/2015). J.D.L reports being named as a co-inventor on pending and issued patents held by the Cleveland Clinic relating to cancer therapies, but these are not directly relevant to this work.

Figures

Extended Figure 1:
Extended Figure 1:. GABA receptor expression in MDSCs.
a) Three drug candidates were predicted to target the GABA pathway in gMDSCs. Vigabatrin, a GABA transaminase inhibitor; progabide, a GABA analog, and brotizolam, a GABA receptor allosteric ligand were among the 20 candidate genes predicted to target gMDSCs based on network medicine analysis. b) Mean expression levels of GABBR and GABAAR in female (n=5) and male (n=8) glioma patients. *p<0.05 as determined by Wilcoxon Rank-Sum test.
Extended Figure 2:
Extended Figure 2:. GABA-mediated metabolic alteration of female gMDSCs.
a) Heatmap demonstrating differentially regulated metabolites in male and female mMDSCs and gMDSCs upon GABA stimulation. Data was normalized to the average sum of metabolites from all the samples and analyzed using Morpheus. b) Relative baseline L-Arginine levels in female and male gMDSCs (n=6) and mMDSCs (n=3), *p<0.01 as determined by two-way ANOVA. c) Relative expression of the L-Arginine transporter Cat2b in male and female mMDSC and gMDSC. d) Change in the frequency of Cat2b expression in female (left) and male (right) MDSCs treated with 100 μM GABA. n=3, * p<0.05 by unpaired t-test compared to vehicle. e) Enrichment plots depicting the top 25 pathways upregulated in female gMDSCs with GABA stimulation. f) Intracellular abundance of GABA in female and male gMDSCs (n=6) and mMDSCs (n=3) following GABA treatment, *p<0.01 as determined by two-way ANOVA.
Extended Figure 3:
Extended Figure 3:. GABA analogs truncates survival in immunocompetent females.
a) Bone marrow-derived cells were stimulated with 50ng/ml M-CSF and polarized into macrophages over a period of 6 days. Macrophages were stimulated overnight with 100 µM GABA or baclofen. Mean fluorescence intensity (MFI) of the pro-inflammatory macrophage markers IA/IE, CD80, and CD86 and the immunosuppressive markers CD163, CD204. Data shown as mean ± SEM from n=3. b) Proliferation rates of the mouse GBM cells SB28 and KR158 (left) and the patient-derived xenograft (PDX) lines L1 and DI318 (right), were analyzed after daily stimulation with 100 µM GABA or Baclofen. Data shown as mean ± SEM. c) Female and male C57BL/6 mice were intracranially implanted with 30,000 (females) and 20,000 (males) SB28 cells, or d) 50,000 KR158 cells. NSG mice were implanted with e) 10,000 SB28 or f) KR158 cells. Seven days post-tumor implantation, the mice were intraperitoneally injected with 25 mg/kg pregabalin daily, following a 5-days-on, 2-days-off schedule. Kaplan-Meier curves depicting the median survival of female (left) and male (right) mice. For each group Data were combined from 2–3 independent experiments. * p<0.05 based on the log-rank test.
Extended Figure 4:
Extended Figure 4:. Effect of GABBR modulation on tumor-infiltrating immune populations.
Tumor-infiltrating immune populations from SB28-bearing male and female mice following CGP 35348 treatment. Percentage of a) gMDSCs (left) and mMDSCs (right). b) Percentage of macrophages and MFI of IA/IE (left) and CD204 (right) of macrophages. c) Percentage of monocytes (left) and dendritic cells (right) d) B cells, NK cells, CD3+ T cells, CD4+ T cells, and CD8+ T cells (n= 13–15). Data shown from individual animals from three independent experiments.
Extended Figure 5:
Extended Figure 5:. GABBR inhibition does not alter peripheral immune responses.
Peripheral immune populations from SB28-bearing male and female mice following CGP 35348 treatment. Graphs showing percentage of NOS2+ gMDSCs (left) and NOS2+ mMDSCs (right) from a) blood and b) spleen. c) Graphs showing the percentage of gMDSCs, mMDSCs, macrophages, monocytes, dendritic cells (left to right, top panel) and B cells, NK, CD3, CD4+, and CD8+ (left to right, bottom panel) from blood. d) Graphs showing the percentage of gMDSCs, mMDSCs, macrophages, monocytes, dendritic cells (left to right, top panel) and B cells, NK, CD3, CD4+, and CD8+ (left to right, bottom panel) from spleen. Data shown from individual animals (n= 13–15) from three independent experiments.
Figure 1:
Figure 1:. gMDSCs express GABA receptors.
a) Pie chart illustrating the distribution of molecular targets among 20 clinically-approved drug candidates predicted to be effective against gMDSCs. b) Graph showing the expression levels of GABBR1 (left) and GABBR2 (right) in mouse bone marrow-derived gMDSCs and mMDSCs (n=7–8; *p < 0.05 as determined by unpaired t-test) c) Expression of GABAAR2 in mouse bone marrow-derived gMDSCs and mMDSCs (n=4). Data shown as mean ± SEM. d) GABA signature (GABAAR, GABBR, GABA transaminase, and GABA transporter in tumor infiltrating immune populations (macrophages, microglia, monocytes/mMDSCs, neutrophils/gMDSCs and T cells) in female (n=5) and male (n=8) glioma patients along with e) Mean expression levels of GABBR1 (top panel) and GABBR2 (bottom panel) in female (n=5) and male (n=8) immune populations of glioma patients. *p<0.05 as determined by Wilcoxon Rank-Sum test.
Figure 2:
Figure 2:. GABA metabolically alters female gMDSCs through upregulation of L-arginine.
a) gMDSCs (CD11b+Ly6G+Ly6C-) and mMDSCs (CD11b+Ly6G-Ly6C+) from male and female mouse were sorted from bone marrows and treated with 100 µM GABA overnight. Relative L-Arginine levels in female and male gMDSCs (n=6) and mMDSCs (n=3) following GABA treatment were determined by mass spectrometry. *p<0.01 as determined by 2-way ANOVA b) Graphical representation depicting the metabolic conversion of L-arginine to L-ornithine and L-citrulline by Arginase-1 (Arg-1) and nitric oxide synthase 2 (NOS2), respectively. Male and female mouse MDSCs were treated with 100 µM GABA, baclofen, isoguvacine or PBS (vehicle) overnight. c) NOS2 expression was analyzed by flow cytometry. Representative contour plots demonstrating the change in NOS2 expression in gMDSCs with GABA, baclofen, and isoguvacine treatment. d) Violin plots showing the percentage of NOS2 expression in female (pink, top) and male (blue, bottom) mouse gMDSCs (n=4–5). *p< 0.05 as determined by unpaired t-test. e) Representative contour plots demonstrating the change in NOS2 expression in mMDSCs with GABA, baclofen, and isoguvacine treatment. f) Violin plots depicting the percentage of NOS2 expression in female (pink, top) and male (blue, bottom) mouse mMDSCs (n=4–5). g) Representative contour plots demonstrating the change in Arg1 expression in gMDSCs with GABA, baclofen, and isoguvacine treatment. h) Violin plots showing the percentage of Arg1 expression in female (pink, top) and male (blue, bottom) mouse gMDSCs (n=4). i) Representative contour plots demonstrating the change in Arg1 expression in mMDSCs with GABA, baclofen, and isoguvacine treatment. j) Violin plots depicting the percentage of Arg1 expression in female (pink, top) and male (blue, bottom) mouse mMDSCs (n=4). Human PBMCs were treated with 100 μM baclofen or PBS (vehicle) overnight and expression of NOS2 and Arg-1 analyzed by flow cytometry. The frequency of k) NOS2 (n=5) and l) Arg-1 (n=4) expressing gMDSCs versus mMDSCs from female (left) and male (right) donors. *p<0.05 as determined by paired t-test.
Figure 3:
Figure 3:. GABBR signaling drives GBM and gMDSC-mediated T cell suppression in females in a NOS2-dependent manner.
T cells activated with 100IU/ml IL-2 and anti-CD3/CD28 were co-cultured with mMDSCs (CD11b+Ly6G-Ly6C+), gMDSCs (CD11b+Ly6G+Ly6C-), nonMDSCs (CD11b+Ly6G-Ly6C-). T cells and myeloid co-cultures were treated daily with 100 µM baclofen. Representative histograms depicting proliferation rate of T cells (left), and graphs showing the frequency of proliferating T cells (right) for a) female, and b) male samples. Mean + SEM combined from n=4–5 samples; *p<0.05 as determined by ratio paired t-test. T cells and myeloid cell cocultures were treated with baclofen daily and/or 1mM aminoguanidine once. Representative histograms depicting proliferation rate of T cells (left), and graphs showing the frequency of proliferating T cells (right) for c) females and d) males, n=5, *p<0.05 as determine by paired t-test. e) Female and male C57BL/6 mice were intracranially injected with 30,000 (females) and 20,000 (males) SB28 cells. NSG mice were orthotopically implanted with 10,000 SB28 cells. 7 days post-tumor implantation mice were intraperitoneally injected with 2 mg/kg baclofen or vehicle following a 5-days-on-2-day-off schedule. Kaplan-Meier curves depicting median survival span of female (left) and male (right) f) C57BL/6 mice (data combined from two independent experiments), and g) NSG mice treated with vehicle versus baclofen. h) Female and male C57BL/6 mice were intracranially injected with 30,000 (females) and 20,000 (males) SB28 cells. 7 days post-tumor implantation mice were intraperitoneally injected with 2 mg/kg baclofen and/or 100 mg/kg aminoguanidine following a 5-days-on-2-day-off schedule. Kaplan-Meier curves depicting median survival span of i) female and j) male mice treated with aminoguanidine alone (left) or baclofen plus aminoguanidine (right). Data were combined from two independent experiments. * p<0.05 based on the log-rank test.
Figure 4:
Figure 4:. Modulation of GABBR signaling impacts GBM survival in females highlighting its clinical relevance.
Kaplan-Meier curves depicting survival of a) female and b) male patients with primary GBM on gabapentin/pregabalin versus the control cohort. p<0.05 as determined by log-rank test. c) Female and male C57BL/6 mice were intracranially implanted with 30,000 (females) and 20,000 (males) SB28. NSG mice were implanted with 10,000 SB28. 7 days post-tumor implantation mice were intraperitoneally injected 4 mg/kg CGP 35348 or vehicle following a 5-days-on-2-day-off schedule. Kaplan-Meier curves depicting median survival span of female (left) and male (right) d) C57BL/6 mice (data were combined from two independent experiments), and e) NSG mice. * p<0.05 as determined by log-rank test. f) Schematics illustrating the timeline for the analysis of the immune landscape following CGP 35348 treatment of SB28-bearing male and female mice. g) The percentage of tumor-infiltrating CD45+ cells, and the relative frequency of h) NOS2+ gMDSCs from tumors, i) NOS2+ mMDSCs from tumors, j) NOS2+ macrophages from tumors of vehicle or CGP 35348 treated mice (n=13–15). Data shown from individual animals, combined from three independent experiments. *p<0.05 determined by unpaired t-test.
Figure 5:
Figure 5:. GABA-GABBR axis promotes NOS2-mediated GBM in females.
Proposed model depicting the effect of GABA in the female GBM microenvironment. Model created with biorender.

References

    1. Stupp R. et al. Effect of Tumor-Treating Fields Plus Maintenance Temozolomide vs Maintenance Temozolomide Alone on Survival in Patients With Glioblastoma: A Randomized Clinical Trial. JAMA 318, 2306–2316 (2017). 10.1001/jama.2017.18718 - DOI - PMC - PubMed
    1. Cloughesy T. F. et al. Neoadjuvant anti-PD-1 immunotherapy promotes a survival benefit with intratumoral and systemic immune responses in recurrent glioblastoma. Nat Med 25, 477–486 (2019). 10.1038/s41591-018-0337-7 - DOI - PMC - PubMed
    1. Reardon D. A. et al. Effect of Nivolumab vs Bevacizumab in Patients With Recurrent Glioblastoma: The CheckMate 143 Phase 3 Randomized Clinical Trial. JAMA Oncol 6, 1003–1010 (2020). 10.1001/jamaoncol.2020.1024 - DOI - PMC - PubMed
    1. Schalper K. A. et al. Neoadjuvant nivolumab modifies the tumor immune microenvironment in resectable glioblastoma. Nat Med 25, 470–476 (2019). 10.1038/s41591-018-0339-5 - DOI - PubMed
    1. Ser M. H., Webb M. J., Sener U. & Campian J. L. Immune Checkpoint Inhibitors and Glioblastoma: A Review on Current State and Future Directions. J Immunother Precis Oncol 7, 97–110 (2024). 10.36401/JIPO-23-34 - DOI - PMC - PubMed

Publication types