[Preprint]. 2024 Jul 22:2024.07.21.604490.
doi: 10.1101/2024.07.21.604490.

Meiosis-specific decoupling of the pericentromere from the kinetochore

Affiliations

Meiosis-specific decoupling of the pericentromere from the kinetochore

Bo Pan et al. bioRxiv. .

Abstract

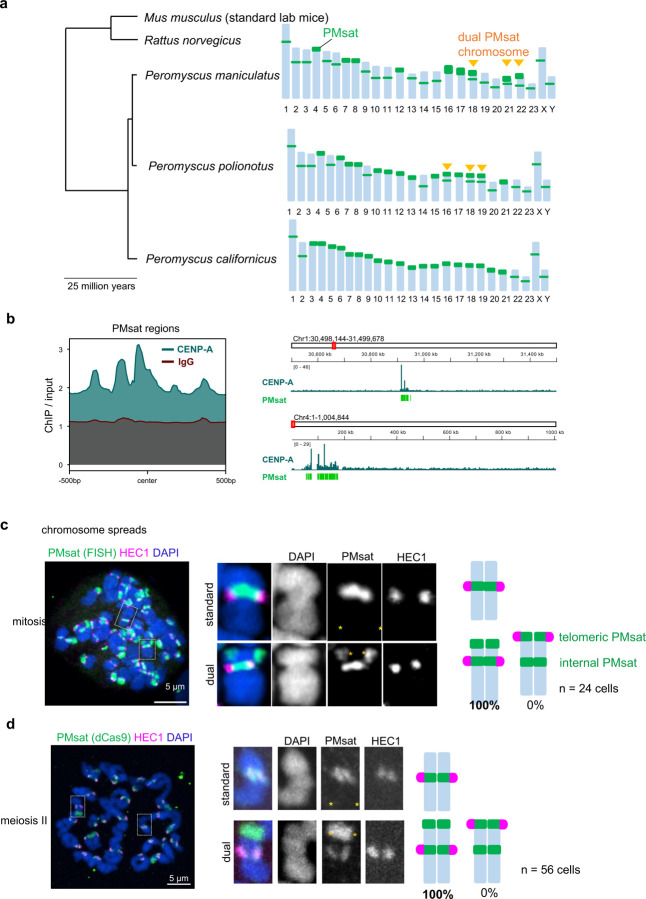
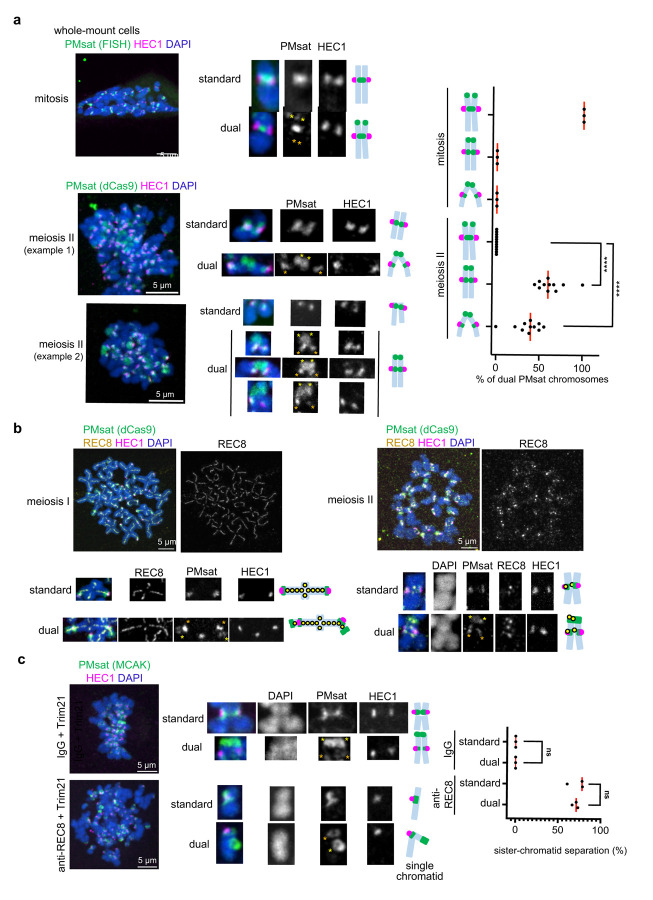
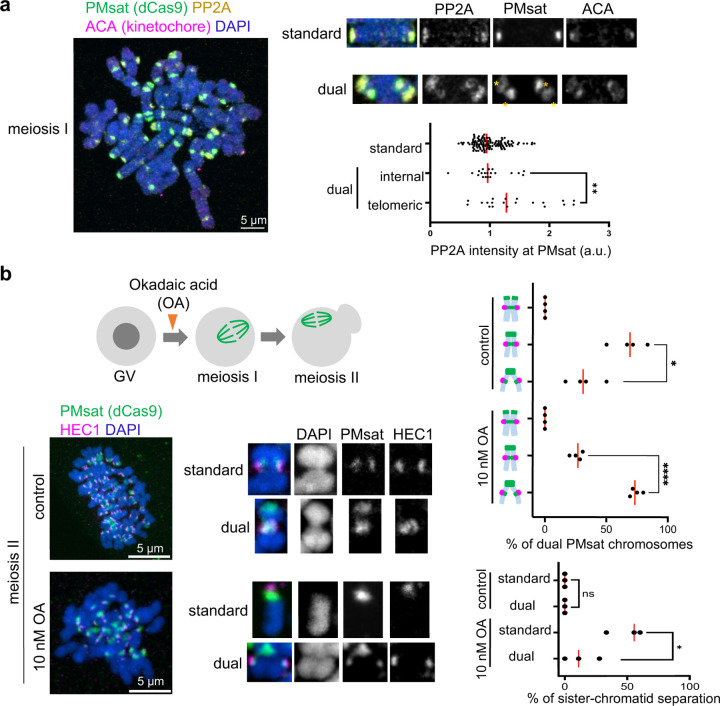
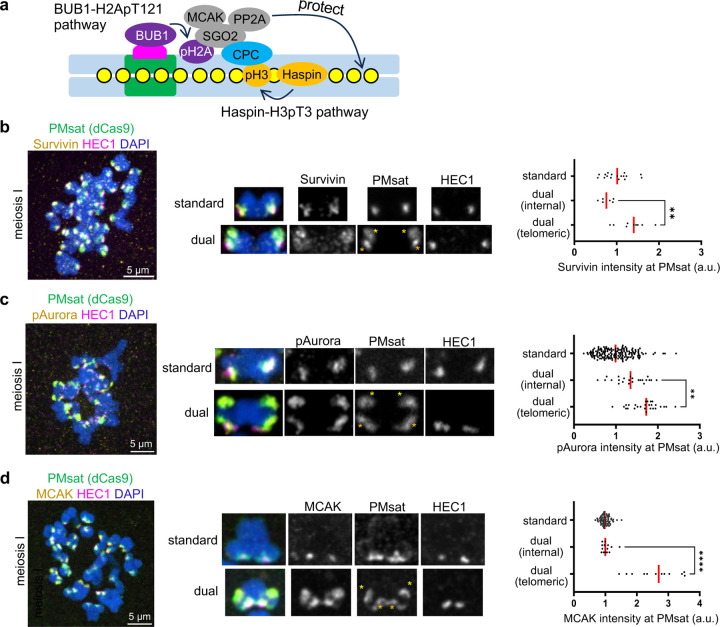
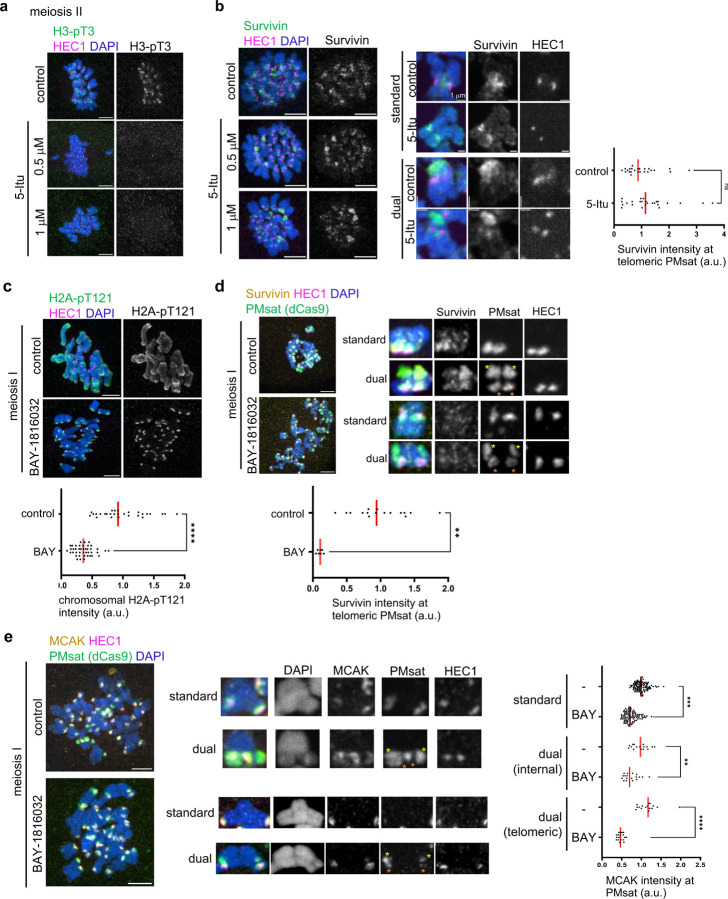
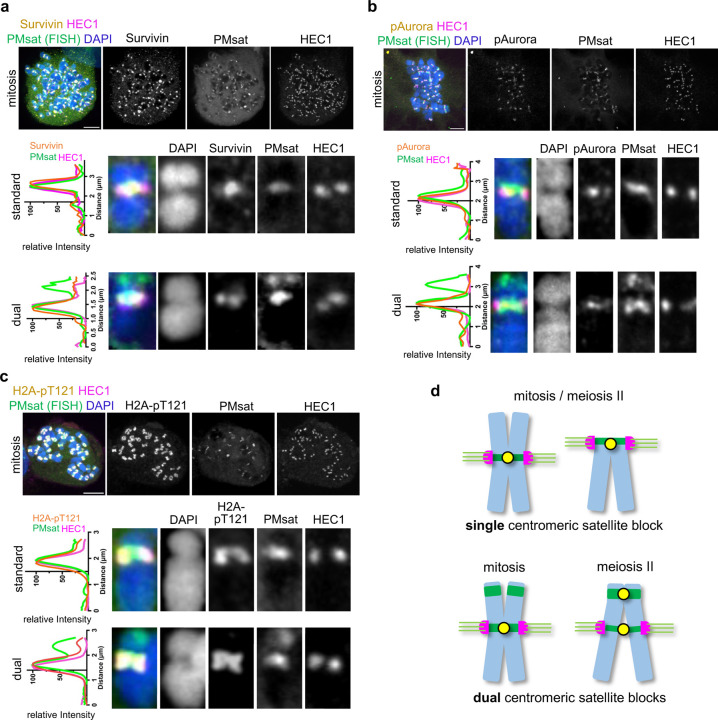
The primary constriction site of the M-phase chromosome is an established marker for the kinetochore position, often used to determine the karyotype of each species. Underlying this observation is the concept that the kinetochore is spatially linked with the pericentromere where sister-chromatids are most tightly cohered. Here, we found an unconventional pericentromere specification with sister chromatids mainly cohered at a chromosome end, spatially separated from the kinetochore in Peromyscus mouse oocytes. This distal locus enriched cohesin protectors, such as the Chromosomal Passenger Complex (CPC) and PP2A, at a higher level compared to its centromere/kinetochore region, acting as the primary site for sister-chromatid cohesion. Chromosomes with the distal cohesion site exhibited enhanced cohesin protection at anaphase I compared to those without it, implying that these distal cohesion sites may have evolved to ensure sister-chromatid cohesion during meiosis. In contrast, mitotic cells enriched CPC only near the kinetochore and the distal locus was not cohered between sister chromatids, suggesting a meiosis-specific mechanism to protect cohesin at this distal locus. We found that this distal locus corresponds to an additional centromeric satellite block, located far apart from the centromeric satellite block that builds the kinetochore. Several Peromyscus species carry chromosomes with two such centromeric satellite blocks. Analyses on three Peromyscus species revealed that the internal satellite consistently assembles the kinetochore in both mitosis and meiosis, whereas the distal satellite selectively enriches cohesin protectors in meiosis to promote sister-chromatid cohesion at that site. Thus, our study demonstrates that pericentromere specification is remarkably flexible and can control chromosome segregation in a cell-type and context dependent manner.


Conflict of interest statement

Declaration of interests The authors declare no competing interests.

Figures

Figure 1.
Figure 1.. Kinetochores assemble exclusively at internal PMsat on dual PMsat chromosomes.
a, Phylogenetic tree of mouse species in the Mus, Rattus, and Peromyscus genus. For each Peromyscus species, the chromosomal distribution of PMsat is shown based on Smalec et al. Peromyscus maniculatus and Peromyscus polionotus but not Peromyscus californicus carry chromosomes with dual PMsat blocks. b, CENP-A enrichment at PMsat regions. CENP-A and IgG enrichment on PMsat sequences is provided as ratio of ChIP signal over the input (left). IGV snapshots of CENP-A enrichment (ratio over input) at PMsat regions on two chromosomes (right). c, Metaphase chromosome spread using P. maniculatus mitotic cells (ovarian granulosa cells) were stained for PMsat (Oligopaint) and a kinetochore marker, HEC1. d, P. maniculatus meiosis II oocytes expressing dCas9-EGFP and gRNA targeting PMsat were used for chromosome spread and stained for HEC1. The proportion of chromosomes that assemble kinetochores at internal PMsat and telomeric PMsat was quantified; n = 24 and 56 cells from at least three independent experiments were examined for mitosis (c) and meiosis II (d), respectively. The images are maximum projections showing all the chromosomes (left) and optical sections to show individual chromosomes (right); asterisks denote the chromosomal location of internal PMsat (orange) and telomeric PMsat (yellow) on dual PMsat chromosomes; scale bars, 5 µm.
Figure 2.
Figure 2.. Telomeric PMsat acts as the primary cohesion site in oocytes.
a, P. maniculatus mitotic cells (ovarian granulosa cells) (top) and meiosis II oocytes expressing dCas9-EGFP with gRNA targeting PMsat (bottom) were fixed and stained for HEC1. For the mitotic cells, PMsat was labeled by Oligopaint. The proportion of each chromosome configuration of dual PMsat chromosomes were quantified for mitosis and meiosis II; each dot represents an individual experiment, n = 13 and 46 cells from three and 11 independent experiments were analyzed for mitosis and meiosis II, respectively; unpaired two-sided t-test was used to analyze statistical significance; *P < 0.05. b, Chromosome spreads using P. maniculatus metaphase I (left) and metaphase II (right) oocytes expressing dCas9-EGFP and gRNA targeting PMsat were stained with HEC1 and REC8; n = 14 and 9 cells from three independent experiments were analyzed for meiosis I and II, respectively. Additional examples of REC8 staining in Extended Data Fig. 5a. c, P. maniculatus meiosis I oocytes microinjected with mCherry-Trim21 mRNA together with either control IgG antibody (top) or anti-REC8 antibody (bottom) were matured to meiosis II and fixed and stained for MCAK (a PMsat marker, see Figure 4d) and HEC1. Chromosomes with a single kinetochore (HEC1) were scored as single chromatids, and the proportion of chromosomes exhibiting sister chromatid separation was quantified; each dot represents an individual experiment; n = 23 and 15 cells from three independent experiments for the IgG and REC8 antibody, respectively; unpaired two-sided t-test was used to analyze statistical significance; red line, median. The images are maximum projections showing all the chromosomes (left) and optical sections to show individual chromosomes (right); asterisks denote the chromosomal location of internal PMsat (orange) and telomeric PMsat (yellow) on dual PMsat chromosomes, scale bars, 5 µm.
Figure 3.
Figure 3.. PP2A-mediated cohesin protection at telomeric PMsat.
a, Chromosome spreads of P. maniculatus meiosis I oocytes expressing dCas9-EGFP with gRNA targeting PMsat were stained with ACA (kinetochore) and PP2A. Signal intensities of PP2A at PMsat were quantified; each dot represents one chromosome; n = 152 chromosomes from three independent experiments; unpaired two-sided t-test was used to analyze statistical significance, *P < 0.05; red line, median. b, P. maniculatus meiosis I oocytes expressing dCas9-EGFP with gRNA targeting PMsat were treated with 10 nM Okadaic acid (OA), matured to meiosis II, and fixed and stained with HEC1. The proportion of different chromosome configuration of dual PMsat chromosomes (top graph) and sister-chromatid separation (bottom graph; DAPI and HEC1 signals were used to determine if the chromosome is a single chromatid or sister chromatids) were quantified; each dot represents an individual experiment; n = 26 and 33 oocytes from four independent experiments for control and the OA-treated group, respectively; unpaired two-sided t-test was used to analyze statistical significance, *P < 0.05; red line, median. The images are maximum projections showing all the chromosomes (left) and optical sections to show individual chromosomes (right); asterisks denote the chromosomal location of internal PMsat (orange) and telomeric PMsat (yellow) on dual PMsat chromosomes; scale bars, 5 µm.
Figure 4.
Figure 4.. Telomeric PMsat assembles an ectopic pericentromere decoupled from the kinetochore.
a, Schematic depicting two key pathways in pericentromere factors (green, centromere DNA; pink, kinetochore; yellow, cohesin). b-d, P. maniculatus meiosis I oocytes expressing dCas9-EGFP with gRNA targeting PMsat were fixed and stained for HEC1 as well as Survivin (b), phosphorylated Aurora kinase (c), and MCAK (d). Signal intensities of Survivin, pAurora, and MCAK at PMsat were quantified; each dot represents one chromosome; n = 32, 210, and 167 chromosomes from three independent experiments were analyzed for Survivin, pAurora, and MCAK, respectively; unpaired two-sided t-test was used to analyze statistical significance, **P < 0.01; red line, median. The images are maximum projections showing all the chromosomes (left) and optical sections to show individual chromosomes (right); asterisks denote the chromosomal location of internal PMsat (orange) and telomeric PMsat (yellow) on dual PMsat chromosomes; scale bars, 5 µm.
Figure 5.
Figure 5.. The BUB1 kinase-H2A-pT121 pathway recruits pericentromeric factors to telomeric PMsat.
a,b, P. maniculatus meiosis I oocytes treated with 5-iodotubercidin (5-Itu) were matured to meiosis II, fixed, and stained for HEC1 together with H3-pT3 (a) or Survivin (b). n = 16 and 15 cells from three independent experiments were analyzed for control and the 5-Itu-treated group, respectively (a). Signal intensities of Survivin at telomeric PMsat were quantified (b); each dot represents one chromosome, n = 26 and 23 chromosomes from three independent experiments for control and the BAY-treated group, respectively; unpaired two-sided t-test was used to analyze statistical significance; red line, median. c, P. maniculatus meiosis I oocytes treated with BAY-1816032, fixed at metaphase I, and stained for H2A-pT121 and HEC1. Signal intensities of H2A-pT121 on chromosomes were quantified; each dot represents one oocyte; n = 13 and 11 oocytes from three independent experiments were analyzed for control and the 5-Itu-treated group, respectively; unpaired two-sided t-test was used to analyze statistical significance, ****P < 0.001; red line, median. d, P. maniculatus meiosis I oocytes expressing dCas9-EGFP with gRNA targeting PMsat were treated with BAY-1816032, fixed at metaphase I, and stained for Survivin and HEC1. Signal intensities of Survivin at telomeric PMsat were quantified; each dot represents an individual chromosome; n = 16 and 10 oocytes from three independent experiments were analyzed for control and the BAY-treated group, respectively; unpaired two-sided t-test was used to analyze statistical significance, ****P < 0.001; red line, median. e, P. maniculatus meiosis I oocytes expressing dCas9- EGFP with gRNA targeting PMsat were treated with BAY-1816032, fixed at metaphase I, and stained for MCAK and HEC1. Signal intensities of MCAK at PMsat were quantified; each dot represents an individual chromosome; n = 122 and 141 chromosomes from four independent experiments were analyzed for control and the BAY-treated group, respectively; unpaired two-sided t-test was used to analyze statistical significance, **P < 0.01, ***P < 0.005, ****P < 0.001; red line, median. The images are maximum projections showing all the chromosomes (top) and optical sections to show individual chromosomes (bottom); asterisks denote the chromosomal location of internal PMsat (orange) and telomeric PMsat (yellow) on dual PMsat chromosomes; scale bars, 5 µm.
Figure 6.
Figure 6.. Ectopic pericentromere formation is specific to meiosis.
a-c, P. maniculatus cells (granulosa cells) arrested in mitosis by Nocodazole were fixed and stained for HEC1 together with Survivin (a), phosphorylated Aurora kinase (b), or H2A-pT121 (c). Immunostained cells were then labeled for PMsat using the Oligopaint technique. n = 13, 21, and 11 cells from three independent experiments were analyzed. Line scans of the signal intensities of Survivin (a), pAurora (b), or H2A-pT121 (c) together with PMsat and HEC1 were performed along the chromosome. The images are maximum projections showing all the chromosomes (left) and optical sections to show individual chromosomes (right); asterisks denote the chromosomal location of internal PMsat (orange) and telomeric PMsat (yellow) on dual PMsat chromosomes; scale bars, 5 µm. d, Model for the centromere and pericentromere specification in mitosis and meiosis when a chromosome carries single or dual centromere satellite block.

Similar articles

References

    1. Cheeseman I. M. & Desai A. Molecular architecture of the kinetochore-microtubule interface. Nature reviews. Molecular cell biology 9, 33–46 (2008). - PubMed
    1. Foley E. a & Kapoor T. M. Microtubule attachment and spindle assembly checkpoint signalling at the kinetochore. Nature reviews. Molecular cell biology 14, 25–37 (2013). - PMC - PubMed
    1. Heald R. & Khodjakov A. Thirty years of search and capture: The complex simplicity of mitotic spindle assembly. The Journal of cell biology 211, 1103–11 (2015). - PMC - PubMed
    1. Marston A. L. Shugoshins: tension-sensitive pericentromeric adaptors safeguarding chromosome segregation. Molecular and cellular biology 35, 634–48 (2015). - PMC - PubMed
    1. Schalch T. & Steiner F. A. Structure of centromere chromatin: from nucleosome to chromosomal architecture. Chromosoma 126, 443–455 (2017). - PMC - PubMed

Publication types

LinkOut - more resources