[Preprint]. 2024 Dec 2:2024.07.23.604673.
doi: 10.1101/2024.07.23.604673.

Genetic evolution of keratinocytes to cutaneous squamous cell carcinoma

Affiliations

Genetic evolution of keratinocytes to cutaneous squamous cell carcinoma

Bishal Tandukar et al. bioRxiv. .

Update in

  • Genetic evolution of keratinocytes to cutaneous squamous cell carcinoma.
    Tandukar B, Deivendran D, Chen L, Bandari AK, Cruz-Pacheco N, Sharma H, Wang M, Xu A, Chen DB, George CD, Marty AL, Cho RJ, Cheng JB, Saylor D, Gerami P, Yeh I, Arron ST, Bastian BC, Shain AH. Tandukar B, et al. Nat Commun. 2025 Nov 27;16(1):10663. doi: 10.1038/s41467-025-65687-y. Nat Commun. 2025. PMID: 41309580 Free PMC article.

Abstract

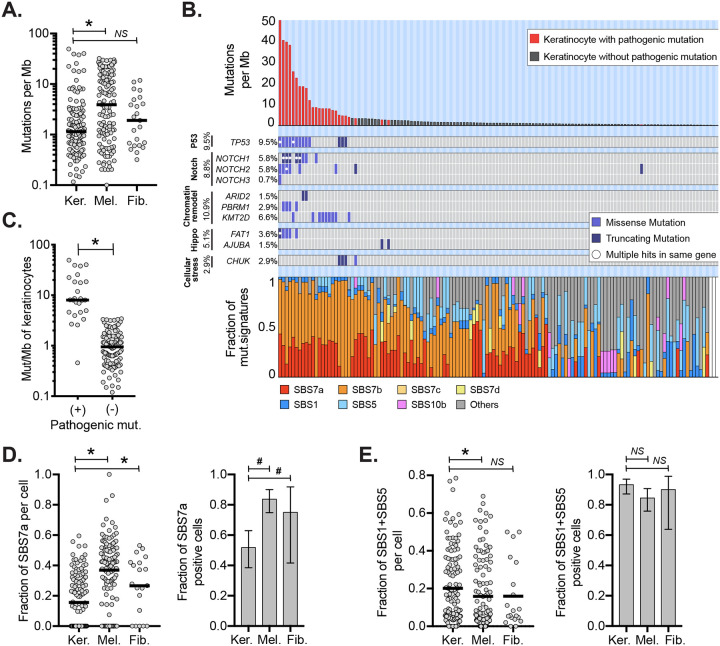
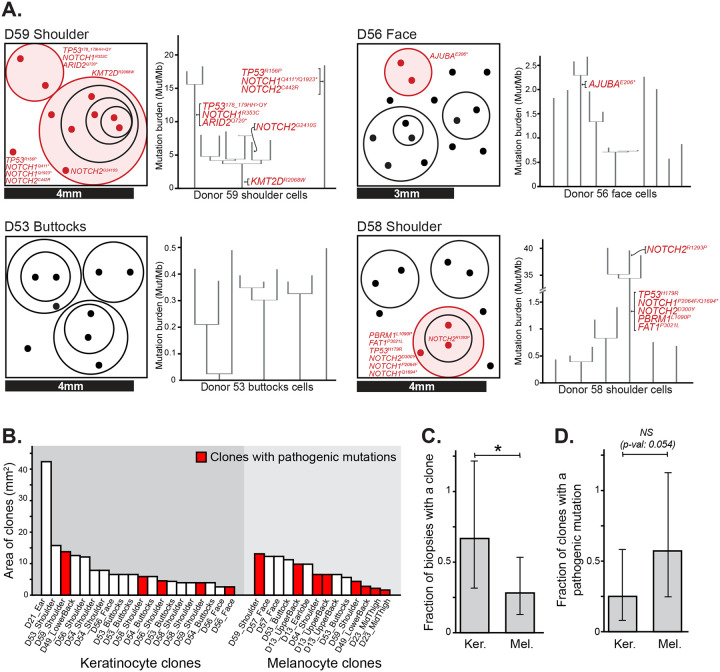
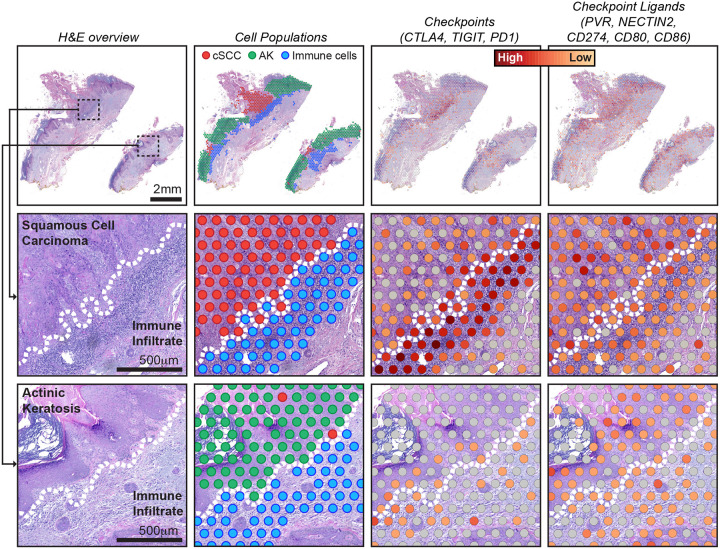
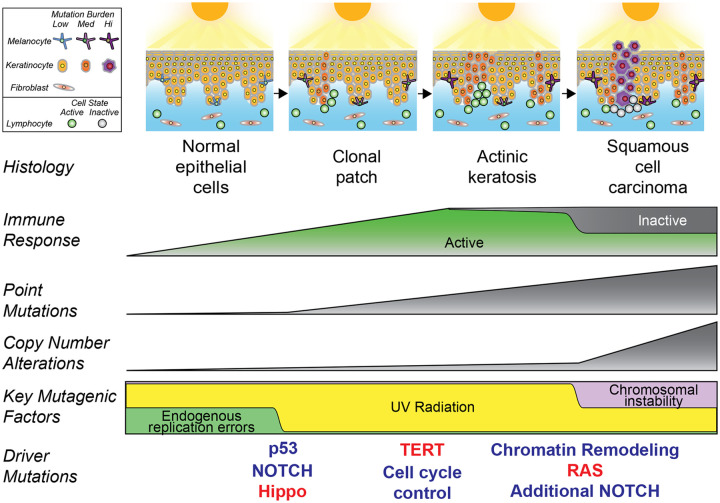
We performed multi-omic profiling of epidermal keratinocytes, precancerous actinic keratoses, and squamous cell carcinomas to understand the molecular transitions during skin carcinogenesis. Single-cell mutational analyses of normal skin cells showed that most keratinocytes have remarkably low mutation burdens, despite decades of sun exposure, however keratinocytes with TP53 or NOTCH1 mutations had substantially higher mutation burdens. These observations suggest that wild-type keratinocytes (i.e. without pathogenic mutations) are able to withstand high dosages of cumulative UV radiation, but certain pathogenic mutations break these adaptive mechanisms, priming keratinocytes for transformation by increasing their mutation rate. Mutational profiling of squamous cell carcinomas adjacent to actinic keratoses revealed TERT promoter and CDKN2A mutations emerging in actinic keratoses, whereas additional mutations inactivating ARID2 and activating the MAPK-pathway delineated the transition to squamous cell carcinomas. Surprisingly, actinic keratoses were often not related to their neighboring squamous cell carcinoma, indicating that collisions of unrelated neoplasms are common in the skin. Spatial variation in gene expression patterns was common in both tumor and immune cells, with high expression of checkpoint molecules at the invasive front of tumors. In conclusion, this study catalogues the key events during the evolution of cutaneous squamous cell carcinoma.


Figures

Figure 1.
Figure 1.. Keratinocytes have distinct mutational landscapes compared to other cell types.
A. Mutation burdens (mutations/megabase) of individual keratinocytes (Ker.) compared to melanocytes (Mel.) and fibroblasts (Fib.) B. Mutation burden, driver mutations, and mutational signatures for 137 keratinocytes with each column of the three stacked panels representing an individual cell. Top panel: mutation burden of keratinocytes in descending order. Red bars indicate cells harboring one or more pathogenic mutations. Middle panel: tiling plot of pathogenic mutations (rows). Bottom panel: the fractions of different mutational signatures for each cell. White bars indicate keratinocytes with too few mutations to perform signature analysis. C. Mutation burdens of keratinocytes with and without pathogenic mutations. D. Left panel: fraction of mutations with UV signatures (SBS7a) in keratinocytes, melanocytes, or fibroblasts. Right panel: fraction of cells with detectable SBS7a in keratinocytes, melanocytes, or fibroblasts. E. The data is plotted as in panel D but for SBS87. For all plots, an asterisk (*) or a hash (#) denotes p<0.05 using the Wilcoxon rank-sum test (cell to cell comparisons) or the Poisson test (proportion comparisons) respectively. Horizontal bars show the median (panels A and C) or mean (panels D and E). Error bars in panels D and E show 95% confidence intervals (Poisson test).
Figure 2.
Figure 2.. Clonal architecture of keratinocytes in human skin.
A. Clonal structure of keratinocytes from four representative skin biopsies (see Fig. S5 for all biopsies). The surface area of each biopsy is drawn to scale, as indicated, with dots representing the cells genotyped from each biopsy. The circles group phylogenetically related cells, with pathogenic mutations labeled in red. To the right of each schema, the corresponding phylogenetic trees, rooted in the germline state, are shown for all cells from that biopsy. B. The area occupied by individual clones was calculated from the size of each biopsy and the proportion of cells attributed to each clone. Clone areas are shown for keratinocytes and melanocytes with clones harboring pathogenic mutations indicated in red. C-D. Fraction of biopsies with a detectable clone (panel C) and fraction of clones with an underlying pathogenic mutation (panel D), separately plotted for keratinocytes (Ker.) and melanocytes (Mel.). * denotes p<0.05 (Poisson test).
Figure 3.
Figure 3.. The genetic evolution of a cutaneous squamous cell carcinoma from an actinic keratosis.
A. H&E-stained section of a skin biopsy with adjacent areas of squamous cell carcinoma and actinic keratosis dissected, as indicated by the dashed lines. B. Scatter plot of mutant allele fractions in the squamous cell carcinoma and actinic keratosis reveal three clusters of mutations. C. The same scatterplot as shown in panel B with pathogenic mutations annotated. D. Copy number alterations were inferred over bins of the genome (columns) for each histologic area (rows) and are shown as a heatmap (red = gain, blue = loss, white = no change). No somatic gains or losses were observed. E. Major allele frequency – 0.5 (y-axis) for heterozygous SNPs across the genome (x-axis) show loss of heterozygosity over chromosome 9p. F. Phylogenetic tree rooted at the germline state. G and H. Immunostaining for p53 (panel G, brown stain) and phospho-MAPK (panel H, purple stain), show keratinocytes overexpressing p53 in both regions with increased phospho-MAPK in the squamous cell carcinoma.
Figure 4.
Figure 4.. The sequential order of genetic alterations during progression from actinic keratosis to squamous cell carcinoma.
A. Phylogenetic trees, rooted in the germline state, summarize the evolution of four squamous cell carcinomas that evolved from actinic keratoses. See figure S7 for further details on these four cases and figure 3 for a summary of the example case. B. Eight squamous cell carcinomas that evolved from neighboring precursor lesions were identified as described. The stacked bar plot (top panel) indicates the proportion of mutations, recurrently mutated in these eight cases, in the trunk versus branch of phylogenetic trees. The bar plot (lower panel) indicates the number of cases with a mutation in each pathway. Mutations in the p53, Notch, TERT, and Rb pathways tended to occur early, contributing to the formation of actinic keratoses. Mutations affecting the SWI/SNF chromatin remodeling complex or activating the MAPK/PI3K pathways tended to occur later, driving the transition to squamous cell carcinoma. C. The frequency of mutations in select driver genes in normal skin biopsies versus squamous cell carcinoma. Error bars show 95% confidence intervals (Poisson test) with a y=x line included for orientation.
Figure 5.
Figure 5.. Spatial heterogeneity in gene expression of immune cells at the interface of squamous cell carcinoma versus actinic keratosis.
Each column of images shows a different view of spatial transcriptomic data from case BB05, including: an H&E overview, annotated spots, and gene expression of immune checkpoints and their ligands. See figure S12 for an overview of other cases. Gene expression intensities represent the combined expression of the checkpoint or ligand genes listed. Zoomed insets show the interface of tumor epithelia and immune cells, illustrating different levels of checkpoint and ligand expression in squamous cell carcinoma versus actinic keratosis. Dotted lines indicate the tumor/immune boundary.
Figure 6.
Figure 6.. Summary of key events that occur during the evolution of cutaneous squamous cell carcinoma.
After continual exposures to UV radiation, fibroblasts modestly increase their mutation burdens, melanocytes sharply increase their mutation burdens, and keratinocytes have a mixed response. Most keratinocytes accumulate little mutational damage, but a subset with pathogenic mutations build up mutations more rapidly than other skin cells. UV radiation induces expansion of independent clones of keratinocytes, often in close proximity and admixed, resulting in a complex clonal structure whereby adjacent lesions are not necessarily related. Driver mutations undergo selection in a stereotypical order, linked to histologic and genetic changes that occur during tumor evolution. An immune response builds during progression, but activity is blunted via engagement of immune checkpoints in squamous cell carcinoma.

References

    1. Nehal KS, Bichakjian CK. Update on Keratinocyte Carcinomas. N Engl J Med. 2018;379:363–74. - PubMed
    1. Mansouri B, Housewright CD. The Treatment of Actinic Keratoses-The Rule Rather Than the Exception. JAMA Dermatol. 2017;153:1200. - PubMed
    1. Karia PS, Han J, Schmults CD. Cutaneous squamous cell carcinoma: estimated incidence of disease, nodal metastasis, and deaths from disease in the United States, 2012. J Am Acad Dermatol. 2013;68:957–66. - PubMed
    1. Wu W, Weinstock MA. Trends of keratinocyte carcinoma mortality rates in the United States as reported on death certificates, 1999 through 2010. Dermatol Surg. 2014;40:1395–401. - PubMed
    1. Siegel RL, Miller KD, Jemal A. Cancer statistics, 2016. CA: A Cancer Journal for Clinicians. 2016;66:7– 30. - PubMed

Publication types