. 2025 Jan;19(1):225-247.
doi: 10.1002/1878-0261.13703. Epub 2024 Aug 2.

Assessments of prostate cancer cell functions highlight differences between a pan-PI3K/mTOR inhibitor, gedatolisib, and single-node inhibitors of the PI3K/AKT/mTOR pathway

Affiliations

Assessments of prostate cancer cell functions highlight differences between a pan-PI3K/mTOR inhibitor, gedatolisib, and single-node inhibitors of the PI3K/AKT/mTOR pathway

Adrish Sen et al. Mol Oncol. 2025 Jan.

Abstract

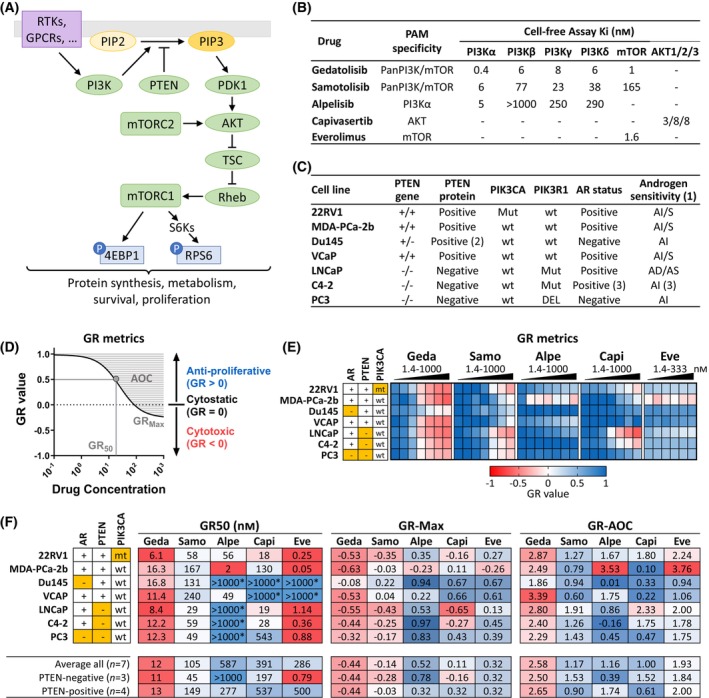
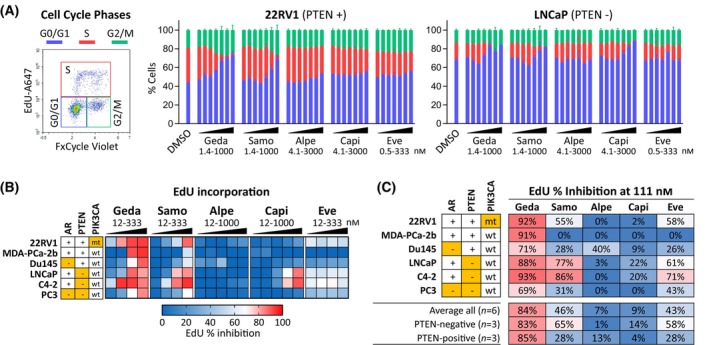
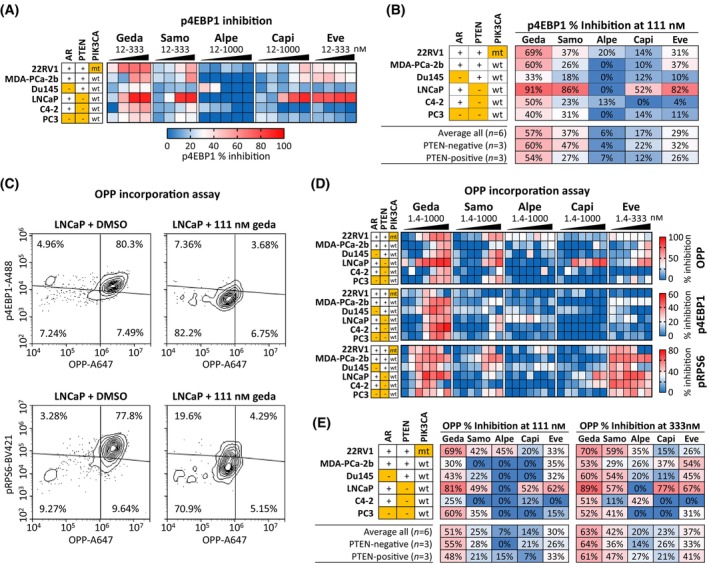
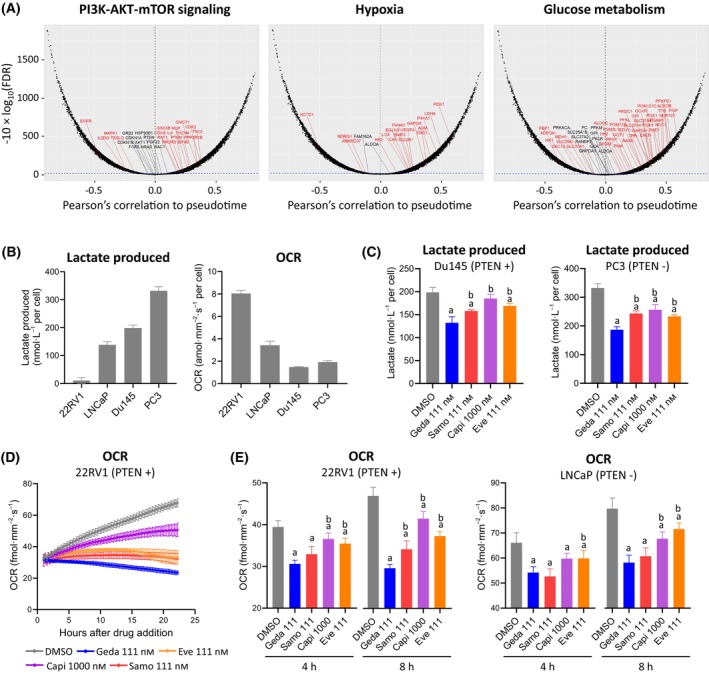
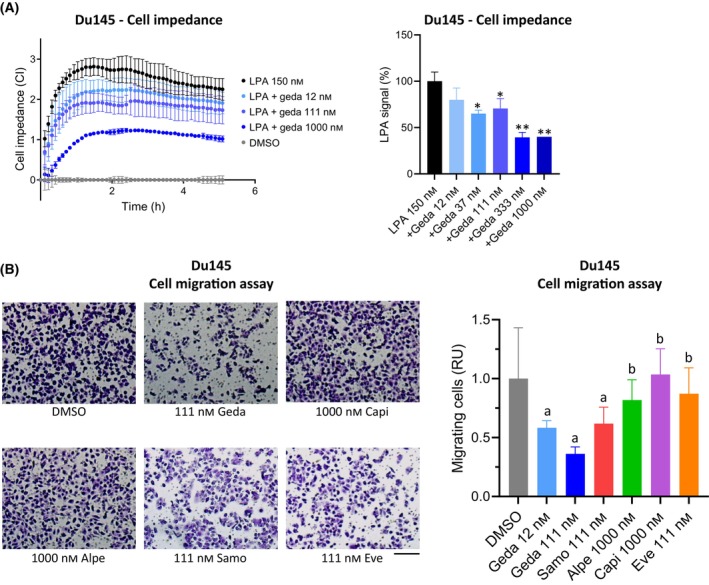
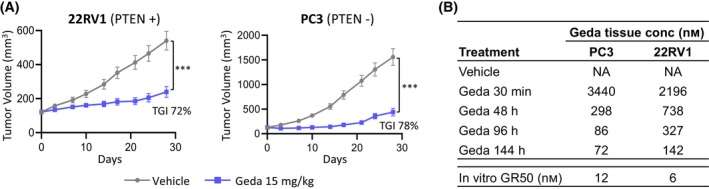
Metastatic castration-resistant prostate cancer (mCRPC) is characterized by loss of androgen receptor (AR) sensitivity and oncogenic activation of the PI3K/AKT/mTOR (PAM) pathway. Loss of the PI3K regulator PTEN is frequent during prostate cancer (PC) initiation, progression, and therapeutic resistance. Co-targeting the PAM/AR pathways is a promising mCRPC treatment strategy but is hampered by reciprocal negative feedback inhibition or feedback relief. Most PAM inhibitors selectively spare (or weakly inhibit) one or more key nodes of the PAM pathway, potentiating drug resistance depending on the PAM pathway mutation status of patients. We posited that gedatolisib, a uniformly potent inhibitor of all class I PI3K isoforms, as well as mTORC1 and mTORC2, would be more effective than inhibitors targeting single PAM pathway nodes in PC cells. Using a combination of functional and metabolic assays, we evaluated a panel of PC cell lines with different PTEN/PIK3CA status for their sensitivity to multi-node PAM inhibitors (PI3K/mTOR: gedatolisib, samotolisib) and single-node PAM inhibitors (PI3Kα: alpelisib; AKT: capivasertib; mTOR: everolimus). Gedatolisib induced anti-proliferative and cytotoxic effects with greater potency and efficacy relative to the other PAM inhibitors, independent of PTEN/PIK3CA status. The superior effects of gedatolisib were likely associated with more effective inhibition of critical PAM-controlled cell functions, including cell cycle, survival, protein synthesis, oxygen consumption rate, and glycolysis. Our results indicate that potent and simultaneous blockade of all class I PI3K isoforms, mTORC1, and mTORC2 could circumvent PTEN-dependent resistance. Gedatolisib, as a single agent and in combination with other therapies, reported promising preliminary efficacy and safety in various solid tumor types. Gedatolisib is currently being evaluated in a Phase 1/2 clinical trial in combination with darolutamide in patients with mCRPC previously treated with an AR inhibitor, and in a Phase 3 clinical trial in combination with palbociclib and fulvestrant in patients with HR+/HER2- advanced breast cancer.

Keywords: PI3K/AKT/mTOR pathway; gedatolisib; inhibitors; prostate cancer.


Conflict of interest statement

AS, SK, SR, AB, IM, AD, JM, LD, CI, MS, RK, SS and LL are all employed by and/or have ownership interest in Celcuity, Inc.

Figures

Fig. 1
Fig. 1
Analysis of PI3K/AKT/mTOR (PAM) inhibitors response in prostate cancer (PC) cell lines using growth rate (GR) metrics. (A) Simplified scheme of the PAM pathway. (B) Gedatolisib, samotolisib, alpelisib, capivasertib, and everolimus target PAM pathway nodes with different specificity and affinity [17, 39, 50, 82, 83]. (C) PC cells lines used in this study. (1) AD , androgen‐dependent (require androgens to grow), AI, androgen independent (do not require androgens to grow), AI/S, androgen independent/androgen responsive (do not require androgens to grow, but show a growth response in their presence) [30]; (2) Heterozygous PTEN; (3) Androgen receptor (AR) expression lower than parental LNCaP [31]; (D) GR metrics are used to assess drugs anti‐proliferative effects (GR value = 0–1), cytotoxic effects (GR < 0), potency (GR50), and efficacy (GRMax). Efficacy and potency can also be assessed by GRAOC (area over the curve). Lower GR50 indicates higher potency; higher negative GRMax indicates higher efficacy; higher GRAOC indicates higher potency and efficacy. (E) Heatmap showing average GR values (n = 2) in seven PC cell lines treated for 72 h with increasing PAM inhibitors concentrations. See Table S3 for data. (F) Summary of PAM inhibitors GR50, GRMax and GRAOC in the PC cell lines tested. Average values in PTEN‐positive and PTEN‐negative subpopulations are shown. *Max concentration tested, GR50 not reached. The results in (E, F) are representative of two separate experiments. Orange cells = AR‐negative, PTEN‐negative, or PIK3CA‐mutant (mt). 4EBP1, eukaryotic translation initiation factor 4E‐binding protein 1; alpe, alpelisib; AOC, area over the curve; capi, capivasertib; eve, everolimus; geda, gedatolisib; GPCR, G protein‐coupled receptor; mTORC1, mTOR complex 1; mTORC2, mTOR complex 2; P, phosphorylation; PDK1, 3‐phosphoinositide‐dependent protein kinase‐1; PI3K, phosphatidylinositol 3‐kinase; PIP2, phosphatidylinositol (4,5)‐bisphosphate; PIP3, phosphatidylinositol (3,4,5)‐trisphosphate; Rheb, Ras homolog, mTORC1 binding; RPS6, ribosomal protein S6; RTKs, receptor tyrosine kinases; S6K, S6 kinase; samo, samotolisib; TSC, tuberous sclerosis complex.
Fig. 2
Fig. 2
Effects of PI3K/AKT/mTOR (PAM) inhibitors on cell cycle and DNA replication. (A) Flow cytometric analysis of the cell cycle phases by EdU incorporation and FxCycle staining in 22RV1 and LNCaP cell lines treated with PAM inhibitors for 48 h. Data represent mean ± SD (n = 2). See Table S4 for data. (B) Heatmap showing average inhibition of EdU incorporation (n = 2) in six PC cell lines treated with PAM inhibitors at increasing concentrations for 48 h. See Table S5 for data. (C) Comparison of PAM inhibitors efficacy in inhibiting EdU incorporation at 111 nm. The results are representative of three separate experiments. Orange cells = AR‐negative, PTEN‐negative, or PIK3CA‐mutant (mt). A647, Alexa Fluor 647; alpe, alpelisib; capi, capivasertib; EdU, 5‐ethynyl‐2′‐deoxyuridine; eve, everolimus; geda, gedatolisib; samo, samotolisib.
Fig. 3
Fig. 3
Effects of PI3K/AKT/mTOR (PAM) inhibitors on cell death and apoptosis. (A) Flow cytometric analysis of cell death (Zombie staining) and apoptosis (cleaved caspase 3) in 22RV1 and LNCaP cell lines treated with PAM inhibitors for 48 h. Data represent mean ± SD (n = 2). See Table S6 for data. (B) Heatmap showing induction of death by Zombie staining in six PC cell lines treated with PAM inhibitors at increasing concentrations for 48 h. Data represent % dead cells (Zombie+) over DMSO‐treated cells (average of 2 biological replicates). See Table S7 for data. (C) Comparison of PAM inhibitors efficacy in inducing cell death at 111 nm. The results in A–C are representative of three separate experiments. (D) Analysis of cell death (Zombie staining) in PC cell lines treated with PAM inhibitors for either 72 h or 24 h followed by washout and incubation with drug‐free medium for 48 h. Data represent mean ± SD (n = 2); a = P < 0.05 vs DMSO, b = P < 0.05 vs gedatolisib; one‐way ANOVA Fisher's test. Orange cells = AR‐negative, PTEN‐negative, or PIK3CA‐mutant (mt). alpe, alpelisib; capi, capivasertib; clCasp3, cleaved caspase 3; eve, everolimus; geda, gedatolisib; samo, samotolisib.
Fig. 4
Fig. 4
Effects of PI3K/AKT/mTOR (PAM) inhibitors on PAM pathway activity and protein synthesis. (A) Heatmap showing average inhibition (n = 2) of p4EBP1 level after 48 h treatment with increasing PAM inhibitors concentrations in six prostate cancer (PC) cell lines. The % inhibition was calculated from median fluorescence and is relative to DMSO‐treated cells. See Table S8 for data. (B) Comparison of PAM inhibitors efficacy in reducing p4EBP1 levels at 111 nm concentration. The results in A and B are representative of one out of three separate experiments. (C) Example of multiplex flow cytometric analysis of OPP incorporation, p4EBP1, and pRPS6 in LNCaP cells treated with 111 nm gedatolisib or DMSO control for 24 h. (D) Heatmap showing average inhibition (n = 2) of OPP incorporation, p4EBP1, and pRPS6 in six PC cell lines treated with increasing PAM inhibitors concentrations for 24 h. The % inhibition was calculated from median fluorescence intensity and is relative to DMSO‐treated cells. The values shown in the heatmap represent the average of 2 biological replicates. See Table S9 for data. (E) Comparison of PAM inhibitors efficacy in inhibiting OPP incorporation at 111 nm. Orange cells = AR‐negative, PTEN‐negative, or PIK3CA‐mutant (mt). A 647, Alexa Fluor 647; A488, Alexa Fluor 488; Alpe, alpelisib; BV421, Brilliant Violet 421; capi, capivasertib; eve, everolimus; geda, gedatolisib; OPP, O‐propargyl‐puromycin; samo, samotolisib.
Fig. 5
Fig. 5
Effects of PI3K/AKT/mTOR (PAM) PAM inhibitors on metabolic functions. (A) Temporal transcript‐mapping plots representing the correlation between mRNA expression and prostate cancer (PC) clinical disease stage. X‐axis: Pearson's correlation coefficient (PCC) between pseudotime and mRNA expression; Y‐axis: the associated significance between mRNA expression and PC disease progression, adjusted for false discovery rate (FDR), and expressed in the form of −10 × log10(FDR) [36]. Transcripts in red are significantly correlated with disease progression (FDR q‐value < 0.05). The dashed blue line indicates the cutoff for significance (see Section 2 for details and Table S10 for gene lists). (B) Analysis of lactate levels in conditioned culture medium (24 h culture) and oxygen consumption rates (OCR, 24 h culture) showing that PC cell lines are characterized by different metabolic states. (C) Analysis of lactate levels in conditioned medium of Du145 and PC3 cells treated with PAM inhibitors for 24 h. See Table S11 for data. (D) Example of real‐time OCR Resipher analysis in 22RV1 cells treated with PAM inhibitors for 24 h. Data represent mean ± SD (n = 3). (E) OCR analysis in 22RV1 and LNCaP cells treated with PAM inhibitors for 4–8 h. Data in B, C and E represent mean ± SD (n = 3); a = P < 0.05 vs DMSO, b = P < 0.05 vs 111 nm gedatolisib; one‐way ANOVA Fisher's test. See Table S13 for data. Alpe, alpelisib; capi, capivasertib; eve, everolimus; geda, gedatolisib; samo, samotolisib.
Fig. 6
Fig. 6
Effects of PI3K/AKT/mTOR (PAM) inhibitors on cell migration. (A) xCELLigence analysis showing that lysophosphatidic acid (LPA)‐induced impedance is inhibited by gedatolisib in Du145 cells. Data represent the mean ± SD (n = 2). *P < 0.05, **P < 0.01 versus LPA (no gedatolisib). (B) Transwell assay showing inhibition of cell migration in response to PAM inhibitors treatment for 24 h. Scale bar = 200 μm. Data represent mean ± SD (n = 4) and are representative of two separate experiments; a = P < 0.05 vs DMSO, b = P < 0.05 vs geda 111 nm; one‐way ANOVA Fisher's test. See Table S14 for data. Alpe, alpelisib; capi, capivasertib; eve, everolimus; geda, gedatolisib; samo, samotolisib; RU, relative units.
Fig. 7
Fig. 7
Gedatolisib in vivo efficacy in prostate cancer (PC) xenograft models. (A) Growth curves of 22RV1 and PC3 xenograft tumors after treatment with vehicle or gedatolisib (15 mg·kg−1, iv, Q4D; BALB/c nude castrated mice, 10 mice/arm). Data represent mean ± SEM. ***P < 0.001, one‐way ANOVA. The individual tumor weights are shown in Table S15 (22RV1) and Table S16 (PC3). (B) Pharmacokinetic analysis of gedatolisib concentration in xenograft tissue samples at different time points after the last gedatolisib dose (day 28). Data represent the mean of two independent tumor samples. Geda, gedatolisib; NA, not applicable.

Similar articles

Cited by

References

    1. Pungsrinont T, Kallenbach J, Baniahmad A. Role of PI3K‐AKT‐mTOR pathway as a pro‐survival signaling and resistance‐mediating mechanism to therapy of prostate cancer. Int J Mol Sci. 2021;22:11088. - PMC - PubMed
    1. Raith F, O'Donovan DH, Lemos C, Politz O, Haendler B. Addressing the reciprocal crosstalk between the AR and the PI3K/AKT/mTOR signaling pathways for prostate cancer treatment. Int J Mol Sci. 2023;24:2289. - PMC - PubMed
    1. Glaviano A, Foo ASC, Lam HY, Yap KCH, Jacot W, Jones RH, et al. PI3K/AKT/mTOR signaling transduction pathway and targeted therapies in cancer. Mol Cancer. 2023;22:138. - PMC - PubMed
    1. Manning BD, Toker A. AKT/PKB signaling: navigating the network. Cell. 2017;169:381–405. - PMC - PubMed
    1. Saxton RA, Sabatini DM. mTOR signaling in growth, metabolism, and disease. Cell. 2017;168:960–976. - PMC - PubMed

MeSH terms