

Alterations in Gray Matter Structural Networks in Amnestic Mild Cognitive Impairment: A Source-Based Morphometry Study
- PMID: 39093069
- PMCID: PMC11380280
- DOI: 10.3233/JAD-231196
Alterations in Gray Matter Structural Networks in Amnestic Mild Cognitive Impairment: A Source-Based Morphometry Study
Abstract
Background: Amnestic mild cognitive impairment (aMCI), considered as the prodromal stage of Alzheimer's disease, is characterized by isolated memory impairment and cerebral gray matter volume (GMV) alterations. Previous structural MRI studies in aMCI have been mainly based on univariate statistics using voxel-based morphometry.
Objective: We investigated structural network differences between aMCI patients and cognitively normal older adults by using source-based morphometry, a multivariate approach that considers the relationship between voxels of various parts of the brain.
Methods: Ninety-one aMCI patients and 80 cognitively normal controls underwent structural MRI and neuropsychological assessment. Spatially independent components (ICs) that covaried between participants were estimated and a multivariate analysis of covariance was performed with ICs as dependent variables, diagnosis as independent variable, and age, sex, education level, and site as covariates.
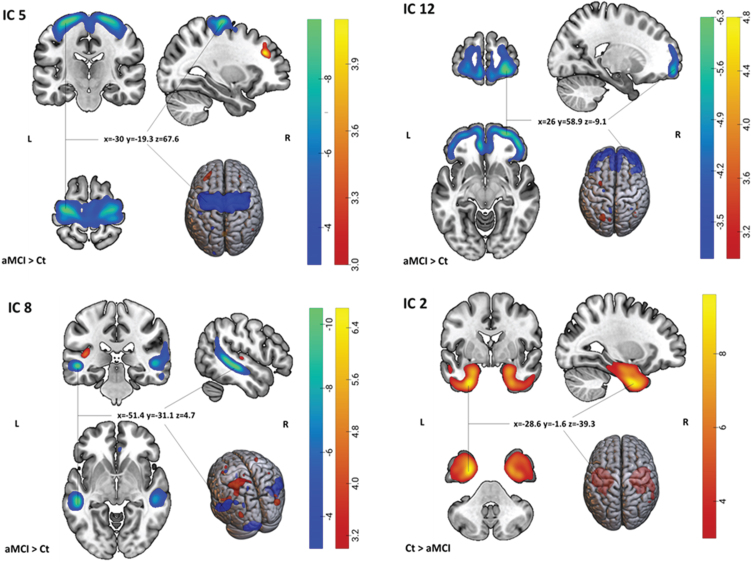
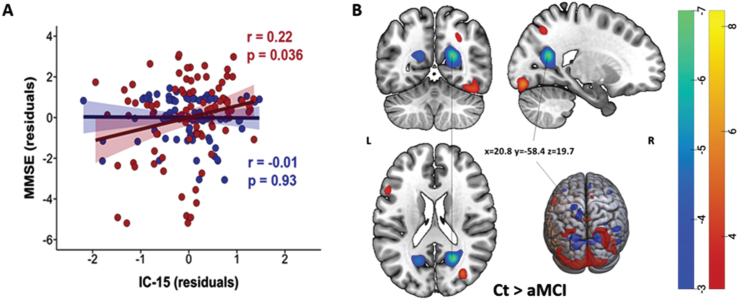
Results: aMCI patients exhibited reduced GMV in the precentral, temporo-cerebellar, frontal, and temporal network, and increased GMV in the left superior parietal network compared to controls (pFWER < 0.05, Holm-Bonferroni correction). Moreover, we found that diagnosis, more specifically aMCI, moderated the positive relationship between occipital network and Mini-Mental State Examination scores (pFWER < 0.05, Holm-Bonferroni correction).
Conclusions: Our results showed GMV alterations in temporo-fronto-parieto-cerebellar networks in aMCI, extending previous results obtained with univariate approaches.
Keywords: Alzheimer’s disease; amnestic mild cognitive impairment; magnetic resonance imaging; source-based morphometry; structural network.
Conflict of interest statement
The authors have no conflicts of interest to declare.
Figures
References
-
- Albert MS, DeKosky ST, Dickson D, et al. The diagnosis of mild cognitive impairment due to Alzheimer’s disease: Recommendations from the National Institute on Aging-Alzheimer’s Association workgroups on diagnostic guidelines for Alzheimer’s disease. Alzheimers Dement 2011; 7: 270–279. - PMC - PubMed
-
- Petersen RC. Mild cognitive impairment as a diagnostic entity. J Intern Med 2004; 256: 183–194. - PubMed
-
- Petersen RC, Smith GE, Waring SC, et al. Mild cognitive impairment. Arch Neurol 1999; 56: 303. - PubMed
-
- Gauthier S, Reisberg B, Zaudig M, et al. Mild cognitive impairment. Lancet 2006; 367: 1262–1270. - PubMed
MeSH terms
LinkOut - more resources
Full Text Sources
Medical
