. 2024;100(4):1261-1287.
doi: 10.3233/JAD-240301.

Identification of Blood Biomarkers Related to Energy Metabolism and Construction of Diagnostic Prediction Model Based on Three Independent Alzheimer's Disease Cohorts

Affiliations

Identification of Blood Biomarkers Related to Energy Metabolism and Construction of Diagnostic Prediction Model Based on Three Independent Alzheimer's Disease Cohorts

Hongqi Wang et al. J Alzheimers Dis. 2024.

Abstract

Background: Blood biomarkers are crucial for the diagnosis and therapy of Alzheimer's disease (AD). Energy metabolism disturbances are closely related to AD. However, research on blood biomarkers related to energy metabolism is still insufficient.

Objective: This study aims to explore the diagnostic and therapeutic significance of energy metabolism-related genes in AD.

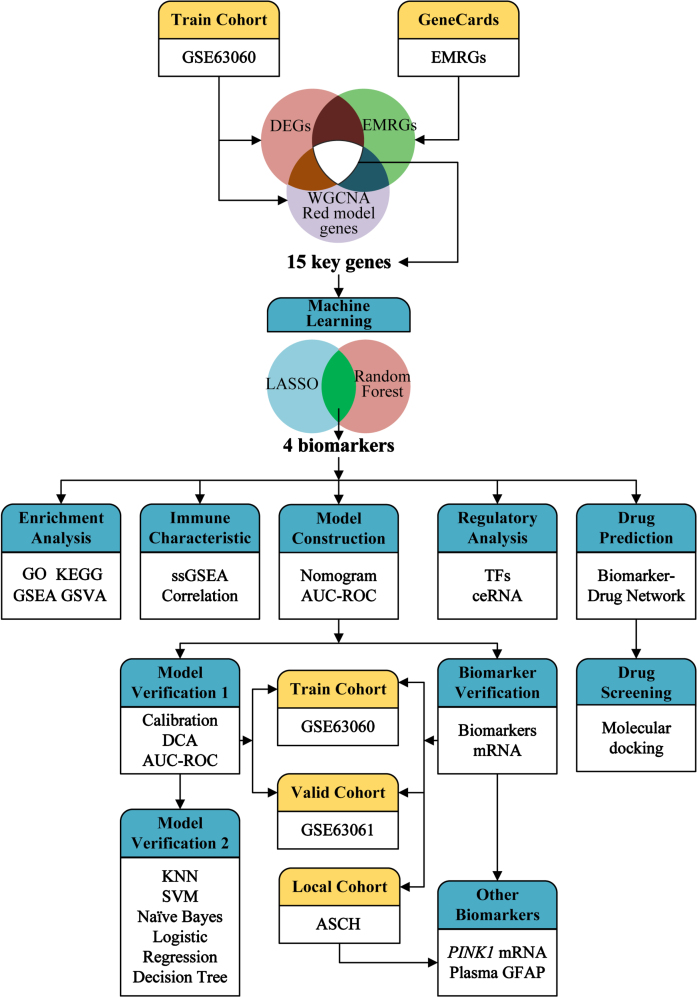
Methods: AD cohorts were obtained from GEO database and single center. Machine learning algorithms were used to identify key genes. GSEA was used for functional analysis. Six algorithms were utilized to establish and evaluate diagnostic models. Key gene-related drugs were screened through network pharmacology.

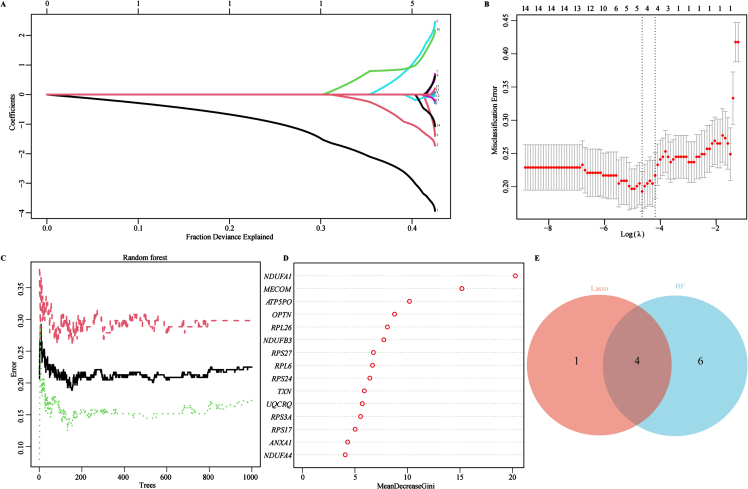
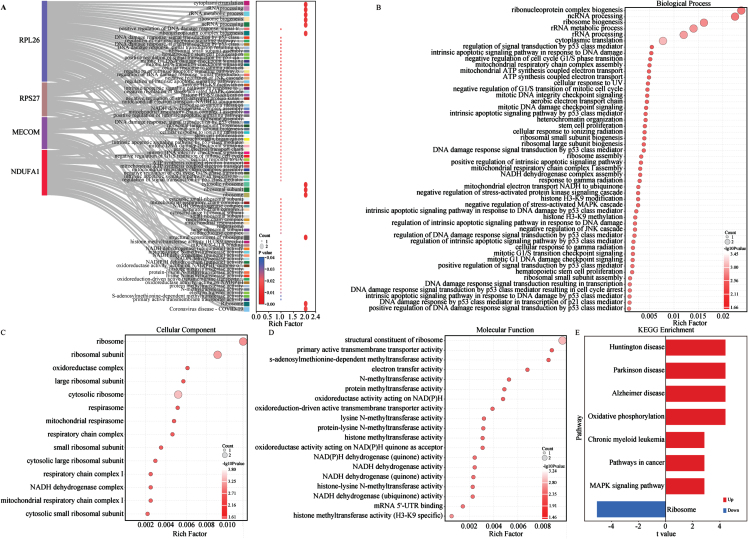
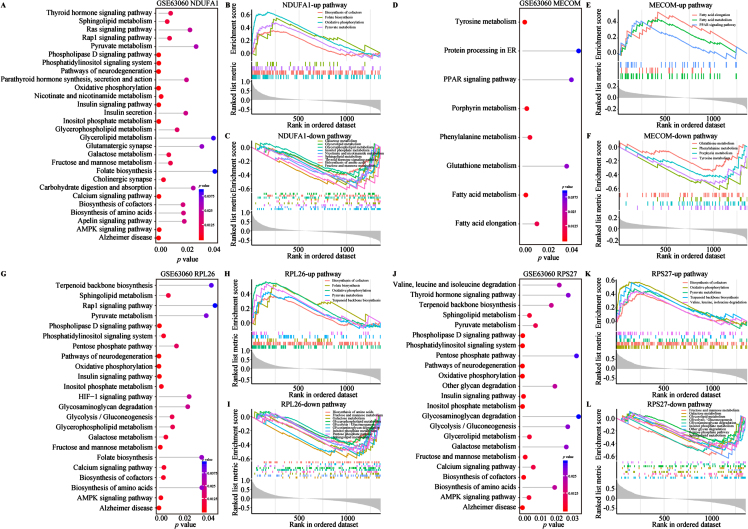
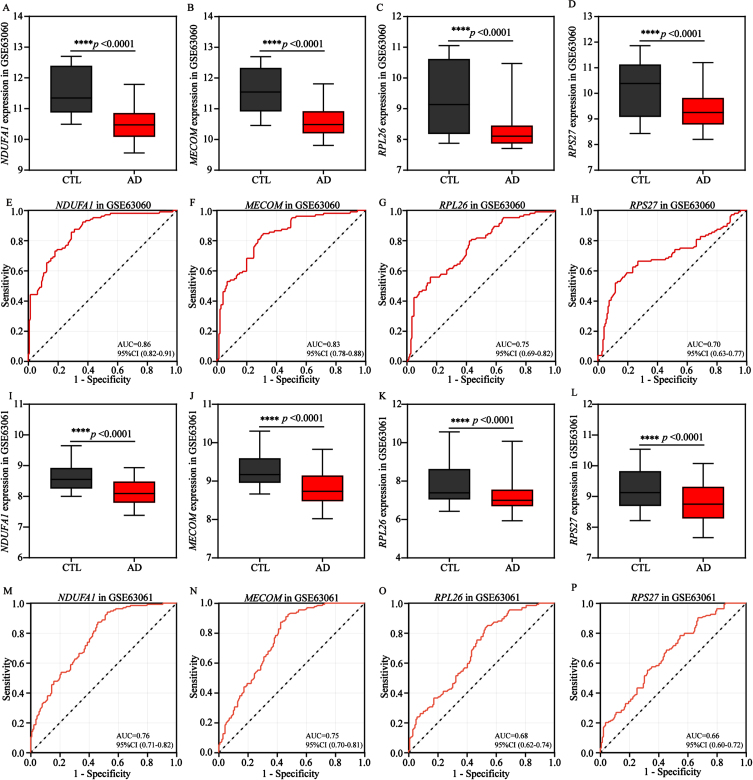
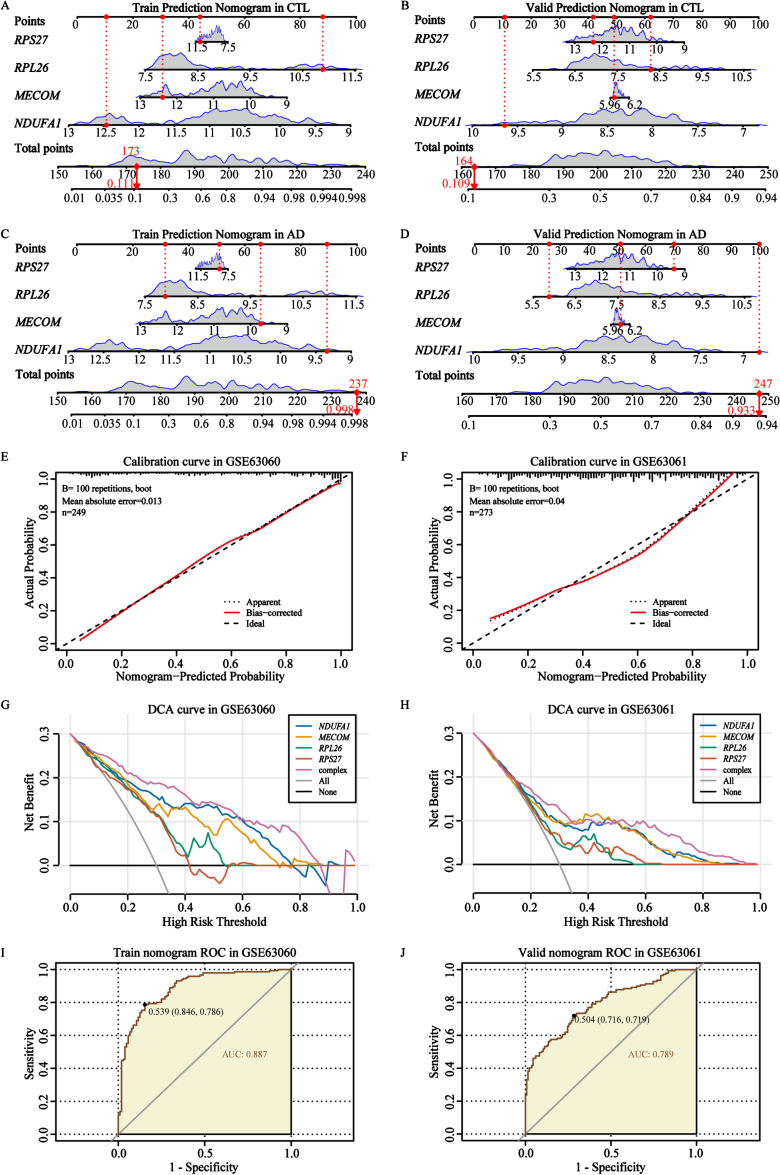
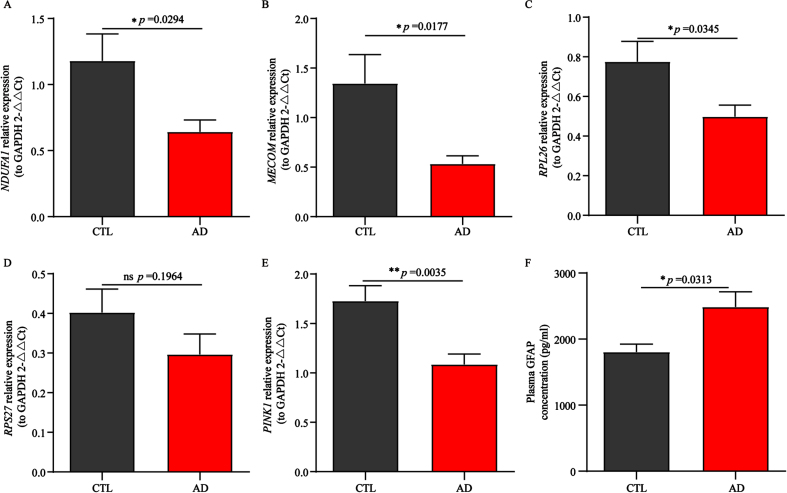
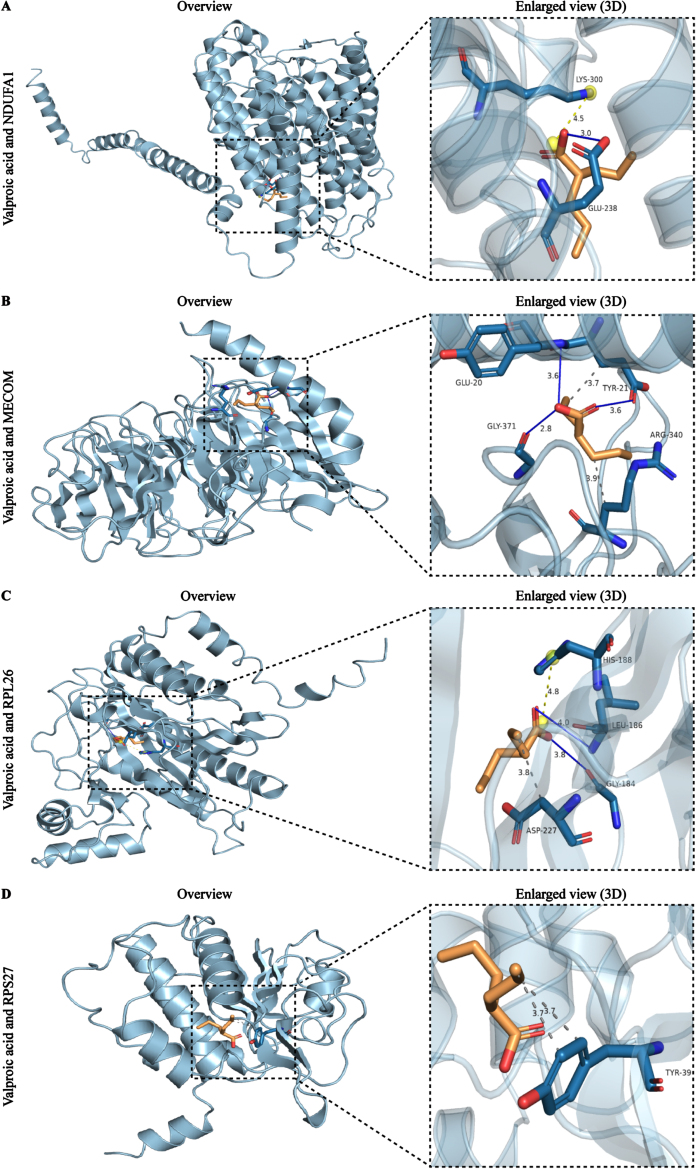
Results: We identified 4 energy metabolism genes, NDUFA1, MECOM, RPL26, and RPS27. These genes have been confirmed to be closely related to multiple energy metabolic pathways and different types of T cell immune infiltration. Additionally, the transcription factors INSM2 and 4 lncRNAs were involved in regulating 4 genes. Further analysis showed that all biomarkers were downregulated in the AD cohorts and not affected by aging and gender. More importantly, we constructed a diagnostic prediction model of 4 biomarkers, which has been validated by various algorithms for its diagnostic performance. Furthermore, we found that valproic acid mainly interacted with these biomarkers through hydrogen bonding, salt bonding, and hydrophobic interaction.

Conclusions: We constructed a predictive model based on 4 energy metabolism genes, which may be helpful for the diagnosis of AD. The 4 validated genes could serve as promising blood biomarkers for AD. Their interaction with valproic acid may play a crucial role in the therapy of AD.

Keywords: Alzheimer’s disease; diagnostic biomarkers; drug prediction; energy metabolism; machine learning.


Conflict of interest statement

The authors have no conflict of interest to report.

Figures

Fig. 1
Fig. 1
Overview of the study design and framework analysis.
Fig. 2
Fig. 2
Identification of DEGs between AD and control samples. A) Volcanic map of DEGs determined in the training cohort GSE63060. B) Heatmap of DEGs in the training cohort GSE63060. Red for upregulation, blue for downregulation.
Fig. 3
Fig. 3
Identifying and screening key genes using the WGCNA algorithm. A) The scale-free fitting index of the soft threshold in the weighted gene co-expression network. B) The mean connectivity of soft threshold power in the weighted gene co-expression network. C) Tree diagram of gene-model clustering with all samples in the training cohort GSE63060. D) Correlation heatmap between different modules in the control and AD. Red: positive correlation; light green: negative correlation. E) Clustered heatmap of different color modules. Red: further distance; blue: nearer distance. F) Scatter plot of characteristic genes in the red module. G) Identification of key genes in a Venn diagram, overlapping with DEGs, EMRGs, and genes in red model. Correlations were carried out with Spearman’s correlation method.
Fig. 4
Fig. 4
Identifying AD Biomarkers using LASSO and RF. A) Screening for potential biomarkers using the LASSO regression algorithm. The 5 potential biomarkers were identified within the regression coefficient path map. B) The 10-cross validation curve of the LASSO logistic regression algorithm. All 5 potential biomarkers were validated as the lowest point of the regression curve. C) The error trees shown by the random survival forests algorithm for selecting the top 10 potential biomarkers in AD. D) The RF algorithm presenting the MeanDecreaseGini of the 15 key genes in AD. E) Venn diagram showing the diagnostic biomarkers intersected by LASSO and RF.
Fig. 5
Fig. 5
Enrichment analysis of biomarkers. A) All GO enrichment of biomarkers. B) GO-BP enrichment analysis of biomarkers. C) GO-CC enrichment analysis of biomarkers. D) GO-MF enrichment analysis of biomarkers. The horizontal axis represents the rich factor; the circle size represents the gene counts in each GO term; the color indicates the p value. E) KEGG enrichment pathways of biomarkers via GSVA analysis. GSVA score was presented as t value in the horizontal axis. GO, gene ontology; KEGG, Kyoto Encyclopedia of Genes and Genomes; BP, biological processes; MF, molecular functions; CC, cellular components; GSVA, gene set variation analysis.
Fig. 6
Fig. 6
Metabolism and energy metabolism pathways of 4 biomarkers in the GSE63060 cohort. A-L) Single gene GSVA analysis based on KEGG pathway enrichment of NDUFA1, MECOM, RPL26, and RPS27. Lollipop plots of 4 biomarkers KEGG pathway enrichment results in the left of each panel. The horizontal and the color indicate the p value. GSEA plots in the right of each panel show the metabolism and energy metabolism related pathways with different colors for 4 biomarkers. All presented pathways were significantly enriched. Statistical significance was p < 0.05.
Fig. 7
Fig. 7
Validation and exploration the diagnostic value of AD biomarkers in European cohorts. A-D) Differential expression boxplots of NDUFA1, MECOM, RPL26, and RPS27 in the training cohort GSE63060. E-H) The ROC curves of NDUFA1, MECOM, RPL26, and RPS27 in the training cohort GSE63060 for diagnostic value exploration. I-L) Differential expression boxplots of NDUFA1, MECOM, RPL26, and RPS27 in the validation cohort GSE63061. M-P) The ROC curves of NDUFA1, MECOM, RPL26, and RPS27 in the validation cohort GSE63061 for diagnostic value exploration. Box plots represent the median, 25th and 75th percentiles and whiskers represent the 5th and 95th percentiles. Statistical comparisons were carried out with t test (A-D, n = 104 in the control group, n = 145 in the AD group; I-L, n = 134 in the control group, n = 139 in the AD group; ****p < 0.0001 vs. the control group). CTL, control; AD, Alzheimer’s disease.
Fig. 8
Fig. 8
Construction and verification of the AD biomarker nomogram. A, B) The nomogram was constructed based on the AD biomarkers to predict normal controls in the training cohort GSE63060 and validation cohort GSE63061. C, D) The nomogram was constructed based on the AD biomarkers to predict and diagnose AD in the training cohort GSE63060 and validation cohort GSE63061. E, F) The calibration curve of the nomogram prediction in AD patients in the training cohort GSE63060 and validation cohort GSE63061. G, H) DCA curves for the nomogram and 4 biomarkers in the training cohort GSE63060 and validation cohort GSE63061. I, J) The ROC curves for the predictive performance of the nomogram in the training cohort GSE63060 and validation cohort GSE63061.
Fig. 9
Fig. 9
Validation of potential AD biomarkers in a local Asian cohort. A-E) Relative mRNA expression of NDUFA1, MECOM, RPL26, RPS27, and PINK1 in AD patients and normal controls. F) Difference in the plasma GFAP expression in AD patients and normal controls. CTL, control; AD, Alzheimer’s disease. NS represents no statistical significance. Statistical comparisons were carried out with t-test (A-D, n = 8 per group; E, n = 9 per group; F, n = 5 per group, *p < 0.05, **p < 0.01 vs. the control group). The results are presented as the mean±standard error of the mean (SEM).
Fig. 10
Fig. 10
Molecular docking results of the valproic acid with each target biomarker proteins. A) Valproic acid and NDUFA1. B) Valproic acid and MECOM. C) Valproic acid and RPL26. D) Valproic acid and RPS27. All left panels are displaying the 3D structures of the combined valproic acid-biomarker complexes. Detailed and enlarged binding sites for the valproic acid-biomarker proteins are listed in the right panels, with interactions between amino acid residues and functional groups. Blue solid lines represent the hydrogen-bond interactions, while light yellow and grey dotted lines represent alkyl interactions and hydrophobic interactions, respectively.

Similar articles

Cited by

References

    1. 2023 Alzheimer’s disease facts and figures. Alzheimers Dement 2023; 19: 1598–1695. - PubMed
    1. Damsgaard L, Janbek J, Laursen TM, et al. Mapping morbidity 10 years prior to a diagnosis of young onset Alzheimer’s disease. Alzheimers Dement 2024; 20: 2373–2383. - PMC - PubMed
    1. Rabinovici GD, Carrillo MC, Apgar C, et al. Amyloid positron emission tomography and subsequent health care use among Medicare beneficiaries with mild cognitive impairment or dementia. JAMA Neurol 2023; 80: 1166–1173. - PMC - PubMed
    1. Algeciras-Schimnich AandBornhorst JA. Importance of cerebrospinal fluid (CSF) collection protocol for the accurate diagnosis of Alzheimer’s disease when using CSF biomarkers. Alzheimers Dement 2024; 20: 3657–3658. - PMC - PubMed
    1. Schindler SE, Bollinger JG, Ovod V, et al. High-precision plasma beta-amyloid 42/40 predicts current and future brain amyloidosis. Neurology 2019; 93: e1647–e1659. - PMC - PubMed

LinkOut - more resources