. 2024 Aug 1;65(10):5.
doi: 10.1167/iovs.65.10.5.

Iron Chelator Deferiprone Restores Iron Homeostasis and Inhibits Retinal Neovascularization in Experimental Neovascular Age-Related Macular Degeneration

Affiliations

Iron Chelator Deferiprone Restores Iron Homeostasis and Inhibits Retinal Neovascularization in Experimental Neovascular Age-Related Macular Degeneration

Yuan Xu et al. Invest Ophthalmol Vis Sci. .

Abstract

Purpose: Retinal neovascularization is a significant feature of advanced age-related macular degeneration (AMD) and a major cause of blindness in patients with AMD. However, the underlying mechanism of this pathological neovascularization remains unknown. Iron metabolism has been implicated in various biological processes. This study was conducted to investigate the effects of iron metabolism on retinal neovascularization in neovascular AMD (nAMD).

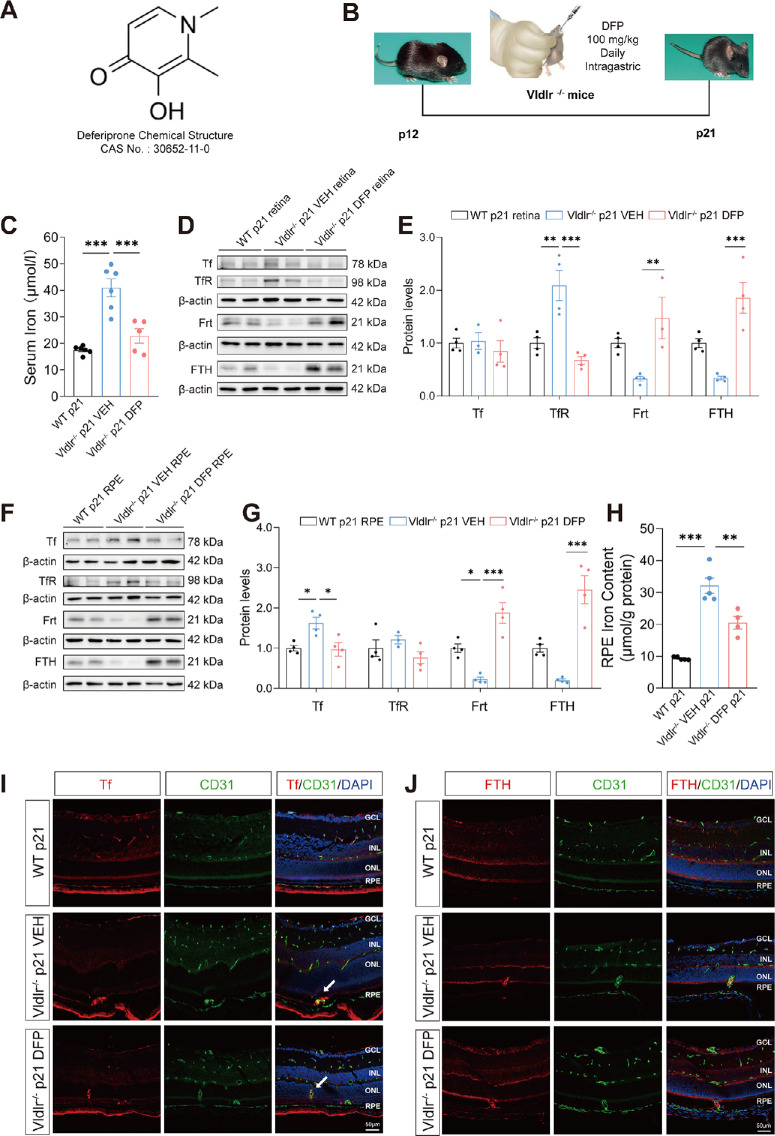
Methods: C57BL/6J and very low-density lipoprotein receptor (VLDLR) knockout (Vldlr-/-) mice, a murine model of nAMD, were used in this study. Bulk-RNA sequencing was used to identify differentially expressed genes. Western blot analysis was performed to test the expression of proteins. Iron chelator deferiprone (DFP) was administrated to the mice by oral gavage. Fundus fluorescein angiography was used to evaluate retinal vascular leakage. Immunofluorescence staining was used to detect macrophages and iron-related proteins.

Results: RNA sequencing (RNA-seq) results showed altered transferrin expression in the retina and RPE of Vldlr-/- mice. Disrupted iron homeostasis was observed in the retina and RPE of Vldlr-/- mice. DFP mitigated iron overload and significantly reduced retinal neovascularization and vascular leakage. In addition, DFP suppressed the inflammation in Vldlr-/- retinas. The reduced signals of macrophages were observed at sites of neovascularization in the retina and RPE of Vldlr-/- mice after DFP treatment. Further, the IL-6/JAK2/STAT3 signaling pathway was activated in the retina and RPE of Vldlr-/- mice and reversed by DFP treatment.

Conclusions: Disrupted iron metabolism may contribute to retinal neovascularization in nAMD. Restoring iron homeostasis by DFP could be a potential therapeutic approach for nAMD.


Conflict of interest statement

Disclosure: Y. Xu, None; S. Huang, None; S. Zhou, None; X. Wang, None; M. Wei, None; X. Chen, None; R. Zong, None; X. Lin, None; S. Li, None; Z. Liu, None; Q. Chen, None

Figures

Figure 1.
Figure 1.
Disrupted iron homeostasis in both the retina and RPE of Vldlr−/− mice at p12. (A, B) Volcano plots revealed the fold change and significance levels of DEGs in the retina (A) and RPE (B) of WT and Vldlr−/− mice at p12 with FDR < 0.05. The blue and red dots represent down- and upregulated DEGs, respectively, whereas the black dot indicates nonsignificant DEGs. Notably, Trf was found to be significantly downregulated in both retina and RPE. (C, D) The Bar chart displayed the log2 fold change in mRNA expression levels of the 10 DEGs that were significantly up- and downregulated in the retina (C, n = 3) and RPE (D, n = 4) of Vldlr−/− mice at p12 compared to those of age-matched WT mice. (E-H) The representative images of Western blot showed the protein levels of Tf, TfR, and Frt (normalized to GAPDH) in the retina (E, F) and RPE (G, H) of WT and Vldlr−/− mice (n = 6) at p12. RPE, retinal pigment epithelium; FDR, false discovery rate; Trf and Tf, transferrin; TfR, transferrin receptor; Frt, ferritin; GAPDH, glyceraldehyde-3-phosphate dehydrogenase. Data are shown as mean ± SEM. *P < 0.05, ***P < 0.001. Two-tailed Student's t-test was used.
Figure 2.
Figure 2.
Iron homeostasis was altered in the retina, RPE and serum of Vldlr−/− mice at p21. (A–D) Protein levels of Tf, TfR, and Frt were measured by Western blot analysis and normalized to β-actin levels in the retina (A, B) and RPE (C, D) of WT and Vldlr−/− mice (n = 4-6) at p21. (E) Serum iron levels of WT and Vldlr−/− mice at p21 (n = 4-6) were measured. (F) Representative images of immunofluorescence staining for Tf (red) in the retinal sections of WT and Vldlr−/− mice at p21. An arrow pointed out that Tf was located in the retinal neovascularization area in Vldlr−/− mice. The nuclei were stained with DAPI (blue). Scale bar = 50 µm. DAPI, 4',6-diamidino-2-phenylindole; GCL, ganglion cell layer; INL, inner nuclear layer; ONL, outer nuclear layer. Data are shown as mean ± SEM. *P < 0.05, **P < 0.01, ***P < 0.001. Two-tailed Student's t-test was used.
Figure 3.
Figure 3.
Iron homeostasis was restored in Vldlr−/− mice after deferiprone (DFP) administration. (A) Chemical structure of DFP, an iron chelator. (B) Schematic diagram of mouse treatment schedule and way of delivery. Vldlr−/− mice were administered with DFP or VEH (saline) by gavage daily from p12 to p21. (C) Iron levels in the serum (n = 5-6) were measured after DFP treatment in Vldlr−/− mice. (D–G) Representative images of Western blot images of Tf, TfR, Frt, and FTH (normalized to β-actin) in the retina (D, E) and RPE (F, G) of Vldlr−/− mice treated with VEH or DFP (n = 3–4). (H) RPE iron content was measured in VEH- and DFP-treated Vldlr−/− mice. (I, J) Immunofluorescence representative images showed the location of Tf (I, red) and FTH (J, red) with CD31 (green), a marker of vascular endothelial cells. The nuclei were stained with DAPI (blue). An arrow pointed out the colocalization of Tf and CD31 in the neovascular area in panel I. Scale bar = 50 µm. DFP, deferiprone; VEH, vehicle; FTH, ferritin heavy chain; CD31, cluster of differentiation 31. Data are shown as mean ± SEM. *P < 0.05, **P < 0.01, ***P < 0.001. One-way ANOVA analysis was used.
Figure 4.
Figure 4.
Anti-angiogenic effects of DFP in Vldlr−/− mice. (A) Retinas from VEH- and DFP-treated Vldlr−/− mice were flat-mounted and stained with isolectin GS-IB4 (red). Scale bar = 500 µm. (B) Quantification of IRN blebs in retinal flat mounts of Vldlr−/− mice treated with VEH or DFP (n = 3) at p21. (C) Higher magnification showed IRN blebs in Vldlr−/− mice treated with VEH or DFP. Scale bar = 50 µm. (D) Representative images of fundus fluorescein angiography in Vldlr−/− mice treated with VEH and DFP. (E) Statistical plot of fundus vascular leakage spots in Vldlr−/− mice treated with VEH (n = 7) and DFP (n = 9). (F) Representative retinal section images of H&E-staining in VEH- and DFP-treated Vldlr−/− mice. Scale bar = 50 µm. IRN, intraretinal neovascular; H&E, hematoxylin and eosin. Data are shown as mean ± SEM. **P < 0.01. One-way ANOVA analysis was used.
Figure 5.
Figure 5.
Anti-inflammatory effects of DFP in the retina of Vldlr−/− mice. (A, B) The representative images of Western blot analysis of GFAP and VEGF (normalized to β-actin) in the retina of Vldlr−/− mice treated with VEH or DFP (n = 4). (C–E) Real-time PCR of IL-1β (C), VCAM-1 (D), and TNF-α (E) mRNA expression (normalized to β-actin) in VEH- and DFP-treated Vldlr−/− retinas (n = 4). GFAP, glial fibrillary acidic protein; VEGF, vascular endothelial growth factor; IL-1β, interleukin-1β; VCAM-1, vascular cell adhesion molecule-1; TNF-α, tumor necrosis factor-α. Data are shown as mean ± SEM. *P < 0.05, **P < 0.01, ***P < 0.001. One-way ANOVA analysis and two-tailed Student's t-test were used.
Figure 6.
Figure 6.
Decreased F4/80+ macrophage infiltration in the retinal neovascular area of Vldlr−/− mice treated with DFP. (A) Representative images of immunofluorescence staining for F4/80 (red), Tf (green), and DAPI (blue) in the retina sections of Vldlr−/− mice treated with VEH or DFP. Scale bar = 50 µm. (B) Pixel intensity of F4/80 immunohistochemistry was quantified in retinal sections of the VEH- and DFP-treated Vldlr−/− mice (n = 3–4) at p21. (C) Representative images of isolectin (red) and F4/80 (green) immunostaining in RPE/choroid complex flat mounts from Vldlr−/− mice treated with VEH and DFP. Cell nuclei were stained with DAPI (blue). Scale bar = 50 µm. (D) Percentage of pixels of F4/80+ isolectin+ area to total isolectin+ area in subretinal neovascular lesions of VEH- and DFP-treated Vldlr−/− mice (n = 6) at p21. (E) Real-time PCR of ADGRE1 mRNA expression (normalized to β-actin) in VEH- and DFP-treated Vldlr−/− retinas (n = 4). ADGRE1, adhesion G protein-coupled receptor E1. Data are shown as mean ± SEM. *P < 0.05, **P < 0.01, ***P < 0.001. One-way ANOVA analysis and two-tailed Student's t-test were used.
Figure 7.
Figure 7.
The suppression of IL6/JAK2/STAT3 signaling in the retina and RPE of Vldlr−/− mice after DFP treatment. (A, B) RNA-Seq analysis revealed the DEGs in both the RPE (A) and the retina (B) of WT and Vldlr−/− mice at p21 (n = 3). (C) KEGG enrichment pathways of DEGs in RPE of Vldlr−/− mice compared with WT showed that 20 pathways were significantly enriched. Low q-values are in red, and high q-values are in blue; the size of the circle is proportional to the number of enriched genes. (D) Protein-protein interaction (PPI) networks of DEGs involved in the top 9 KEGG enrichment pathways in the retina of WT and Vldlr−/− mice at p21. Inflammatory and iron-related factors are marked. (E–H) Representative images and quantifications of Western blot analysis of protein levels of IL-6, p-STAT3, and STAT3 (normalized to β-actin) in the retina (E, F), and p-JAK2, JAK2, p-STAT3, STAT3 (normalized to β-actin) in the RPE (G, H) of Vldlr−/− mice treated with VEH or DFP (n = 4). KEGG, Kyoto encyclopedia of genes and genomes; VEGFA, vascular endothelial growth factor A; Tfrc, transferrin receptor; JAK3, Janus kinase 3; STAT3, signal transducer and activator of transcription 3; Cav1, caveolin-1; IL-6, interleukin-6; p-STAT3, phosphorylated-STAT3; JAK2, Janus kinase 2; p-JAK2, phosphorylated-JAK2. Data are shown as mean ± SEM. *P < 0.05, **P < 0.01. One-way ANOVA analysis was used.

References

    1. Guymer RH, Campbell TG.. Age-related macular degeneration. Lancet (London, England). 2023; 401: 1459–1472. - PubMed
    1. Wolf AT, Harris A, Oddone F, Siesky B, Verticchio Vercellin A, Ciulla TA. Disease progression pathways of wet AMD: opportunities for new target discovery. Expert Opin Ther Targets. 2022; 26: 5–12. - PMC - PubMed
    1. Mu Q, Chen L, Gao X, et al. .. The role of iron homeostasis in remodeling immune function and regulating inflammatory disease. Sci Bull. 2021; 66: 1806–1816. - PubMed
    1. Muhoberac BB, Vidal R. Iron, ferritin, hereditary ferritinopathy, and neurodegeneration. Front Neurosci. 2019; 13: 1195. - PMC - PubMed
    1. Urrutia PJ, Mena NP, Núñez MT.. The interplay between iron accumulation, mitochondrial dysfunction, and inflammation during the execution step of neurodegenerative disorders. Front Pharmacol. 2014; 5: 38. - PMC - PubMed

MeSH terms