. 2025 Jan 12;27(1):123-139.
doi: 10.1093/neuonc/noae148.

Developmental pluripotency-associated 4 increases aggressiveness of pituitary neuroendocrine tumors by enhancing cell stemness

Affiliations

Developmental pluripotency-associated 4 increases aggressiveness of pituitary neuroendocrine tumors by enhancing cell stemness

Shaista Chaudhary et al. Neuro Oncol. .

Abstract

Background: Pituitary neuroendocrine tumors, PitNETs, are often aggressive and precipitate in distant metastases that are refractory to current therapies. However, the molecular mechanism in PitNETs' aggressiveness is not well understood. Developmental pluripotency-associated 4 (DPPA4) is known as a stem cell regulatory gene and overexpressed in certain cancers, but its function in the context of PitNETs' aggressiveness is not known.

Methods: We employed both rat and human models of PitNETs. In the rat pituitary tumor model, we used prenatal-alcohol-exposed (PAE) female Fischer rats which developed aggressive PitNETs following estrogen treatment, while in the human pituitary tumor model, we used aggressively proliferative cells from pituitary tumors of patients undergone surgery. Various molecular, cellular, and epigenetic techniques were used to determine the role of DPPA4 in PitNETs' aggressiveness.

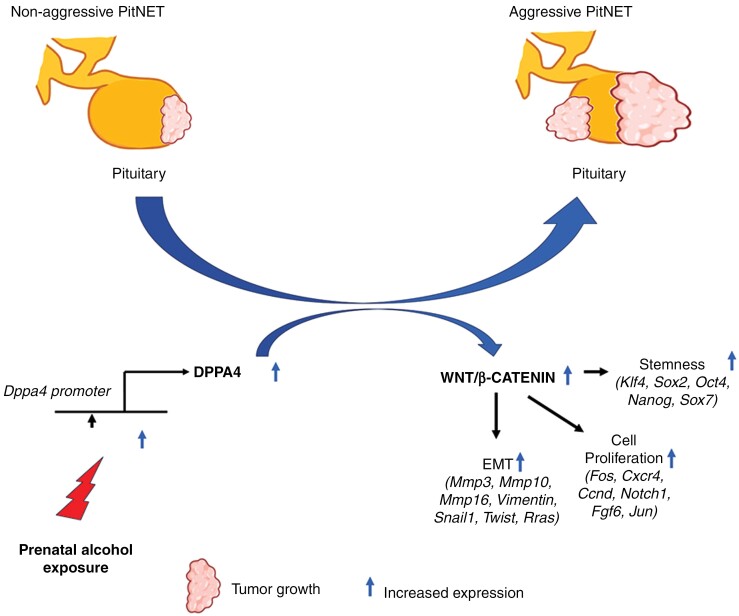
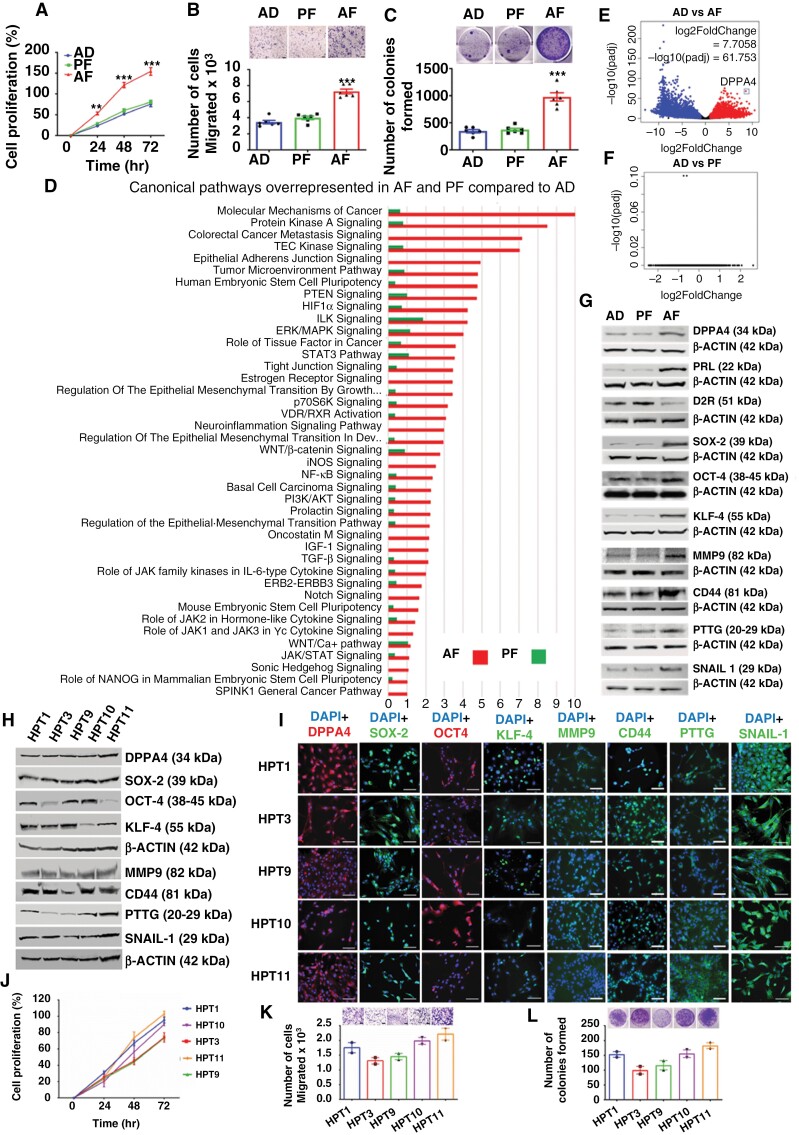
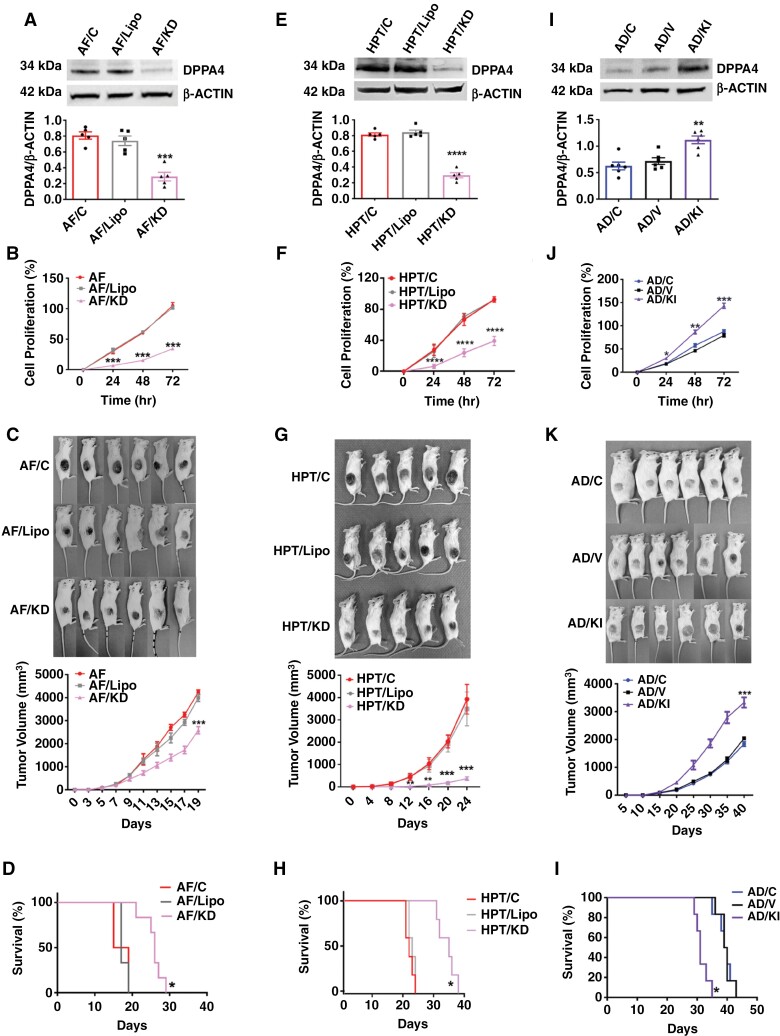
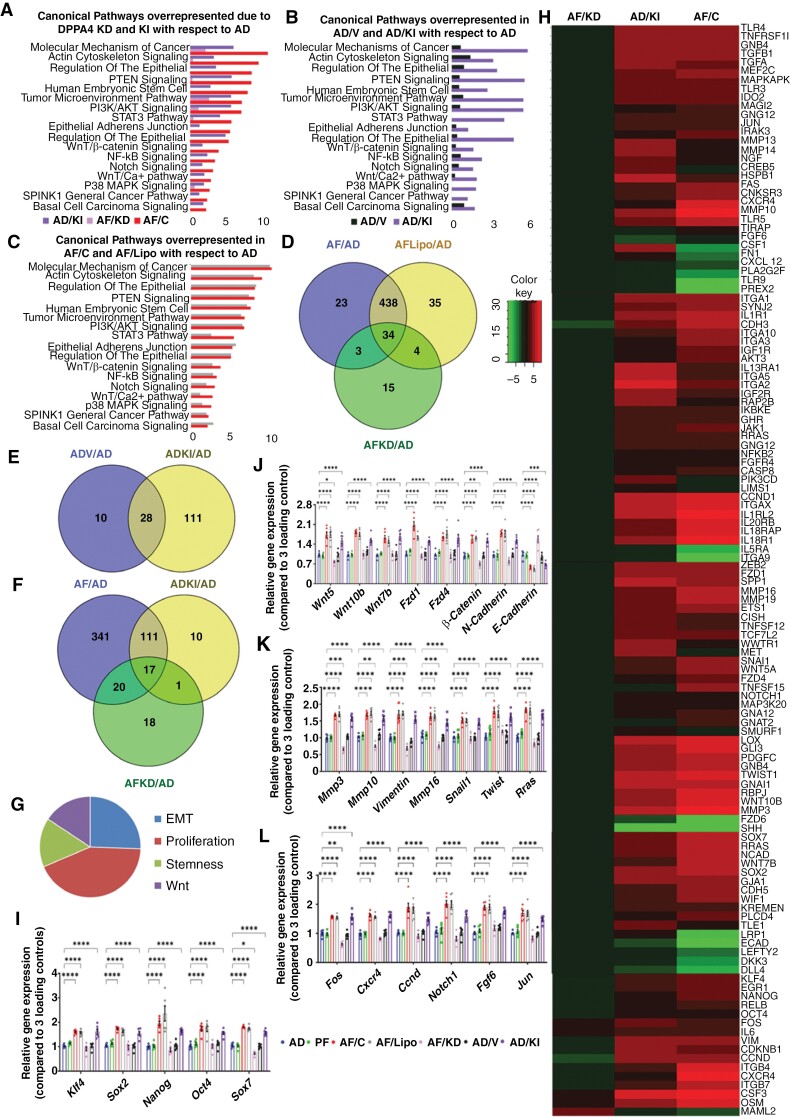
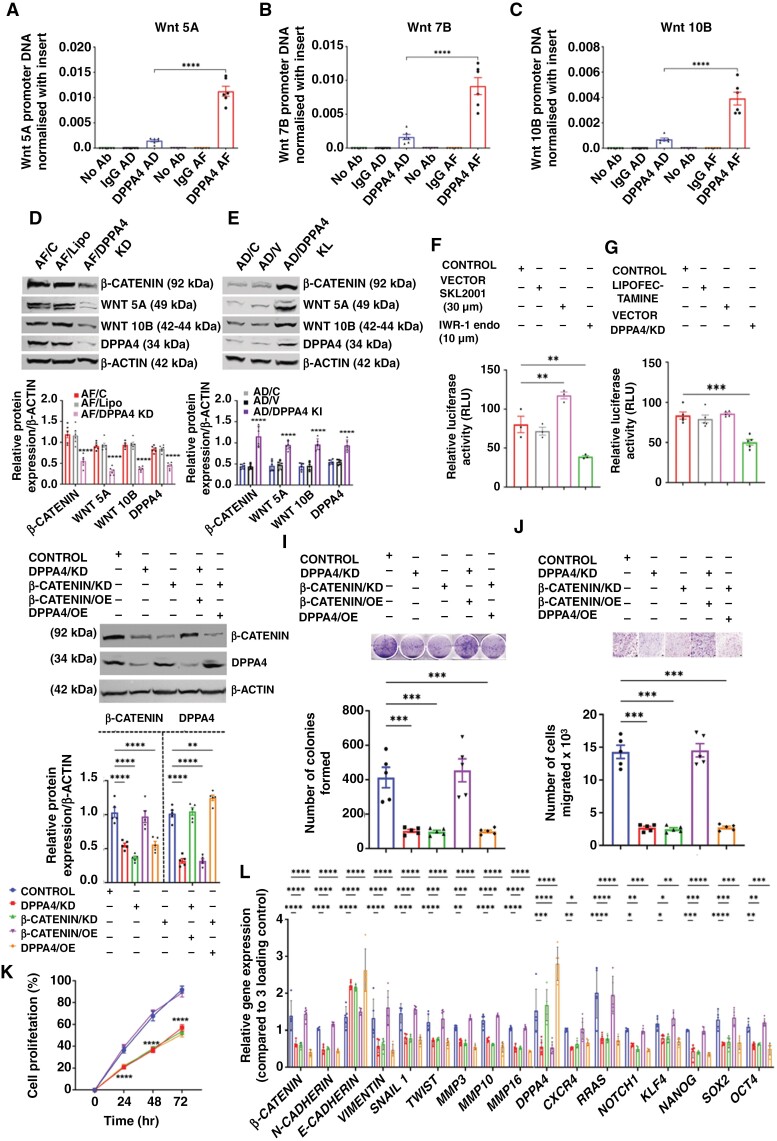
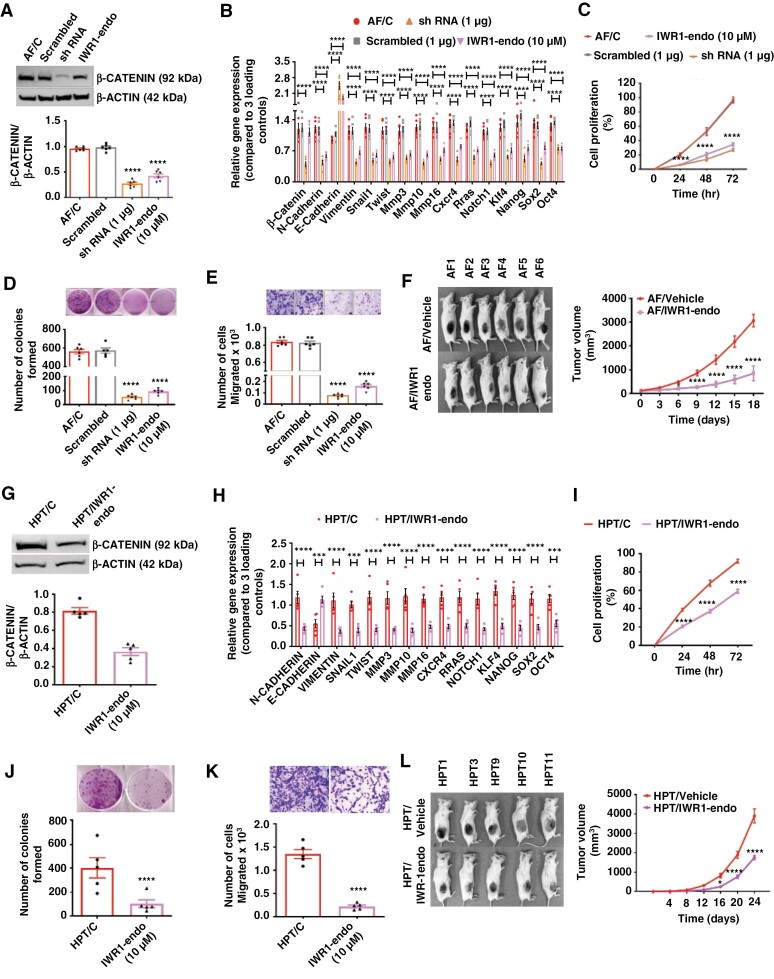
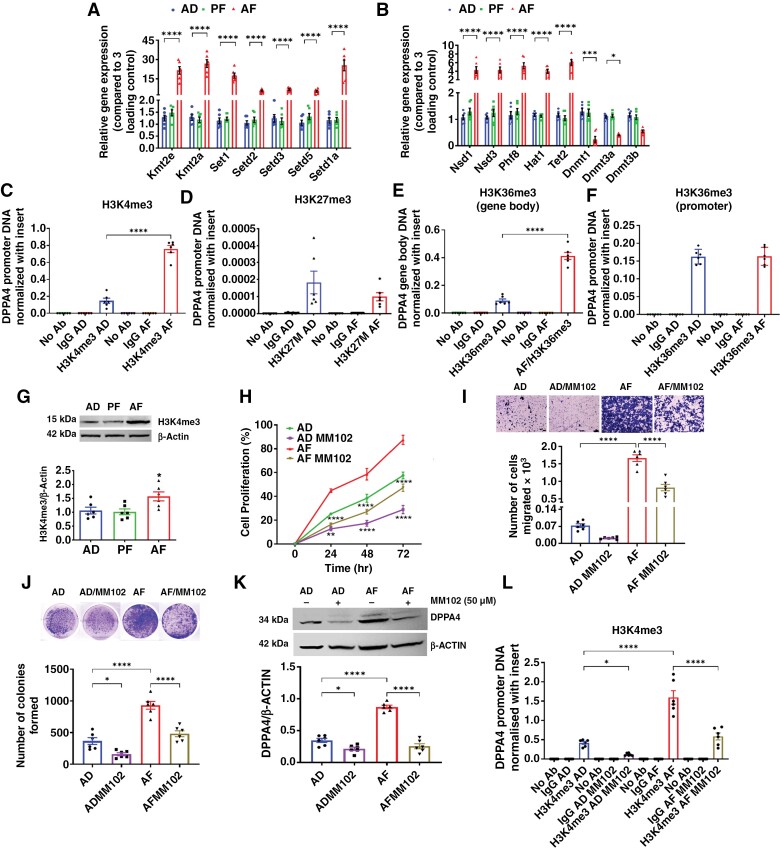
Results: We show that DPPA4 is overexpressed in association with increased cell stemness factors in aggressive PitNETs of PAE rats and of human patients. Gene-editing experiments demonstrate that DPPA4 increases the expression of cell stemness and tumor aggressiveness genes and promotes proliferation, colonization, migration, and tumorigenic potential of PitNET cells. ChIP assays and receptor antagonism studies reveal that DPPA4 binds to canonical WINTs promoters and increases directly or indirectly the WNT/β-CATENIN control of cell stemness, tumor growth, and aggressiveness of PitNETs. Epigenetic studies show the involvement of histone methyltransferase in alcohol activation of DPPA4.

Conclusions: These findings support a role of DPPA4 in tumor stemness and aggressiveness and provide a preclinical rationale for modulating this stemness regulator for the treatment of PitNETs.

Keywords: DPPA4; WNT/β-CATENIN; histone methyltransferase; pituitary neuroendocrine tumors; prenatal alcohol.


Conflict of interest statement

The authors declare no competing interests.

Figures

Graphical Abstract
Graphical Abstract
Figure 1.
Figure 1.
DPPA4 expression is elevated in aggressive PitNETs. (a to c) The aggressiveness of rat pituitary tumor (RPT) cells obtained from prenatal alcohol-fed (AF), pair-fed, (PF), ad libitum-fed (AD) rats was determined by cell proliferation (a), cell migration (b), and colony formation (c); n = 6. (d to f) RNA-seq data of AF, PF, and AD cells are analyzed by IPA and overrepresented canonical pathways are shown by histograms (d) and the expression difference between AD vs AF and AD vs PF are shown by volcano plots (e and f). (g) Western blot data of DPPA4, PRL, D2R, stem cell marker, and tumor aggressiveness marker proteins in AF, PF, and AD cells; n = 6. (h to i) DPPA4 and stem cell factors are expressed in aggressive patient-derived PitNET (HPT) cells. Expression of DPPA4 and various stem cell regulatory proteins were detected by Western blot (h) and immunofluorescence (i) in 5 different human pituitary tumor cells (HPT1-5) prepared from patient-derived tumor tissues that expresses more DPPA4 and stem cell regulatory proteins than those tumor tissues produced non-viable cells (Supplementary Figure 7). (j to l) Cell proliferation (j), cell migration (k), and colony formation (l) profiles of HPT1-5 cells (n = 2). Scale bar represents 100 μM in immunofluorescence figures. Data shown in histograms are mean ± SEM and were analyzed using 1-way or 2-way analysis of variance (ANOVA) with the Newman Keuls post hoc test or Dunnett’s multiple comparison test *P < .05, **P < .01, and ***P < .001 between AF and controls (AD, PF).
Figure 2.
Figure 2.
Effect of CRISPR knockdown and knockin of Dppa4 in the aggressiveness of PitNETs. (a to d) Effects of DPPA knockdown on RPT cells—AF cells untreated (AF/C), lipofectamine (AF/Lipo), or lipofectamine with gRNA (AF/KD). DPPA4 protein levels by Western blots (a). Cell proliferation rate (b). Pictures of animals with tumors in each group and tumor volume changes (c). Effects on survival time (d); n = 6. (e to h) Effects of DPPA knockdown on HPT cells—HPT cells untreated (HPT/C), lipofectamine (HPT/Lipo), or lipofectamine with gRNA (HPT/KD). DPPA4 protein levels by Western blots (e). Cell proliferation rate (f). Pictures of animals with tumors in each group and tumor volume changes (g). Effects on survival time (h); n = 5. (i to l) Effects of DPPA4 knockin on RPT cells—AD cells untreated (AD/C), lipofectamine (AD/V), or lipofectamine with gRNA (AD/KI). DPPA4 protein levels by Western blots (i). Cell proliferation rate (j). Pictures of animals with tumors in each group with tumor volume changes (h). Effects on survival time (l); n = 6. Data shown are mean ± SEM and were analyzed using 1-way or 2-way analysis of variance (ANOVA) with the Newman Keuls post hoc test or Dunnett’s multiple comparison test. ***P < .001, ****P < .0001, AF/KD vs AF/C and AF/Lipo or HPT/KD vs HPT/C and HPT/Lipo. Kaplan–Meier survival analysis was used to test significant differences between survival curves and mean survival time for mice from each group (d, h, and i). n = 6, *P < .05, AF/KD vs AF/C and AF/Lipo; n = 5, *P < .05, HPT/KD vs HPT/C and HPT/Lipo; n = 6, *P < .05, AD/KI vs AD/C and AD/V.
Figure 3.
Figure 3.
Gene expression profile changes following Dppa4 knockdown and knockin implicate WNT/β-CATENIN signaling involvement. (a to g) RNA-seq analysis of the effects of Dppa4 knockdown (AF/KD vs AF/C) and knockin (AD/KI vs AD) in the cancer-related canonical pathways. IPA analysis identified canonical pathways overrepresented in AF/KD and AD/KI vs AF/C (a), AD/V vs AD/KI (b), and AF/Lipo vs AF/C (c). Venn diagrams show the common and differentially expressed molecules among the AF, AF/Lipo, and AF/KD groups (d); AD/V and AD/KI groups (e); and AF, AD/KI, and AF/KD groups (f). Gene ontology plot shows changes in biological functions (g). Heatmap analysis of genes observed in AF/KD, AD/KI, AF/C (h); n = 3. (i to l) Validation of RNA-seq data using qPCR analysis. Relative quantification of Klf4, Sox2, Nanog, Oct4, Sox7 (i); Wnt5, Wnt10b, Wnt7b, Fzd1, Fzd4, β-Catenin, N-Cad, E-Cad (j); Mmp3, Mmp10, Vimentin, Mmp16, Snail, Twist, Rras (k); and Fos, Jun, Cxcr4, Ccnd, Notch1, fgf6 (l) in AF/C, AF/Lipo, AF/KD, AD/V, and AD/KI cells. Data shown are mean ± SEM (n = 6) and were analyzed using 1-way analysis of variance (ANOVA) with the Newman Keuls post hoc test. *P < .05, **P < .01, and ***P < .001 vs AD, PF, AF/KD, and AD/V.
Figure 4.
Figure 4.
Dppa4 increased tumor aggressiveness through the activation of the Wnt pathway in PitNETs. (a to c) ChIP assay data show the interaction of DPPA4 protein with 3 different Wnt promoters—Wnt 5A (a), Wnt 7B (b), Wnt 10B (c). (d and e) Effect of DPPA4 knockdown (d) and knockin (e) in protein levels of β-CATENIN, WNT 5A, WNT 10B and DPPA4. (f and g) Luciferase reporter assay to measure TCF/LEF (β-Catenin) promoter activity in HPT cells after treatment with β-CATENIN agonist or antagonist treatments (f) or knockidown of Dppa4 (g). Lipofectamine 2000 (vector) was used to transfect the reporter plasmid in HPT cells. After 24 hours of transfection, the cells were treated with SKL2001 (β-CATENIN agonist) and IWR-1-endo (β-CATENIN antagonist) separately. After 24 hours of treatment, relative luciferase activity was measured (firefly/renilla) and expressed as percentage in Control (HPT/C), vector (lipofectamine 2000), SKL2001 (HPT treated with SKL2001), IWR-1-endo (HPT treated with IWR-1-endo). Lipofectamine represents the CRISPRMAX lipofectamine used to transfect gRNA Cas9 complex. Control (HPT/C), lipofectamine (CRISPRMAX), vector (lipofectamine 2000), DPPA4/KD (HPT/KD). (h–k) Rescue assay showed the requirement of β-CATENIN for the downstream activity of DPPA4. Control (HPT/C), DPPA4/KD (Dppa4 knockdown HPT), β-CATENIN/KD (β-Catenin knockdown HPT cells), β-CATENIN/OE (HPT cells transfected with β-Catenin overexpression plasmid using lipofectamine 2000), DPPA4/OE (HPT cells transfected with Dppa4 overexpression plasmid using lipofectamine 2000). The immunoblot data shows the level of β-CATENIN and DPPA4 where both were manipulated in either way (h). Colony formation assay (i), transwell migration assay (j), cell proliferation assay (k). (l) Expression changes of genes that are associated with β-Catenin pathways (l), n = 5. Data shown are mean ± SEM and were analyzed using 1-way or 2-way ANOVA with the Newman Keuls post hoc test or Dunnett’s multiple comparison test. *P < .05, **P < .01, and ***P < .001, ****P < .0001 vs Control (HPT/C).
Figure 5.
Figure 5.
Knockdown and inhibition of β-Catenin through shRNA and IWR-1-endo treatment implicate WNT/β-CATENIN signaling. (a to f) Effects on RPT cells—treated with scrambled plasmid, shRNA plasmid for β-Catenin (1 µg concentration was determined by a dose-response study; Supplementary Figure 11a) or IWR-1-endo (10 µM concentration was determined by a dose–response study; Supplementary Figure 11b to d). β-CATENIN protein levels determined by Western blots (a). Expression changes of genes that are associated with β-Catenin pathways (b). Effects on cell proliferation rate (c). Colony-forming abilities (d). Changes in cell migration (e). Pictures of animals with tumors in each group and tumor volume changes (f), n = 6. (i to l) Effects on HPT cells treated with IWR-1-endo (concentration was determined by a dose–response study; Supplementary Figure 13). Western blot analysis of β-CATENIN (g). Expression changes of genes that are associated with β-Catenin pathways (h). Effects on cell proliferation rate (i). Colony-forming abilities (j). Changes in cell migration (k). Pictures of animals with tumors in each group with tumor volume changes (l), n = 5. Data shown are mean ± SEM and were analyzed using 1-way or 2-way ANOVA with the Newman Keuls post hoc test or Dunnett’s multiple comparison test. *P < .05, **P < .01, and ***P < .001, ****P < .0001 AF/IWR-1-endo vs AF/C, AF/IWR-1-endo, ShRNA vs AF/C, Scrambled and AF/vehicle or HPT/IWR-1-endo vs HPT/C or HPT/vehicle.
Figure 6.
Figure 6.
Dppa4 promoter is epigenetically regulated by PAE. (a and b) Relative quantification of expression of different genes responsible for epigenetic modulation in the promoter region of the DNA in AD, PF, and AF. (c to f) ChIP assays data show the H3K4me3 level (c) and H3K27me3 level (d) in the Dppa4 promoter region. (e and f) ChIP assay shows the H3K36me3 level in the Dppa4 gene body (e) and promoter region (f), respectively. (g) The image shows the changes in protein levels of H3K4me3 in AD, PF, and AF cells. (h to k) Effects of H3K4me3 blocker MM102 (50 µM is the optimum effective dose of MM102; Supplementary Figure 15) on cell proliferation rates of AD and AF cells (h), transwell cell migration (i), colony formation (j), and DPPA4 protein levels (k). The ChIP assay shows the H3K4me3 level in DPPA4 promoter after 48 h of MM102 treatment (l). Data were analyzed using 1-way or 2-way ANOVA with the Newman Keuls post hoc test or Dunnett’s multiple comparison test. n = 6, **P < .01 and ***P < .001 vs AD and PF cells (a to d; i); ***P < .001 vs rest of the groups (e, g, and j), vs AD or AF (j); *P < .05 and ****P < .0001 as indicated by a line above the bar.

Similar articles

Cited by

References

    1. Colao A. Pituitary tumours: the prolactinoma. Best Pract Res Clin Endocrinol Metab. 2009;23(5):575–596. - PubMed
    1. Raverot G, Burman P, McCormack A, et al.; European Society of Endocrinology. European Society of Endocrinology Clinical Practice Guidelines for the management of aggressive pituitary tumours and carcinomas. Eur J Endocrinol. 2018;178(1):G1–G24. - PubMed
    1. Das L, Rai A, Salunke P, et al.Temozolomide nonresponsiveness in aggressive Prolactinomas and carcinomas: management and outcomes. J Endocr Soc. 2021;6(2):bvab190. - PMC - PubMed
    1. Neou M, Villa C, Armignacco R, et al.Pangenomic classification of pituitary Neuroendocrine tumors. Cancer Cell. 2020;37(1):123–134.e5. - PubMed
    1. Lasolle H, Ilie MD, Raverot G.. Aggressive prolactinomas: how to manage? Pituitary. 2020;23(1):70–77. - PubMed