. 2024 Aug 6;121(32):e2303439121.
doi: 10.1073/pnas.2303439121. Epub 2024 Aug 2.

Nutrient and moisture limitations reveal keystone metabolites linking rhizosphere metabolomes and microbiomes

Affiliations

Nutrient and moisture limitations reveal keystone metabolites linking rhizosphere metabolomes and microbiomes

Nameer R Baker et al. Proc Natl Acad Sci U S A. .

Abstract

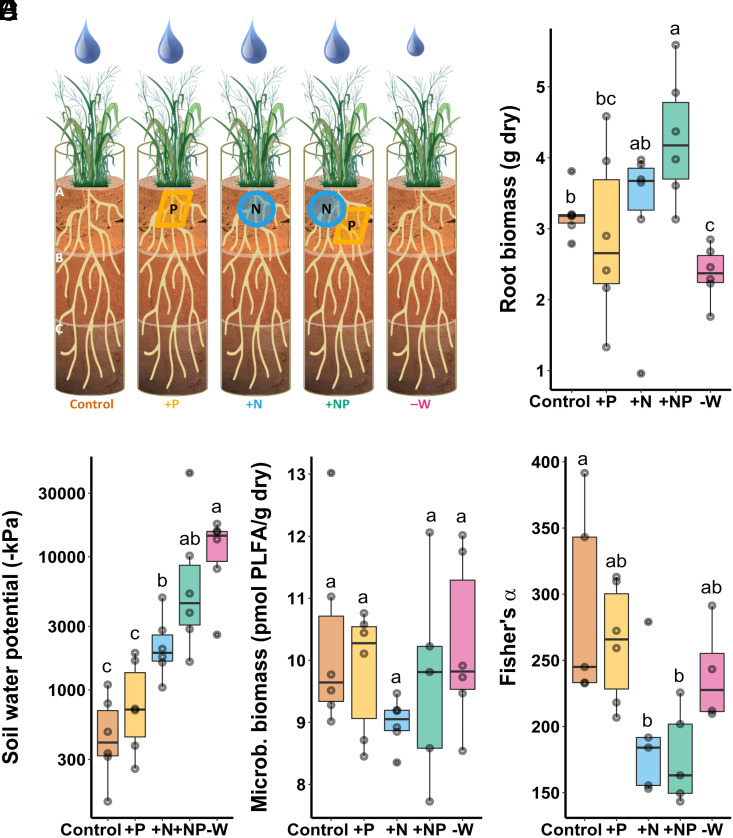
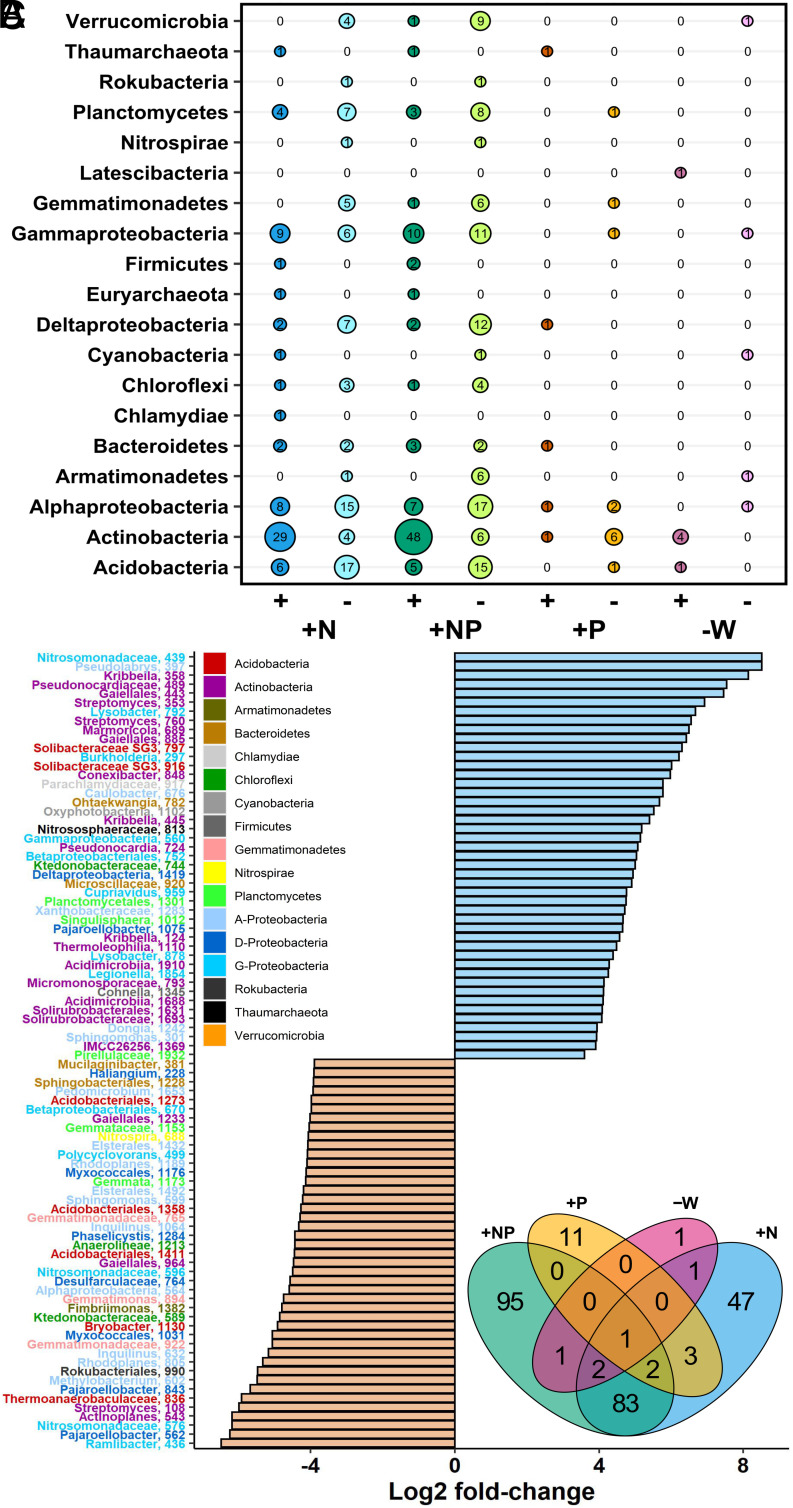
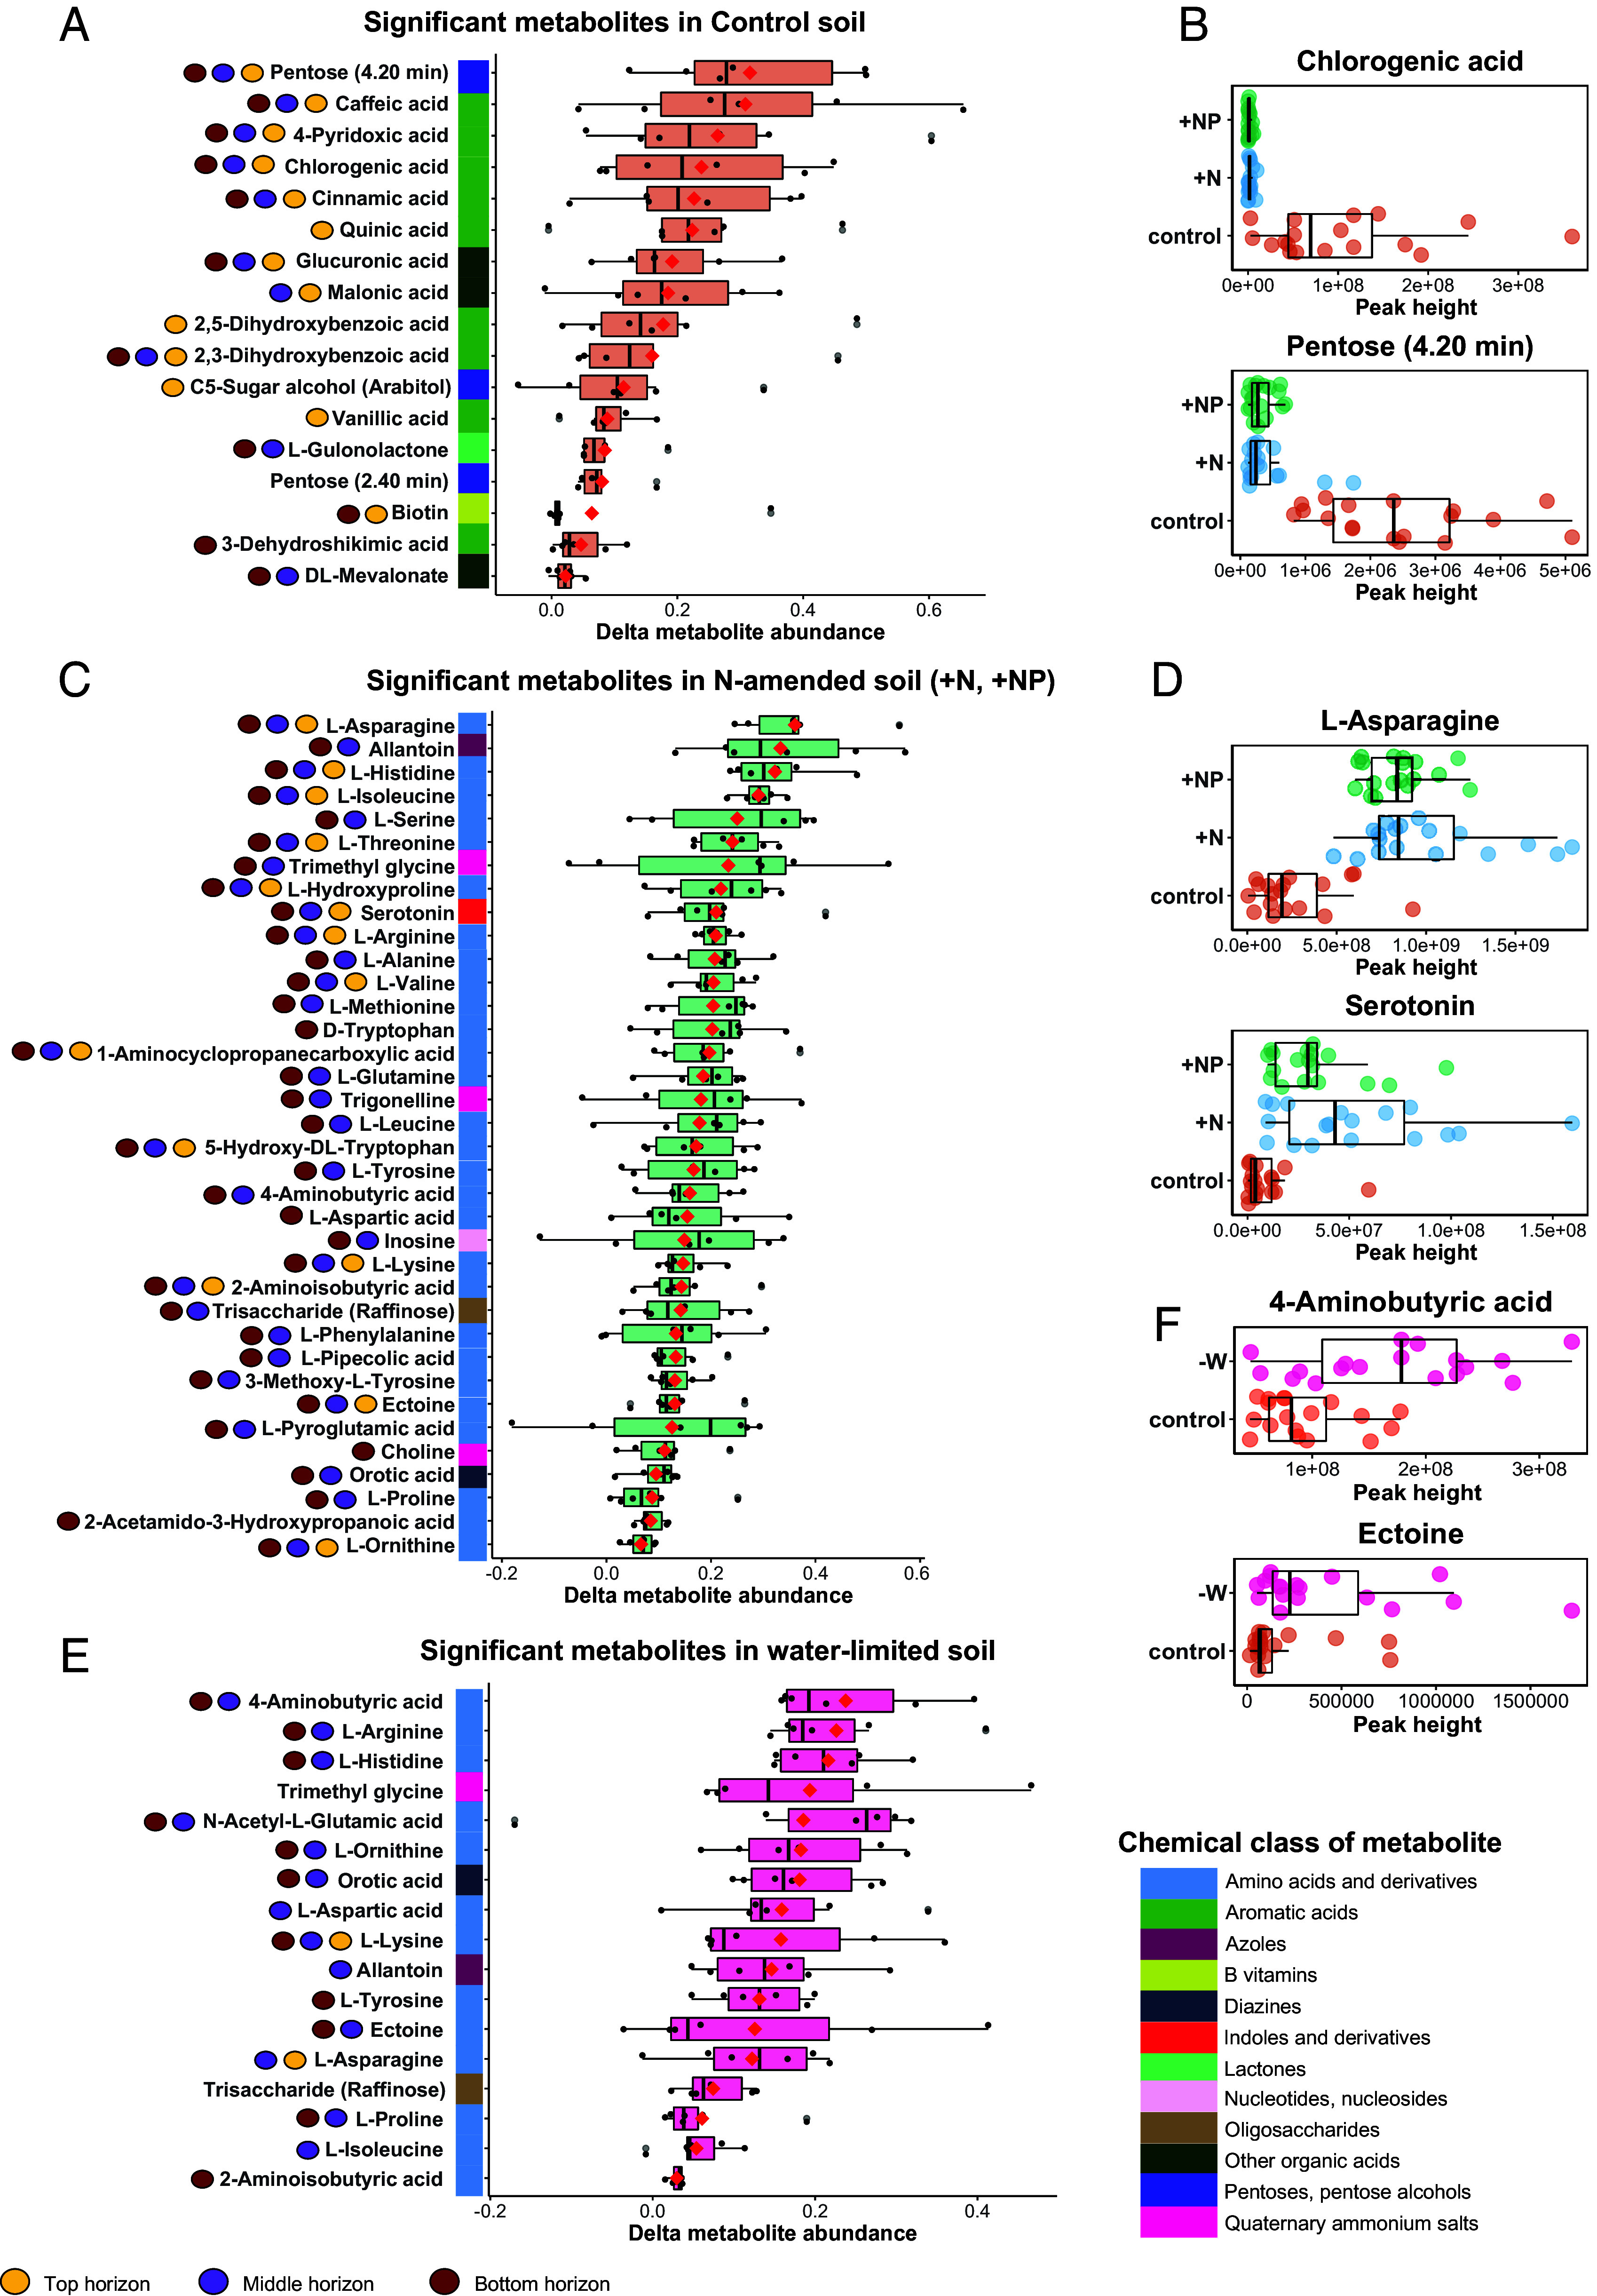
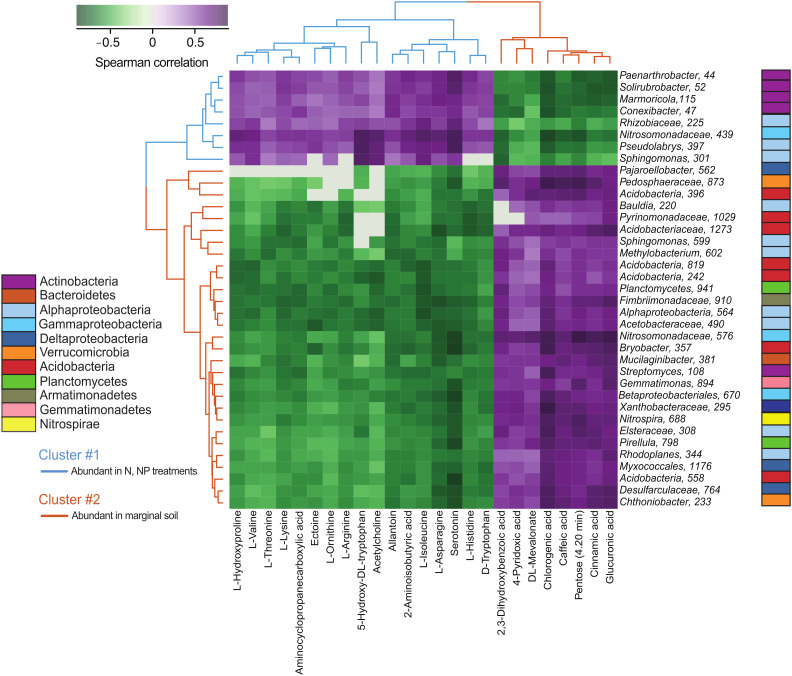
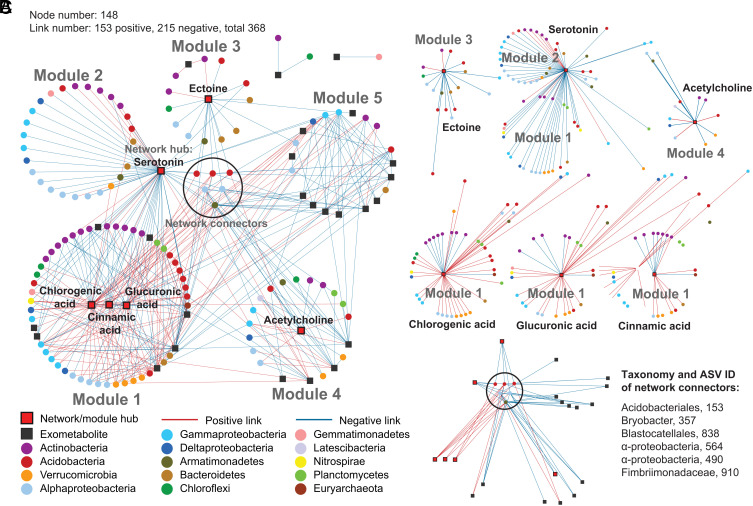
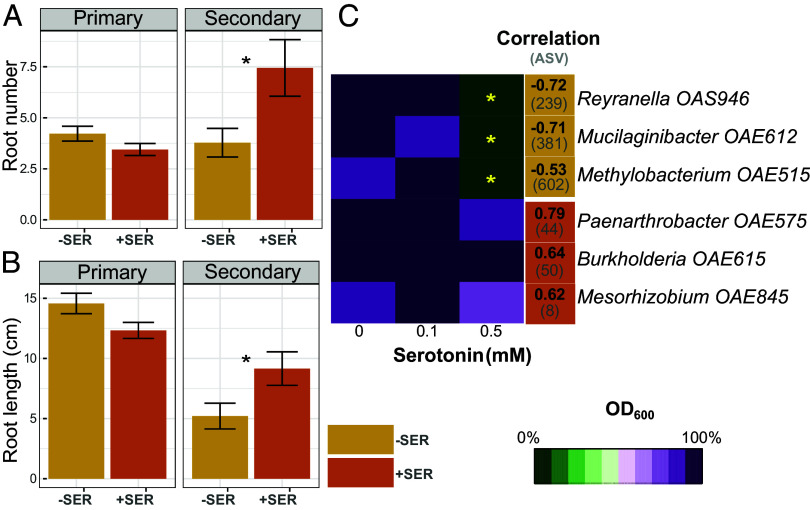
Plants release a wealth of metabolites into the rhizosphere that can shape the composition and activity of microbial communities in response to environmental stress. The connection between rhizodeposition and rhizosphere microbiome succession has been suggested, particularly under environmental stress conditions, yet definitive evidence is scarce. In this study, we investigated the relationship between rhizosphere chemistry, microbiome dynamics, and abiotic stress in the bioenergy crop switchgrass grown in a marginal soil under nutrient-limited, moisture-limited, and nitrogen (N)-replete, phosphorus (P)-replete, and NP-replete conditions. We combined 16S rRNA amplicon sequencing and LC-MS/MS-based metabolomics to link rhizosphere microbial communities and metabolites. We identified significant changes in rhizosphere metabolite profiles in response to abiotic stress and linked them to changes in microbial communities using network analysis. N-limitation amplified the abundance of aromatic acids, pentoses, and their derivatives in the rhizosphere, and their enhanced availability was linked to the abundance of bacterial lineages from Acidobacteria, Verrucomicrobia, Planctomycetes, and Alphaproteobacteria. Conversely, N-amended conditions increased the availability of N-rich rhizosphere compounds, which coincided with proliferation of Actinobacteria. Treatments with contrasting N availability differed greatly in the abundance of potential keystone metabolites; serotonin and ectoine were particularly abundant in N-replete soils, while chlorogenic, cinnamic, and glucuronic acids were enriched in N-limited soils. Serotonin, the keystone metabolite we identified with the largest number of links to microbial taxa, significantly affected root architecture and growth of rhizosphere microorganisms, highlighting its potential to shape microbial community and mediate rhizosphere plant-microbe interactions.

Keywords: abiotic stress; metabolome; microbiome; rhizosphere; switchgrass.


Conflict of interest statement

Competing interests statement:The authors declare no competing interest.

Figures

Fig. 1.
Fig. 1.
Greenhouse experiment investigating the effect of nutrient or moisture stress on switchgrass biomass, rhizosphere chemistry, and microbial communities. Plants were grown in one-meter-deep mesocosms containing a marginal sandy loam soil, with recreated “A”, “B,” and “C” horizons. (A) Schematic of experimental design illustrating five treatments: “Control” with nutrient-poor marginal soil, “+P,” “+N,” and “+NP” mesocosms with phosphorus and/or nitrogen amendments in the top soil horizon, and “−W” mesocosms which received 50% less water relative to the other treatments. Box-whisker plots (median and 25 to 75% quartiles) of (B) switchgrass root biomass (g dry mass), (C) soil water potential (−kPa), (D) microbial biomass (pmol PLFA/g dry soil) from bulk soil, and (E) microbial α-diversity (Fisher’s α) in rhizosphere soil are shown by treatment for the “A” horizon. Letters represent significantly different post hoc pairwise comparisons via Tukey’s test (P < 0.05, n = 6).
Fig. 2.
Fig. 2.
Influence of nutrient and water limitation on switchgrass rhizosphere microbial community structure assessed by DESeq2 analysis. (A) Number of positively (+) and negatively (−) responsive ASVs in nutrient-amended and water-limited treatments (+N, +NP, +P, −W) as compared to control soils, arranged by phyla (bubble size reflects the number of responsive ASVs). Empty cells indicate no responsive ASVs from that phylum. (B) The top-50 ASVs that increased (+Log2 fold-change) versus decreased in prevalence (−Log2 fold-change) in response to the +N treatment. ASVs are presented at the highest available taxonomic resolution and are colored by class for Proteobacteria and by phylum for all other phyla. (C) Number of unique and shared ASVs that changed in prevalence in response to each treatment relative to controls.
Fig. 3.
Fig. 3.
Significant changes in switchgrass rhizosphere metabolite profiles in response to five nutrient and water stress treatments (n replicates = 6), assessed by PERMANOVA (P < 0.05; Dataset S4 for details). (A) Metabolites significantly enriched (P < 0.05) in a nutrient-depleted marginal soil (control) compared to treatments where N was added (+N; +NP). Y-axis circles next to each metabolite represent the soil horizons where the metabolite had a significantly different abundance. Unresolvable metabolites are indicated by parentheses. (B) Abundance of an example metabolite enriched in nutrient-depleted soil across all three horizons. (C) Metabolites that increased (P < 0.05) in abundance in response to N addition (+N, +NP) compared to the control soil. (D) Abundance of an example metabolite enriched in N-replete soil. (E) Metabolites that increased in abundance (P < 0.05) in response to water limitation (−W) compared to the control soil. (F) Abundance of an example metabolite enriched in the water-limited treatment. The red diamond inside each box denotes the mean and the horizontal line denotes the median. Points reflect a single metabolite per sample, the outer boxes indicate the first, second, and third data quartiles, and whiskers indicate the range of the points excluding outliers.
Fig. 4.
Fig. 4.
Heatmap representing the top covarying microbial taxa and metabolites in the rhizosphere of switchgrass grown with five soil nutrient and water treatments. Top associations between metabolites (columns) and ASVs (row) include i) DESeq2-determined differentially abundant ASVs (n = 37) with more than three significant positive or negative correlations (Spearman’s rank correlation, r > 0.7, P < 0.05) with metabolites; and ii) metabolites (n = 25) with more than one significant positive or negative correlation (Spearman’s rank correlation, r > 0.7, P < 0.05) with ASVs. Hierarchical clustering shows two clusters of metabolite-ASV correlations. Cluster #1 (blue lines) represents metabolites and ASVs that were more abundant in the rhizosphere when nitrogen was added (+N, +NP treatments) and Cluster #2 (brown lines) includes metabolites and ASVs that were more abundant in nitrogen-poor marginal soil (controls). Purple colors in the heatmap represent positive Spearman correlations, white represents no correlation, and green colors represent negative correlations between metabolites and ASVs.
Fig. 5.
Fig. 5.
Co-occurrence network of switchgrass rhizosphere metabolites and microbial ASVs exposed to five soil treatments in a greenhouse study. (A) An association network between 908 16S ASVs and 99 rhizosphere metabolites. Nodes with circle symbols represent 16S ASVs, and nodes with square symbols represent metabolites. Links between nodes are based on Spearman correlations (r > 0.710) of their relative abundances, red for positive correlation and blue for negative correlation. The network separates into five major modules, or highly connected groups of nodes, shown as the five numbered circles. Red filled squares highlight rhizosphere metabolites that act as network and module hubs, which are the nodes with dense connections to other nodes within the entire network (network hub) or a module (module hub). The six microbial ASV nodes at the center serve as connectors of different modules, or the nodes linking different modules. (B) Subnetworks of rhizosphere metabolites that formed module hubs and their neighboring microbial nodes. (C) Subnetworks of microbial nodes that serve as connectors, and their linked rhizosphere metabolite. Microbial ASVs are colored by class for Proteobacteria and by phylum for all other phyla.
Fig. 6.
Fig. 6.
Serotonin effects on switchgrass plant phenotype and growth of rhizosphere microorganisms. (A and B) 25-d-old switchgrass seedlings (n = 9) grown with exogenous application of 0.1 mM of serotonin (+SER) or controls (−SER). Serotonin effects on secondary root number (A) and total root length (B). Significant differences between added-serotonin and controls were assessed by ANOVA, asterisks reflect P < 0.05. (C) Optical density (OD600) of rhizosphere bacteria cultures after 130 h of growth in 1/10 R2A medium with 0, 0.1, or 0.5 mM of serotonin. Values have been scaled to the highest OD for each isolate across the row. The highest OD of the isolate is 100% (dark purple) and the lowest OD is 0% (dark green), meaning that isolate growth has been completely inhibited. Orange cells indicate isolates related to ASVs with significant negative correlations with serotonin (−SER) and brown cells indicate isolates matched to ASVs with positive correlations (+SER). Positive and negative correlations between specific ASV (shown in parentheses) and serotonin shown inside of each cell. Asterisks indicate significantly different OD600 between the 0.1 and 0.5 mM serotonin treatments (n = 4) and a control treatment without serotonin (0 mM, n = 4) at P < 0.05 by means of the Kruskal–Wallis test.

References

    1. Haichar F. el Z., et al., Plant host habitat and root exudates shape soil bacterial community structure. ISME J. 2, 1221–1230 (2008). - PubMed
    1. Shi S., et al. , Successional trajectories of rhizosphere bacterial communities over consecutive seasons. mBio 6, e00746 (2015). - PMC - PubMed
    1. Bulgarelli D., et al. , Structure and function of the bacterial root microbiota in wild and domesticated barley. Cell Host Microbe 17, 392–403 (2015). - PMC - PubMed
    1. Philippot L., et al. , Loss in microbial diversity affects nitrogen cycling in soil. ISME J. 7, 1609–1619 (2013). - PMC - PubMed
    1. Van de Broek A., Lambrecht M., Vanderleyden J., Bacterial chemotactic motility is important for the initiation of wheat root colonization by Azospirillum brasilense. Microbiology 144, 2599–2606 (1998). - PubMed