. 2024 Oct 22;8(20):5315-5329.
doi: 10.1182/bloodadvances.2023011540.

The E3 ubiquitin ligase Herc1 modulates the response to nucleoside analogs in acute myeloid leukemia

Affiliations

The E3 ubiquitin ligase Herc1 modulates the response to nucleoside analogs in acute myeloid leukemia

Maja Jankovic et al. Blood Adv. .

Abstract

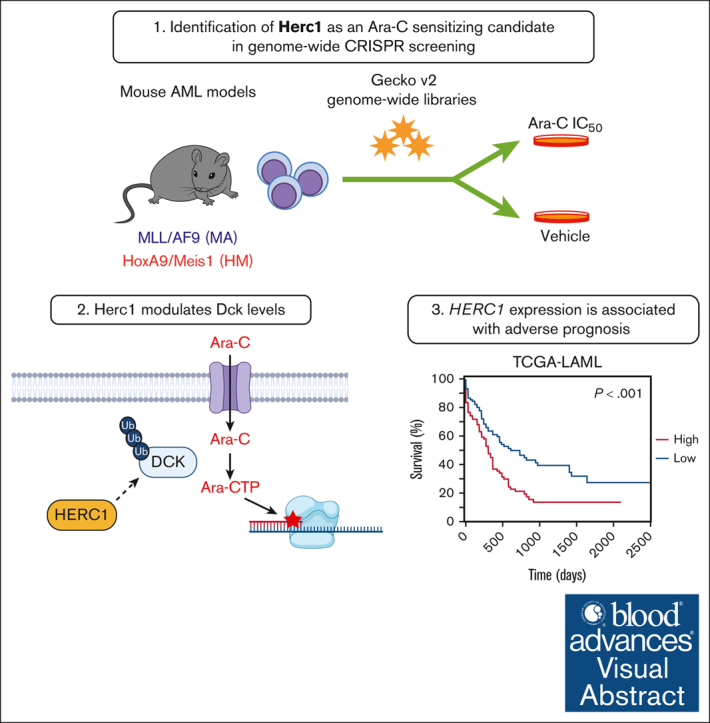
For several decades, induction therapy with nucleoside analogs, in particular cytarabine (Ara-C) and, to a lesser extent, fludarabine, has been the standard of care for patients diagnosed with acute myeloid leukemia (AML). However, the antitumor efficacy of nucleoside analogs is often limited by intrinsic and acquired drug resistance, thereby leading to poor therapeutic response and suboptimal clinical outcomes. In this study, we used genome-wide CRISPR-based pharmacogenomic screening to map the genetic factors that modulate the response to nucleoside analogs in AML and identified the E3 ubiquitin ligase, Herc1, as a key modulator of Ara-C response in mouse AML models driven by the KMT2A/MLLT3 fusion or by the constitutive coexpression of Hoxa9 and Meis1, both in vitro and in vivo. Loss of HERC1 enhanced nucleoside analog-induced cell death in both murine and human AML cell lines by compromising cell cycle progression. In-depth proteomic analysis and subsequent validation identified deoxycytidine kinase as a novel target of Herc1 in both mouse AML models. We observed that HERC1 is overexpressed in AML when compared with other cancer types and that higher HERC1 expression was associated with shorter overall survival in patients with AML in the The Cancer Gene Atlas program (TCGA) and BEAT-AML cohorts. Collectively, this study highlights the importance of HERC1 in the response of AML cells to nucleoside analogs, thereby establishing this E3 ubiquitin ligase as a novel predictive biomarker and potential therapeutic target for the treatment of AML.


Conflict of interest statement

Conflict-of-interest disclosure: The authors declare no competing financial interests.

The current affiliation for G.G.V. is Paraza Pharma Inc.

The current affiliation for M.J. is Paraza Pharma Inc.

The current affiliation for W.W.L.P. is Strand Therapeutics Inc.

Figures

None
Graphical abstract
Figure 1.
Figure 1.
CRISPR screening identifies Herc1 as a modulator of Ara-C response in murine AML cells. (A) Schematic of our CRISPR/Cas9–based screening pipeline developed in murine AML cells. (B) Representation of CRISPR/Cas9–based dropout screen performed in MA and HM cells in the presence of Ara-C (IC50). (C) Representation of overlapping genes that are providing sensitivity (NormZ score, <2) and resistance to Ara-C (>2). (D) Pathway enrichment analysis of sensitizing genes using the KEGG database. (E) Expression analysis of the 39 overlapping sensitizers in the hematopoietic and lymphoid tissues from the CCLE database (n = 188). (F) Schematic of CRISPR-based competition assay. (G) Competitive growth assay ± Ara-C (50 nM) or H2O (vehicle) in MA cells. Data are represented as the ratio of mCherry+ normalized to day 0 (t3 independent transductions). Significance was determined using 2-way analysis of variance (ANOVA), followed by a Dunnett test. ∗P ≤ .05. AMPK, adenosine monophosphate-activated protein kinase; KEGG, Kyoto Encyclopedia of Genes and Genomes.
Figure 2.
Figure 2.
Targeting of Herc1 increases the sensitivity of murine AML cell to nucleoside analogs in vitro. (A) Representation of nucleoside analogs used for cell viability assays. (B) MA cells were seeded in quadruplicates into 96-well plates and treated with varying concentrations of Ara-C. The number of viable cells was measured after 72 hours using the CTG Luminescent Cell Viability Assay. One of the independent experiments is shown. (C) IC50 concentrations of Ara-C of 6 independent repeated experiments in MA with either sgHerc1 number 1 or sgHerc1 number 2 analyzed together or separate with sgCtrl. Significance was determined using 1-way ANOVA followed by Dunnett’s multiple comparisons test. ∗P ≤ .05. (D) MA cells were seeded in quadruplicates into 96-well plates and treated with varying concentrations of Gem. The number of viable cells was measured after 72 hours using the CTG Luminescent Cell Viability Assay. One of independent experiments is shown. (E) IC50 concentrations of Gem of 8 independent repeated experiments in MA with either sgHerc1 number 1 and sgHerc1 number 2 analyzed together or separate with sgCtrl. Significance was determined using one-way ANOVA, followed by Dunnett multiple comparisons test. ∗P ≤ .05. (F) IC50 concentrations of Flu of 8 independent repeated experiments in MA with either sgHerc1 number 1 or sgHerc1number 2, analyzed together or separate with sgCtrl. Significance was determined using a 1-way ANOVA, followed by Dunnett multiple comparisons test. ∗P ≤ .05. (G) HM cells were seeded in quadruplicates into 96-well plates and treated with varying concentrations of Ara-C. The number of viable cells was measured after 72 hours using the CTG Luminescent Cell Viability Assay. One of independent experiments is shown. (H) IC50 concentrations of Ara-C of 3 independent repeated experiments in HM. Significance was determined using a 1-way ANOVA, followed by Dunnett multiple comparisons test. ∗P ≤ .05. (I) HERC1 expression was analyzed in a panel of human AML cell lines (n = 19) and linked to their respective cytarabine IC50. Cell lines were arbitrarily split into low (n = 9) and high (n = 10) expressers of HERC1. Significance was determined using an unpaired 1-tailed t test. ∗P ≤ .05.
Figure 3.
Figure 3.
Targeting the E3 Ub ligase Herc1 exacerbates Ara-C-induced apoptosis in AML cells. (A) MA cells were plated for 24 hours in triplicates into 6-well plates and treated with ±Ara-C (200 nM) or H2O (vehicle). The values are presented as means ± standard error of the mean (SEM) (n = 3). Significance was determined using a 2-way ANOVA analysis, followed by Holm-Šídák multiple comparisons test. ∗P ≤ .05. (B) Representative flow cytometry analysis of MA cells treated with ±Ara-C (200 nM) or H2O (vehicle) for 24 hours and stained with annexin V/DAPI. (C) Representation of the annexin V/DAPI analysis displayed in panel B for MA cells. The values are means ± SEM for n = 4 independent replicates. Significance was determined using a 1-way ANOVA, followed by Holm-Šídák multiple comparisons test. ∗∗P ≤ .005; ∗∗∗∗P ≤ .0001. (D) Representation of the annexin V/DAPI analysis displayed in panel B for HM cells. Values are means ± SEM for n = 3 independent replicates. Significance was determined using a 1-way ANOVA, followed by Holm-Šídák multiple comparisons test. ∗P ≤ .05. (E) Representation of the annexin V/DAPI analysis displayed in panel B for U937 cells. Values are means ± SEM for n = 4 independent replicates. Significance was determined using a 1-way ANOVA, followed by Holm-Šídák multiple comparisons test. ∗P ≤ .05. (F) Representative flow cytometry analysis of MA cells treated with Ara-C (200 nM) or H2O (vehicle) for 0 hours, 6 hours, and 12 hours and stained with propidium iodide or DAPI for cell cycle analysis. (G) Representation of the cell cycle analysis displayed in panel B for MA cells with ±Ara-C (200 nM) or water (Vehicle) for 0 hours and 6 hours (n = 3 independent experiments with 3 technical replicates) and for 12 hours (1 independent experiment, 3 technical replicates). Significance was determined using mixed-effects analysis followed by Holm-Šídák multiple comparisons test. ∗P ≤ .05; ∗∗P < .01; ∗∗∗∗P < .0001.
Figure 4.
Figure 4.
Multiomic analysis identifies the Dck as a downstream target of Herc1. (A) Representation of the functional domains of HERC1 protein. (B) Volcano plot showing protein abundance in sgHerc1-MA cells vs sgCtrl MA cells. P values were calculated using t tests and were corrected for multiple hypothesis testing with Benjamin-Hochberg method. The dashed line represents P = .05. (C) Pathway enrichment analysis of 106 proteins that were significantly abundant in sgHerc1-MA cells. (D) Volcano plot showing differential expressed genes in sgHerc1-MA cells vs sgCtrl MA cells. The dashed line represents log2 fold change (FC) of ±1.5. (E) Integration of transcriptomic and proteomic data with the CRISPR/Cas9 screen to identify potential targets of Herc1. Potential candidates that passed the following criteria of (1) greater protein abundance (>1.5-fold) (shown in panel B) and (2) no corresponding change in mRNA transcript abundance (<1.5-fold) (shown in panel D). (F) Assessment of DCK protein levels in Herc1–gene edited cells. Representative western blot of whole cell lysates shows the DCK protein level in MA and HM-sgCtrl and sgHerc1 knockout cells using 3 different sgRNAs. (G) Quantification of DCK western blot as shown in panel F. Proteins are represented in arbitrary units (a.u.), normalized against sgCtrl. Values are means ± SEM of n = 8 (MA) and n = 7 (HM) independent replicates. Significance was determined using Wilcoxon signed-rank test. ∗P ≤ .05; ∗∗P < .01. (H) Quantitative PCR shows the mRNA levels of Dck in MA cells. Values are means ± SEM, (n = 4). Significance was determined using a 1-way ANOVA, followed by Dunnett multiple comparisons test. ∗P ≤.05; ∗∗P < .01. (I) Assessment of DCK protein levels in MA and HM cells treated with the proteasome inhibitor MG132 (10 μM, 8 hours). Representative western blot of whole cell lysates shows DCK protein level in MA and HM cells. (J) Quantification of DCK western blot as shown in panel I. Proteins are presented in a.u., normalized to the vinculin loading control. Values are means ± SEM (n = 4). Significance was determined using an unpaired 2-tailed t test. ∗P ≤ .05; ∗∗P < .01.
Figure 5.
Figure 5.
Targeting Herc1 modulates Ara-C response in vivo. (A) Schematic of the in vivo competition experiment. sgHerc1-mCherry cells and sgCtrl-BFP cells were combined in a 1:1 ratio before transplantation. A mix of 1 × 106 cells was transplanted into sublethally irradiated C57BL6.J mice. MA and HM cells were analyzed at the indicated timepoints. (B) Representation of flow cytometry analysis of the peripheral blood (PB) and bone marrow (BM) before and after Ara-C treatment, as described in panel A, in a MA mouse who underwent transplantation. The in vivo competition experiment for MA (C) and HM cells (D). Every value represents the relative abundance of sgHerc1-mCherry AML cells in a mouse (MA, n = 11; HM, n = 10) at given timepoints. Significance was determined using paired t test. ∗∗∗∗P < .0001. MA and HM cells were normalized to pretreatment abundance in the PB. The results are from 2 independent experiments. (E) Assessment of Dck in Herc1–gene edited cells in vitro and 2 mice. BFP+ and mCherry+ cells were sorted before western blot analysis.
Figure 6.
Figure 6.
HERC1 expression has prognostic potential in human AML. (A) HERC1 expression was analyzed in a total of 34 different tumor types using the TCGA database. Statistical analysis was performed using a 1-way ANOVA followed by Holm-Šídák multiple comparisons test. ∗P ≤ .05; ∗∗P < .01; ∗∗∗P < .001; ∗∗∗∗P < .0001. (B) HERC1 expression was analyzed in a panel of 1296 different cell lines. Statistical analysis was performed as described in panel A. (C) Kaplan-Meier analysis of the BEAT-AML data set based on HERC1 expression (n = 132). (D) Kaplan-Meier analysis of the BEAT-AML data set based on HERC1 expression (n = 132). (E-F) Similar to panels C-D respectively, except that DCK was analyzed instead. Statistical analysis was performed using the Mantel-Cox test. ∗P ≤ .05; ∗∗P < .01; ∗∗∗P < .001; ∗∗∗∗P < .0001. ACC, adrenocortical carcinoma; BLCA, bladder urothelial carcinoma; BRCA, breast adenocarcinoma; CESC, cervical squamous cell carcinoma; CHOL, cholangiocarcinoma; COAD, colon adenocarcinoma; ESCA, esophageal carcinoma; GBM, glioblastoma; HNSC, head and neck squamous cell carcinoma; KICH, kidney chromophobe; KIRC, kidney renal clear cell carcinoma; KIRP, kidney renal papillary cell carcinoma; LIHC, liver hepatocellular carcinoma; LUAD, lung adenocarcinoma; LUSC, lung squamous cell carcinoma; MESO, mesothelioma; OPSCC, oropharyngeal squamous cell carcinoma; OV, ovarian cancer; PAAD, pancreatic adenocarcinoma; PCPG, pheochromocytoma and paraganglioma; PRAD, prostate adenocarcinoma; READ, rectum adenocarcinoma; SARC, sarcoma; SKCM, skin cutaneous melanoma; STAD, stomach adenocarcinoma; TGCT, testicular germ cell tumors; THCA, thyroid carcinoma; THYM, thymoma; UCEC, uterine corpus endometrial carcinoma; UCS, uterine carcinosarcoma; UVM, uveal melanoma.

References

    1. Dohner H, Wei AH, Appelbaum FR, et al. Diagnosis and management of AML in adults: 2022 recommendations from an international expert panel on behalf of the ELN. Blood. 2022;140(12):1345–1377. - PubMed
    1. Cancer Genome Atlas Research Network, Ley TJ, Miller C, et al. Genomic and epigenomic landscapes of adult de novo acute myeloid leukemia. N Engl J Med. 2013;368(22):2059–2074. - PMC - PubMed
    1. Ganzel C, Sun Z, Cripe LD, et al. Very poor long-term survival in past and more recent studies for relapsed AML patients: the ECOG-ACRIN experience. Am J Hematol. 2018;93(8):1074–1081. - PMC - PubMed
    1. Yilmaz M, Wang F, Loghavi S, et al. Late relapse in acute myeloid leukemia (AML): clonal evolution or therapy-related leukemia? Blood Cancer J. 2019;9(2):7. - PMC - PubMed
    1. SEER. 2021.

Publication types

MeSH terms