. 2024 Aug 2;9(98):eado1227.
doi: 10.1126/sciimmunol.ado1227. Epub 2024 Aug 2.

Recruited atypical Ly6G+ macrophages license alveolar regeneration after lung injury

Affiliations

Recruited atypical Ly6G+ macrophages license alveolar regeneration after lung injury

Cecilia Ruscitti et al. Sci Immunol. .

Abstract

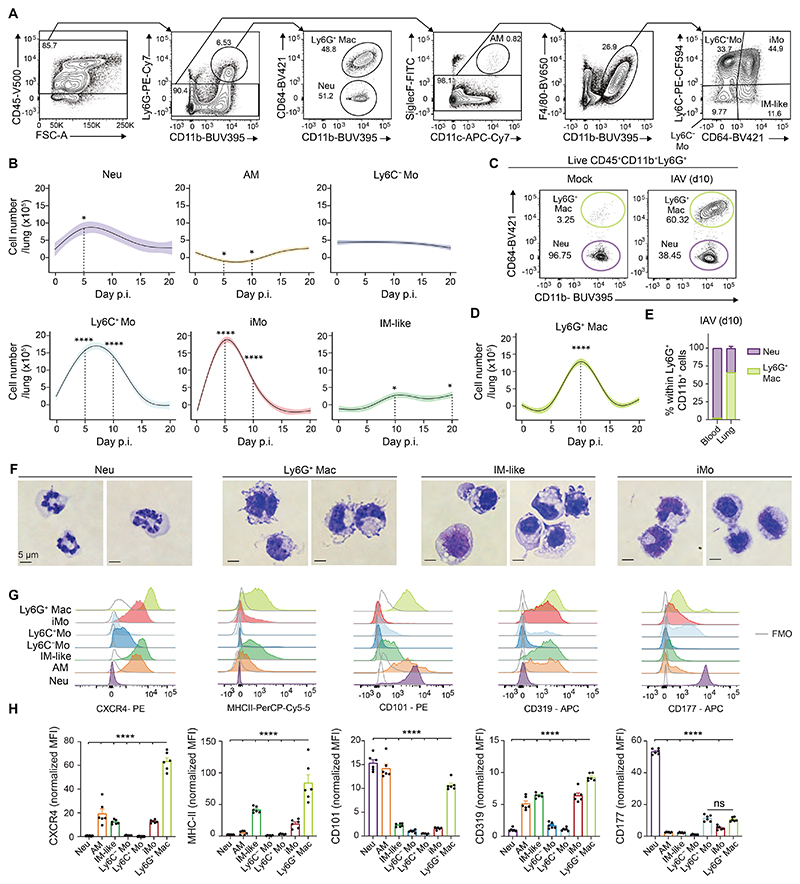
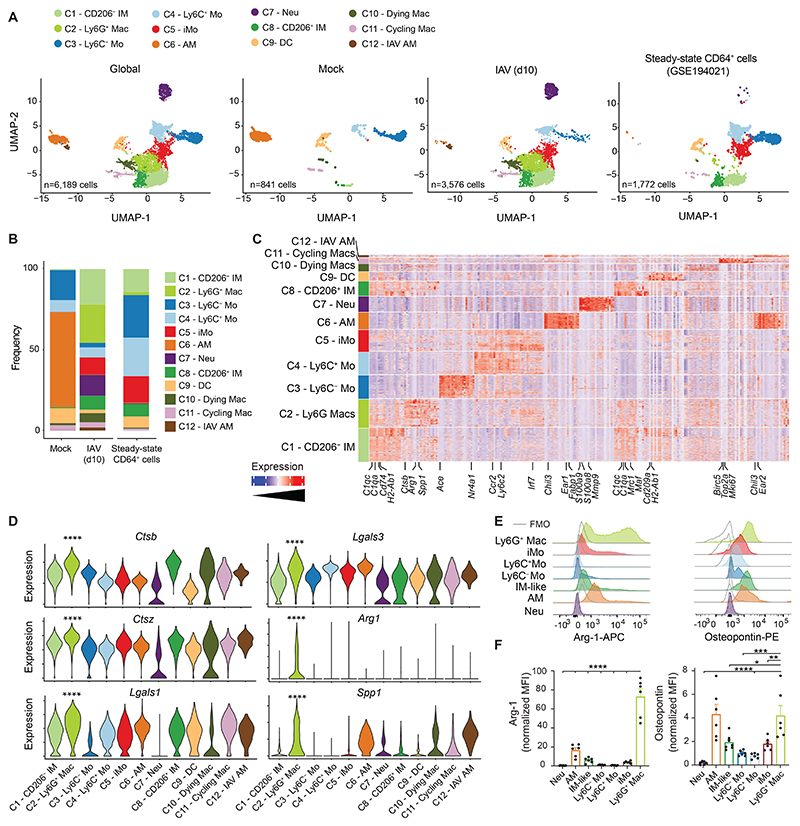
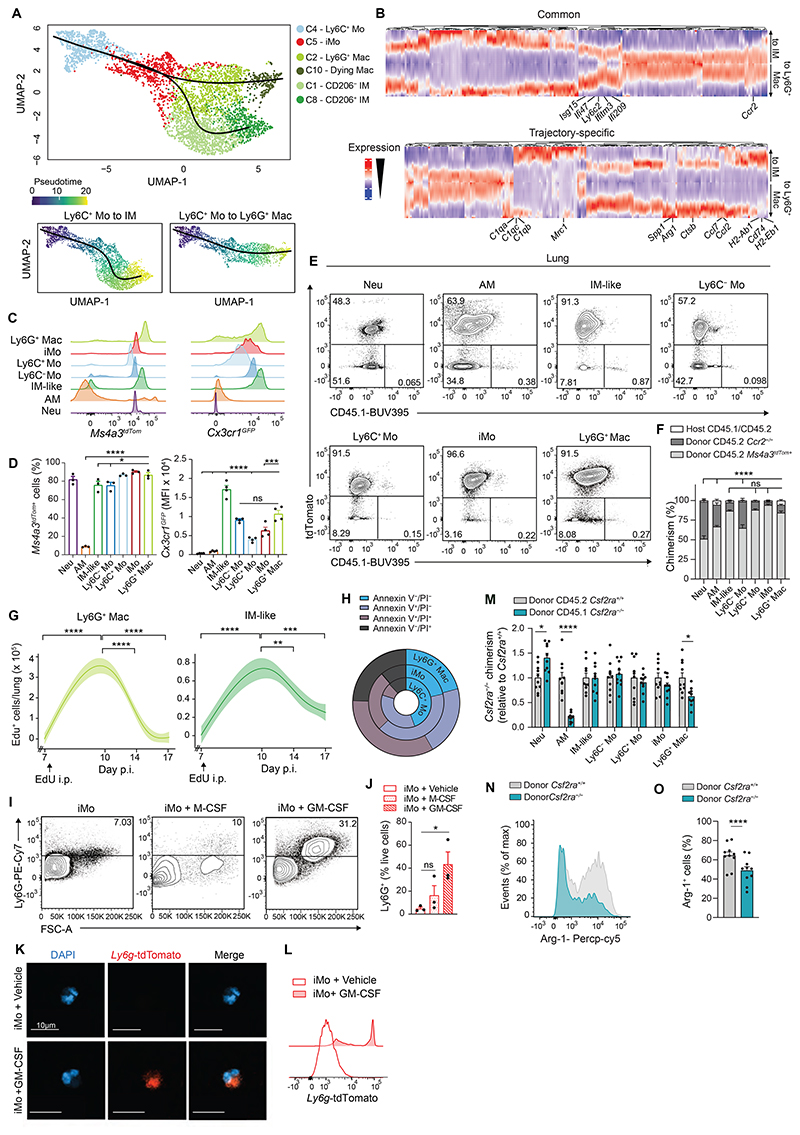
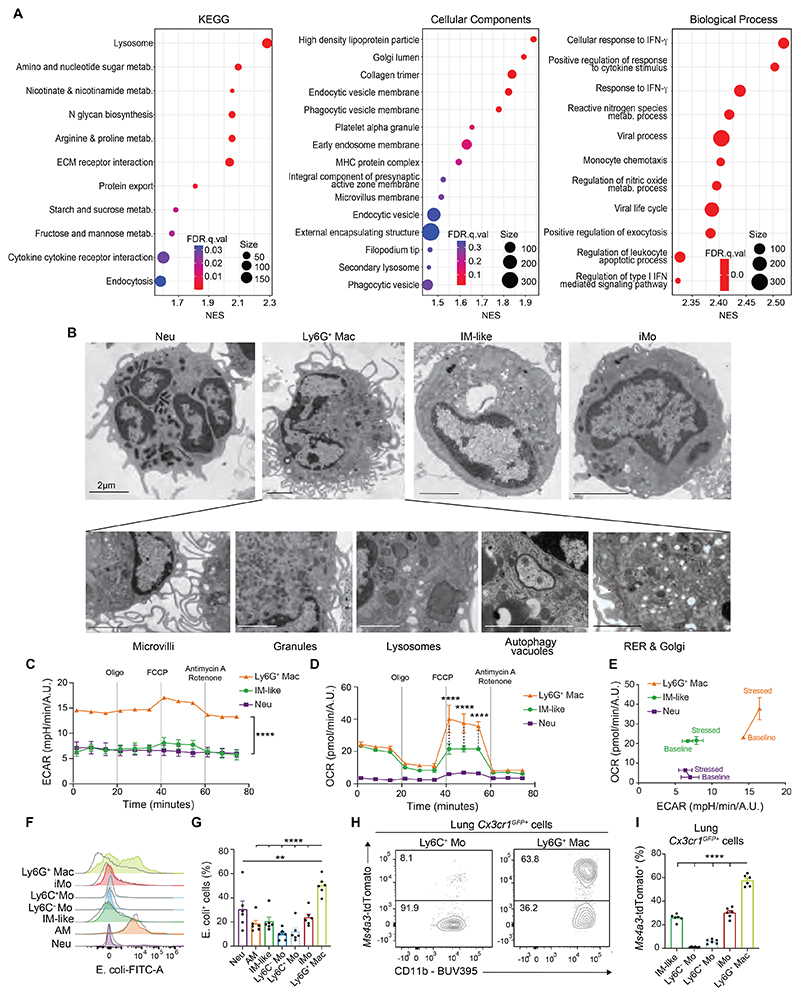
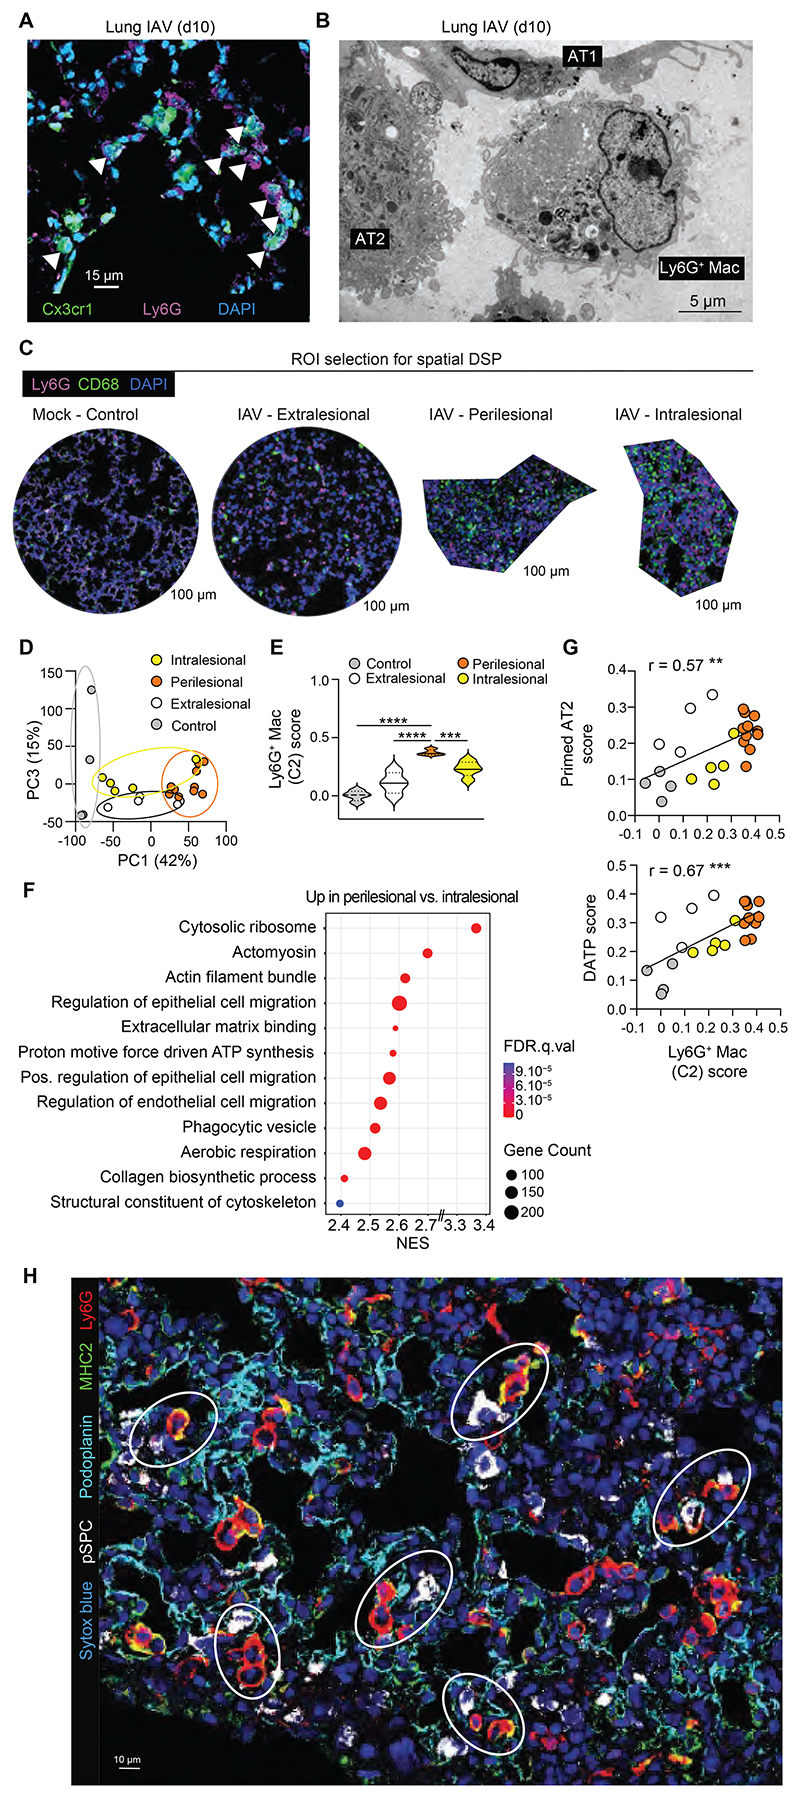
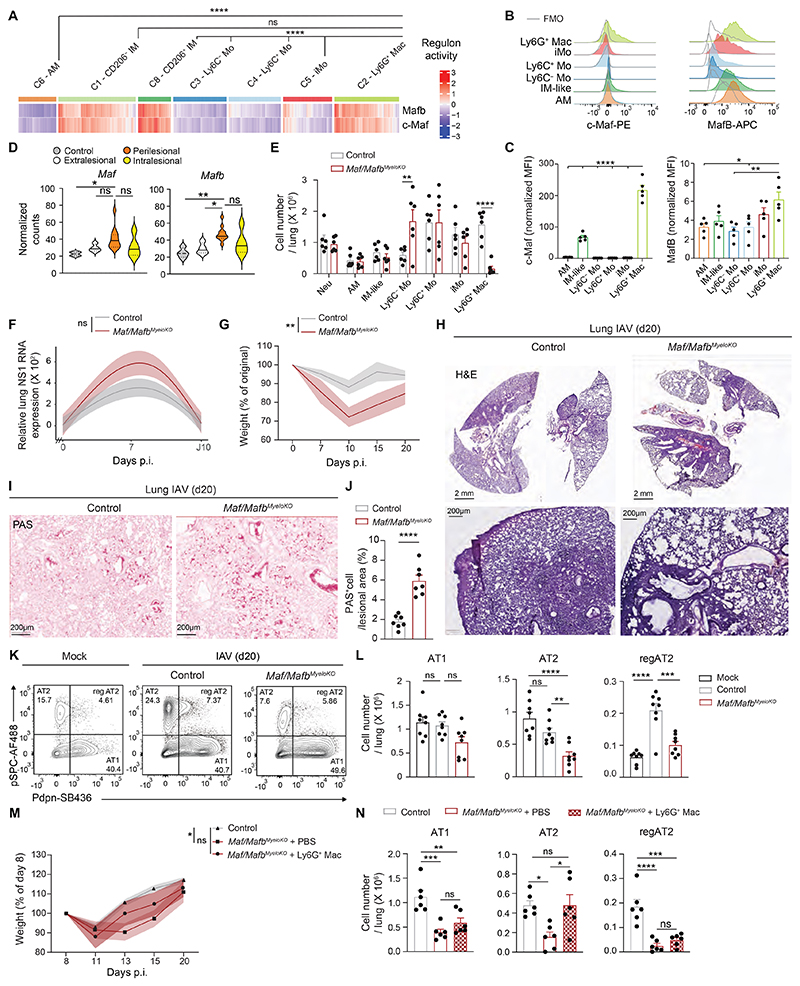
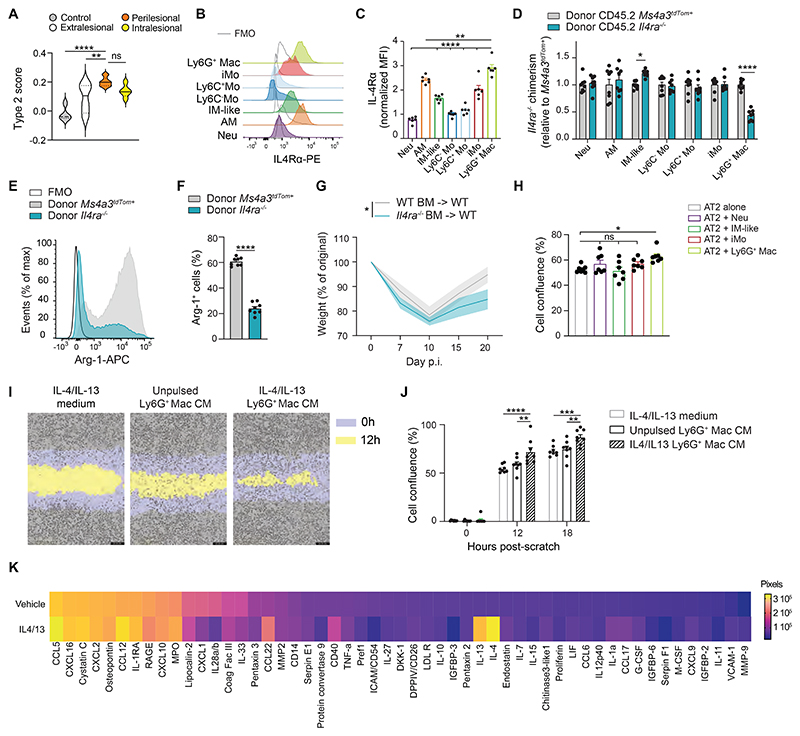
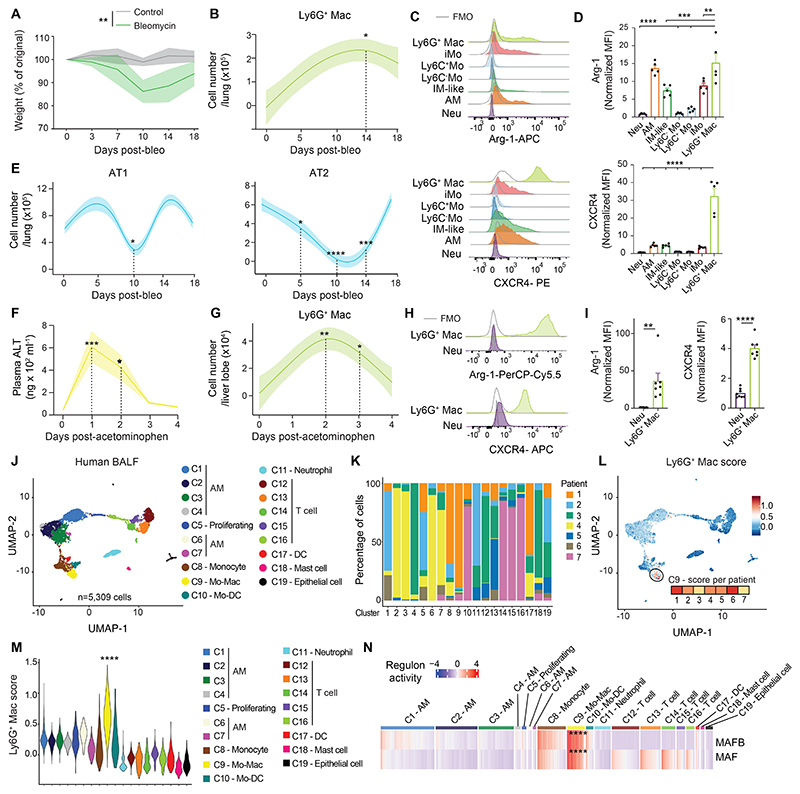
The lung is constantly exposed to airborne pathogens and particles that can cause alveolar damage. Hence, appropriate repair responses are essential for gas exchange and life. Here, we deciphered the spatiotemporal trajectory and function of an atypical population of macrophages after lung injury. Post-influenza A virus (IAV) infection, short-lived monocyte-derived Ly6G-expressing macrophages (Ly6G+ Macs) were recruited to the alveoli of lung perilesional areas. Ly6G+ Macs engulfed immune cells, exhibited a high metabolic potential, and clustered with alveolar type 2 epithelial cells (AT2s) in zones of active epithelial regeneration. Ly6G+ Macs were partially dependent on granulocyte-macrophage colony-stimulating factor and interleukin-4 receptor signaling and were essential for AT2-dependent alveolar regeneration. Similar macrophages were recruited in other models of injury and in the airspaces of lungs from patients with suspected pneumonia. This study identifies perilesional alveolar Ly6G+ Macs as a spatially restricted, short-lived macrophage subset promoting epithelial regeneration postinjury, thus representing an attractive therapeutic target for treating lung damage.


Conflict of interest statement

Competing interests

Authors declare that they have no competing interests.

Figures

Fig. 1
Fig. 1. Ly6G+ Macs culminate during the early recovery phase post-IAV infection.
(A) Representative flow cytometry gating strategy showing live CD45+CD11b+Ly6G+CD64 neutrophils (Neu), CD45+CD11b+Ly6G+CD64+ macrophages (Ly6G+ Mac), CD45+Ly6GCD11c+SiglecF+ alveolar macrophages (AM), CD45+Ly6GSiglecFF4/80+CD11b+Ly6C+CD64 monocytes (Ly6C+ Mo), CD45+Ly6GSiglecFF4/80+CD11b+Ly6CCD64 monocytes (Ly6C Mo), CD45+Ly6GSiglecFF4/80+CD11b+Ly6C+CD64+ inflammatory monocytes (iMo) and CD45+Ly6GSiglecFF4/80+CD11b+Ly6CCD64+ IM-like cells in lungs of C57BL/6 wild-type (WT) mice at day 10 post-IAV. (B) Time course of absolute numbers of Neu, AM, Ly6C Mo, Ly6C+ Mo, iMo and IM-like cells quantified by flow cytometry at days 0, 5, 10, 15 and 20 post-IAV in WT mice. (C) Representative contour plots of CD64 and CD11b expression within lung CD45+CD11b+Ly6G+ cells at day 10 p.i. in mock-infected or IAV-infected WT mice. (D) Time course of absolute numbers of Ly6G+ Macs quantified by flow cytometry, as in (B). (E) Percentage of Neu and Ly6G+ Macs within Ly6G+CD11b+ cells quantified by flow cytometry in the blood and lungs of WT mice at day 10 post-IAV. (F) Photographs of Neu, Ly6G+ Macs, IM-like cells and iMo sorted by FACS from IAV-infected WT mice at day 10 p.i.. Pictures are representative of 1 of 3 independent sorting experiments, each giving similar results. (G) Representative histograms of CXCR4, MHC-II, CD101, CD319 and CD177 expression in the indicated myeloid cell populations, quantified by flow cytometry at day 10 post-IAV in WT mice. (H) Quantification of expression of the indicated markers, as in (G). (B,D) Data show mean (centerline) ± SEM (colored area) and are pooled from 2-3 independent experiments (n=6 mice per time point); (E,H) mean + SEM and are pooled from 2 independent experiments (n=5-6 mice). (B,D,H) P values were calculated using a one-way ANOVA with Dunnett’s post hoc tests. *, P<0.05; ***, P<0.001; ****, P<0.0001. FMO, fluorescence minus one; ns, not significant; p.i., post-infection. (F) Scale bars: 5 μm.
Fig. 2
Fig. 2. Ly6G+ Macs are transcriptionally distinct from other lung myeloid cells at day 10 post-IAV.
(A) UMAP plots of scRNA-seq data depicting the transcriptional identity of FACS-sorted lung live CD45+F4/80+ and/or CD11b+ cells from mock- or IAV-infected WT mice 10 days p.i. (pooled from 5 mice per conditions), merged with a published dataset of steady-state lung monocytes and IMs (29). (B) Frequency of each cluster within each experimental condition, as in (A). (C) Heatmap depicting the single cell expression of the most upregulated genes within each cluster. (D) Expression of the indicated genes within each cluster, as depicted by violin plots (height: expression; width: abundance of cells). (E) Representative histograms of intracellular Arg-1 and osteopontin expression in the indicated lung myeloid cell populations, quantified by flow cytometry at day 10 post-IAV in WT mice. (F) Quantification of Arg-1 and osteopontin expression, as in (E). (F) Data show mean + SEM and are pooled from 2 independent experiments (n=6 mice). P values were calculated using (D) a Wilcoxon rank sum test and compare C2 vs. all other clusters or (F) a one-way ANOVA with Dunnett’s post hoc tests. *, P<0.05; **, P<0.01; ***, P<0.001; ****, P<0.0001. FMO, fluorescence minus one; p.i., post-infection.
Fig. 3
Fig. 3. IAV-triggered Ly6G+ Macs are recruited from classical monocytes and are short-lived.
(A) UMAP plot depicting the transcriptional identity and cell trajectories (top), and pseudotime trajectory values (below) of lung Ly6C+ Mo, iMo, Ly6G+ Mac, dying Mac, CD206 IM and CD206+ IM, as in Fig. 2A, evaluated by Slingshot trajectory analyses. (B) Heatmap plot depicting the differentially expressed genes along pseudotime evaluated by tradeSeq in the trajectory starting from Ly6C+ Mo and ending either in IM or in Ly6G+ Mac. (C) Representative histograms of tdTomato (left) and GFP (right) expression in the indicated myeloid cell populations, quantified by flow cytometry at day 10 post-IAV in Ms4a3tdTom and Cx3Cr1GFP mice, respectively. (D) Quantification of tdTomato+ cells (left) and GFP expression (right), as in (C). (E) Representative tdTomato and CD45.1 contour plots and (F) bar graph showing % of host, donor Ccr2−/− and donor Ms4a3tdTom+ chimerism in the indicated cell populations from lethally-irradiated CD45.1/CD45.2 mice reconstituted with a 1:1 mix of CD45.2 Ccr2−/− and Ms4a3tdTom+ BM cells, infected with IAV 4 weeks later and evaluated at day 10 post-IAV. (G) Time course of absolute numbers of EdU+ Ly6G+ Macs and EdU+ IM-like cells quantified by flow cytometry at days 7, 10, 14 and 17 post-IAV in EdU-pulsed WT mice at day 7 post-IAV. (H) Pie chart representation of the mean frequency of Annexin V and PI negative and/or positive fractions within lung Ly6C+ Mo, iMo and Ly6G+ Macs, quantified at day 10 post-IAV in WT mice. (I) Representative Ly6G and FSC contour plots and (J) bar graph showing % of Ly6G+ cells within lung iMo sorted from WT mice at day 10 post-IAV and cultured 18 hours ex vivo with vehicle, M-CSF or GM-CSF. (K) Representative confocal microscopy pictures and (L) representative flow cytometry histograms of tdTomato expression within lung iMo sorted from Ly6gtdTom mice at day 10 post-IAV and treated ex vivo with tamoxifen and GM-CSF or vehicle for 18 hours. (M) Bar graph showing donor Csf2ra−/− chimerism relative to donor Csf2ra+/+ chimerism in the indicated cell populations from thorax-protected, lethally-irradiated CD45.1/CD45.2 mice reconstituted with a 1:1 mix of CD45.1 Csf2ra−/− and CD45.2 Csf2ra+/+ BM cells, infected with IAV 4 weeks later and evaluated at day 10 post-IAV. (N) Representative histograms and (O) quantification of Arg-1+ cells (%) in Ly6G+ Macs from donor Csf2ra+/+ and Csf2ra−/− BM cells, as in (M). Data show (D,F,J,M,O) mean + SEM and (D,F) are representative of 1 of 3 independent experiments (n=3-4 mice), (J) are pooled from 3 independent sorting experiments, each dot representing one biological replicate, (M,O) are pooled from 2 independent experiments (n=10 mice); (G) mean (centerline) ± SEM (colored area) and are pooled from 2 independent experiments (n=6 mice per time point). P values compare CD45.2 donor Ccr2−/− chimerism in (F). P values were calculated using (D) a one-way ANOVA with Dunnett’s post hoc tests, (F) a two-way ANOVA with Tukey’s post hoc tests, (G,J) a one-way ANOVA with Tukey’s post hoc tests, (M) a two-way ANOVA with Sidak’s post hoc tests, (O) a two-tailed Student’s t test. *, P<0.05; ***, P<0.001; ****, P<0.0001. FMO, fluorescence minus one; ns, not significant.
Fig. 4
Fig. 4. Ly6G+ Macs exhibit an atypical morphology and possess distinct metabolic, phagocytic and efferocytic capabilities.
(A) GSEA analyses of Ly6G+ Mac (C2) profile compared to other clusters using KEGG, Cellular Components and Biological Process gene sets. The Normalized Enrichment Score (NES), False Discovery Rate (FDR) and the size of the gene set are shown for each process. (B) Representative transmission electron microscopy pictures of Neu, Ly6G+ Mac, IM-like cells and iMo FACS-sorted from lungs of WT mice at day 10 post-IAV. (C) Extracellular acidification rate (ECAR) of FACS-sorted Ly6G+ Mac, Neu and IM-like cells, as in (B), quantified at baseline and under stress over time using a Seahorse assay. (D) Oxygen consumption rate (OCR) of Ly6G+ Mac, Neu and IM-like cells, as in (C). (E) ECAR and OCR of Ly6G+ Macs, Neu and IM-like cells, as in (C,D). (F) Representative histograms of E. coli-FITC signal in the indicated myeloid cell populations, quantified by flow cytometry at day 10 post-IAV and 3 hours after i.t. injection of E. coli-FITC particles. Non-injected mice were used as controls (grey line). (G) Quantification of E. coli-FITC+ cells, as in (F). (H) Representative tdTomato and CD11b contour plots of and (I) bar graph showing % of tdTomato+ cells in the indicated Cx3cr1GFP+ donor cell populations from lethally-irradiated CD45.2 WT mice reconstituted with a 1:1 mix of CD45.2 Cx3cr1GFP+ and Ms4a3tdTom+ BM cells, infected with IAV 4 weeks later and evaluated at day 10 post-IAV. Data show (C,D) mean ± SEM and are representative of 1 of 3 independent experiments, each giving similar results; (G,I) mean + SEM and are pooled from 2 independent experiments (n=6 mice). P values (C,D) compare Ly6G+ Macs vs. IM-like cells or Neu and were calculated using a two-way ANOVA with Bonferroni’s post hoc tests; (G,I) were calculated using a one-way ANOVA with Dunnett’s post hoc tests. **, P<0.01; ****, P<0.0001. (B) Scale bars: 2 μm.
Fig. 5
Fig. 5. Ly6G+ Macs populate the alveoli of perilesional regenerating areas.
(A) Representative confocal microscopy picture of lung sections from Cx3cr1GFP mice at day 10 post-IAV, with Ly6G+ Macs identified as Ly6G+Cx3cr1GFP+ cells. (B) Representative in situ electron microscopy picture of Ly6G+ Macs in the vicinity of AT2 and AT1 cells, identified on lung sections from WT mice at day 10 post-IAV. (C) Representative examples of regions of interest (ROIs) selected on lung sections from mock- or IAV-infected WT mice at day 10 post-IAV stained with anti-Ly6G and anti-CD68 antibodies. (D) Unsupervised Principal Component (PC) analysis of the ROIs analyzed by DSP. Percentages indicate the variability explained by each component. (E) Ly6G+ Mac signature score within control, extralesional, perilesional and intralesional ROIs, as depicted by violin plots (height: scores; width: abundance of cells). (F) GSEA analysis of perilesional ROIs compared to intralesional ROIs using Cellular Components, Molecular Function and Biological Process gene sets. The Normalized Enrichment Score (NES), False Discovery Rate (FDR) and the size of the gene set are shown for each process. (G) Correlation of Ly6G+ Mac score with primed AT2 (top) and DATP (bottom) scores of the ROIs. (H) Representative picture of perilesional Ly6G+ Macs (i.e., Ly6G+MHC-II+ cells), pSPC+ AT2 and podoplanin+ AT1 identified by confocal microscopy on lung sections from WT mice at day 10 post-IAV. (A,B,H) Pictures are representative of one of 6 mice, each giving similar results. (E) P values were calculated using a one-way ANOVA with Tukey’s post hoc tests. (G) The correlation analysis used was parametric Pearson correlation coefficient. **, P<0.01; ***, P<0.001. Scale bars: (A) 15, (B) 5, (C) 100, (D) 10 μm.
Fig. 6
Fig. 6. C-Maf/MafB-dependent Ly6G+ Macs promote euplastic alveolar epithelial regeneration.
(A) Heatmap depicting predicted activities of c-Maf and MafB across lung myeloid cells post-IAV, evaluated by SCENIC analysis of the scRNA-seq data, as in Fig. 2A. (B) Representative histograms of intracellular c-Maf and MafB expression in the indicated lung myeloid cell populations, quantified at day 10 post-IAV. (C) Quantification of expression of intracellular c-Maf and MafB, as in (B). (D) Expression of Maf and Mafb within control, extralesional, perilesional and intralesional ROIs, as depicted by violin plots (height: normalized counts; width: abundance of cells). (E) Absolute numbers of the indicated lung myeloid cell populations, quantified at day 10 post-IAV in control and Maf/MafbMyeloKO mice. (F) Time course of relative lung NS1 RNA expression, assessed by RT-qPCR at days 0, 7 and 10 post-IAV in control and Maf/MafbMyeloKO mice. (G) Time course of weight, expressed as the % of the original weight at day 0 and assessed at days 0, 7, 10, 15, 20 post-IAV in control and Maf/MafbMyeloKO mice. (H-I) Representative (H) Hematoxylin & Eosin and (I) Periodic Acid Schiff (PAS, bottom) pictures of lung sections of control and Maf/MafbMyeloKO mice at day 20 post-IAV. Pictures are representative of 1 of 7 mice analyzed. (J) Percentage of PAS+ cells in lung lesional areas of control and Maf/MafbMyeloKO mice at day 20 post-IAV. (K) Representative pSPC and Pdpn contour plots of CD45-CD31-EpCam+ cells in mock- or IAV-infected mice at day 20 post-IAV. (L) Absolute numbers of pSPC+Pdpn AT2, pSPCPdpn+ AT1 and pSPC+Pdpn+ regenerating AT2 (reg AT2), quantified as in (K). (M) Time course of weight, expressed as the % of the original weight at day 8 and assessed at days 8, 11, 13, 15 and 20 post-IAV in control mice, in Maf/MafbMyeloKO mice instilled i.t. at days 8, 11, 13 and 15 post-IAV with PBS or with 3 x 10⁵ Ly6G+ Macs isolated from WT mice at day 10 post-IAV. (N) Absolute numbers of pSPC+Pdpn- AT2, pSPC-Pdpn+ AT1 and pSPC+Pdpn+ regenerating AT2 (reg AT2), quantified at day 20 post-IAV, as in (M). (C,E,J,L,N) Data show mean + SEM and are pooled from 2 independent experiments (C:n=5 mice; E,N: n=6 mice/group; J: n=7 mice/group; L: n=8 mice/group). (F,G,M) Data show mean (centerline) ± SEM (colored area) and are pooled from 2-3 independent experiments (F: n=10 mice/group; G: n=7 mice/group; M: n=6 mice/group). P values were calculated using (A) a Wilcoxon rank sum test, (C) a one-way ANOVA with Dunnett’s post hoc tests, (D,L) a one-way ANOVA with Tukey’s post hoc tests, (E,F,G,M) a two-way ANOVA with Sidak’s post hoc tests, (J) a two-tailed Student’s t test, *, P<0.05; **, P<0.01; ***, P<0.001; ****, P<0.0001. FMO, fluorescence minus one; ns, not significant; p.i., post-infection. Scale bars: (H, top) 2 mm, (H, bottom; I) 200 μm.
Fig. 7
Fig. 7. IL-4R-dependent Ly6G+ Macs release soluble factors that improve alveolar regeneration from AT2 cells.
(A) Type 2 signature score within control, extralesional, perilesional and intralesional ROIs, as depicted by violin plots (height: scores; width: abundance of cells). (B) Representative histograms of IL-4R expression in the indicated lung myeloid cell populations, quantified at day 10 post-IAV. (C) Quantification of IL-4R expression, as in (H). (D) Bar graph showing donor Il4ra−/− chimerism relative to donor Ms4a3tdTom+ chimerism in the indicated cell populations from lethally-irradiated CD45.1 mice reconstituted with a 1:1 mix of CD45.2 Il4ra−/− and Ms4a3tdTom+ BM cells, infected with IAV 4 weeks later and evaluated at day 10 post-IAV. (E) Representative histograms and (F) quantification of Arg-1+ cells (%) in Ly6G+ Macs from donor Il4ra−/− or Ms4a3tdTom+ BM cells, as in (F). (G) Time course of weight, expressed as the % of the original weight at day 0 and assessed at days 0, 7, 10, 15, 20 post-IAV in lethally-irradiated CD45.1/CD45.2 WT mice reconstituted with CD45.2 Il4ra−/− BM cells (Il4ra−/− BM -> WT) or CD45.2 WT BM cells (WT BM -> WT) and infected with IAV 4 weeks later. (H) Cell confluence of AT2 cells (MLE-12) quantified 12 hours after a standardized scratch by live cell analysis when AT2 cells were co-cultured in the presence of Neu, IM-like cells, iMo or Ly6G+ Macs isolated from the lungs of WT mice at day 10 post-IAV. (I) Representative picture of cell confluence of AT2 cells at 0 and 12 hours post-scratch when AT2 cells were cultured with IL-4/13 or with conditioned medium (CM) of unpulsed or IL-4/13-pulsed Ly6G+ Macs isolated from the lungs of WT mice at day 10 post-IAV. (J) Bar graph of cell confluence of AT2 cells quantified 0, 12 and 18 hours after scratch, as in (K). (K) Heatmap showing the proteome profiling of CM of vehicle and IL-4/13-treated Ly6G+ Macs isolated from the lungs of WT mice at day 10 post-IAV. (C,D,F,H,J) Data show mean + SEM and (C,D,F) are pooled from 2 independent experiments (C: n=6 mice; D,F: n= 8 mice); (H,J) are pooled from 3 independent sorting experiments. (G) Data show mean (centerline) ± SEM (colored area) and are pooled from 2 independent experiments (n=6 mice per group). P values were calculated using (C) a one-way ANOVA with Dunnett’s post hoc tests, (D,G) a two-way ANOVA with Sidak’s post hoc tests, (F) a two-tailed Student’s t test, (H) a one-way or (J) a two-way ANOVA with Tukey’s post hoc tests. *, P<0.05; **, P<0.01; ****, P<0.0001. FMO, fluorescence minus one; ns, not significant; p.i., post-infection.
Fig. 8
Fig. 8. Ly6G+ Macs are triggered by other insults and have a human counterpart.
(A) Time course of weight, expressed as the % of the original weight at day 0 and assessed at days 0, 3, 7, 10, 14 and 18 post-injection in C57BL/6 WT mice instilled i.t. with bleomycin (bleo). (B) Time course of absolute numbers of lung Ly6G+ Macs quantified at days 0, 5, 10, 14 and 18 post-bleo in WT mice. (C) Representative histograms of intracellular Arg-1 and CXCR4 expression in the indicated lung myeloid cell populations, quantified at day 14 post-bleo. (D) Quantification of intracellular Arg-1 and CXCR4 expression, as in (C). (E) Time course of absolute numbers of pSPC-Pdpn+ AT1 and pSPC+Pdpn- AT2, quantified at days 0, 7, 10, 14 and 18 post-bleo. (F) Amount of alanine aminotransferase (ALT) in the plasma of WT mice injected i.p. with acetaminophen at days 0, 1, 2, 3 and 4 post-injection. (G) Time course of absolute numbers of liver Ly6G+ Macs quantified at days 0, 1, 2, 3 and 4 post-acetominophen. (H) Representative histograms of intracellular Arg-1 and CXCR4 expression in liver neutrophils (Neu) and Ly6G+ Macs, quantified at day 1 post-acetominophen. (I) Quantification of intracellular Arg-1 and CXCR4 expression, as in (H). (J) UMAP plot depicting the transcriptional identity of human BALF cells collected from 7 patients suspected of pneumonia and analyzed by scRNA-seq. Annotations of cell clusters are shown. (K) Representation of each patient within each cluster, shown as frequency. (L) UMAP feature plot, as in (J), according to the Ly6G+ Mac signature score. The score level in cluster C9 is shown for each patient. (M) Ly6G+ Mac signature score of single cells within each cluster, as depicted by violin plots (height: score; width: abundance of cells). (N) Heatmap depicting predicted activities of MAFB and MAF across BALF cell populations, evaluated by SCENIC analysis of the scRNA-seq data shown in (J). (A,B,E,F,G) Data show mean (centerline) ± SEM (colored area) and are pooled from 2 independent experiments (n=5-6 mice). (D,I) Data show mean + SEM and are pooled from 2 independent experiments (n=5-7 mice). P values were calculated using (A) a two-way ANOVA, (B,D,E,F,G) a one-way ANOVA with Dunnett’s post hoc tests, (I) a two-tailed Student’s t test or (M,N) a Wilcoxon rank sum test. (M) P values compare C9 vs. all other clusters. *, P<0.05; **, P<0.01; ***, P<0.001; ****, P<0.0001. FMO, fluorescence minus one.

Similar articles

Cited by

References

    1. Kalil AC, Thomas PG. Influenza virus-related critical illness: pathophysiology and epidemiology. Crit Care. 2019;23:258. - PMC - PubMed
    1. Herold S, Becker C, Ridge KM, Budinger GRS. Influenza virus-induced lung injury: pathogenesis and implications for treatment. Eur Respir J. 2015;45:1463–1478. - PubMed
    1. Wei X, Narasimhan H, Zhu B, Sun J. Host Recovery from Respiratory Viral Infection. Annu Rev Immunol. 2023;41:277–300. - PubMed
    1. Burden of disease - Global Influenza Programme. https://www.who.int/teams/global-influenza-programme/surveillance-and-mo... .
    1. Iuliano AD, Roguski KM, Chang HH, Muscatello DJ, Palekar R, Tempia S, Cohen C, Gran JM, Schanzer D, Cowling BJ, Wu P, et al. Global Seasonal Influenza-associated Mortality Collaborator Network, Estimates of global seasonal influenza-associated respiratory mortality: a modelling study. Lancet. 2018;391:1285–1300. - PMC - PubMed

Publication types