. 2024 Aug 2;10(31):eadp0443.
doi: 10.1126/sciadv.adp0443. Epub 2024 Aug 2.

Opa1 processing is dispensable in mouse development but is protective in mitochondrial cardiomyopathy

Affiliations

Opa1 processing is dispensable in mouse development but is protective in mitochondrial cardiomyopathy

Sofia Ahola et al. Sci Adv. .

Abstract

Mitochondrial fusion and fission accompany adaptive responses to stress and altered metabolic demands. Inner membrane fusion and cristae morphogenesis depends on optic atrophy 1 (Opa1), which is expressed in different isoforms and is cleaved from a membrane-bound, long to a soluble, short form. Here, we have analyzed the physiological role of Opa1 isoforms and Opa1 processing by generating mouse lines expressing only one cleavable Opa1 isoform or a non-cleavable variant thereof. Our results show that expression of a single cleavable or non-cleavable Opa1 isoform preserves embryonic development and the health of adult mice. Opa1 processing is dispensable under metabolic and thermal stress but prolongs life span and protects against mitochondrial cardiomyopathy in OXPHOS-deficient Cox10-/- mice. Mechanistically, loss of Opa1 processing disturbs the balance between mitochondrial biogenesis and mitophagy, suppressing cardiac hypertrophic growth in Cox10-/- hearts. Our results highlight the critical regulatory role of Opa1 processing, mitochondrial dynamics, and metabolism for cardiac hypertrophy.


Figures

Fig. 1.
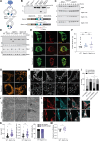
Fig. 1.. Expression of only Opa1 V1 sustains mouse development and mitochondrial structure.
(A) Illustration of Opa1 gene variants showing all four isoforms expressed in mice. Positions of processing sites S1 and S2 for Oma1 and Yme1l proteases, respectively, are indicated. (B) Twelve-week-old knock-in mice expressing only Opa1v1 develop normally and show no obvious phenotype. (C) V1 expression in tissues of wild-type (WT) and Opa1v1 mice. (D to G) Opa1v1 female and male mice have a normal life span (WT, male, n = 26; WT, female, n = 25; Opa1v1, male, n = 25; Opa1v1, female, n = 30) and show similar body weight gain as their WT littermates (n = 10). (H) Normal heart structure and normal COX/SDH activity in 12-week-old WT and Opa1v1 mice, as shown by hematoxylin and eosin (H&E) or COX/SDH staining, respectively. Scale bar, 200 μm. (I) Blue native (BN)–polyacrylamide gel electrophoresis (PAGE) from 56-week-old WT and Opa1v1 heart mitochondria showing RCC and super complexes (n = 4). (J) Representative transmission electron microscopy (TEM) images from 12-week-old WT and Opa1v1 heart tissue showing normal mitochondrial morphology and cristae structure. Scale bars, 1 μm. (K) Mitochondrial area and aspect ratio in hearts (n = 3 mice; mitochondria WT, n = 181; and Opa1v1, n = 231 in total). MTS, mitochondrial targeting sequence; TM, transmembrane domain; MPP, Mitochondrial-processing peptidase processing site; CB, cerebellum; BAT, brown adipose tissue; ns, nonsignificant.
Fig. 2.
Fig. 2.. Non-cleavable Opa1 V1 supports mitochondrial fusion in vitro.
(A) Cell-free assay to monitor Opa1 cleavage by Oma1. Scheme was created with BioRender.com. (B) C-terminally truncated Opa1 variant V1 (V1ΔC), Oma1, or Oma1E324Q was synthesized in a cell-free system with liposomes and monitored by SDS-PAGE. V1ΔC is processed by Oma1 but not Oma1E324Q in vitro. (C) Deletion of 2 (Δ2), 4 (Δ4), or 10 (Δ10) amino acids at S1 from Opa1v1ΔC blocks Oma1-mediated processing. (D) Opa1 processing in WT and Oma1−/− MEFs transiently expressing Flag-tagged Opa1 variants ± CCCP (2 hours, 20 μM). (E) Representative images of WT, Opa1v1, and Opa1v1Δ4 MEFs transiently expressing mito-mEosEM488 and mito-mEosEM561 60 min after photoactivation. Scale bars, 10 μm. (F) Quantification of fused mitochondrial area in WT (n = 13), Opa1v1 (n = 9), and Opa1v1Δ4 (n = 11) cells. (G) Mitochondrial morphology in WT and Opa1v1Δ4 MEFs. Mitochondria stained with MitoOrange and analyzed by STED nanoscopy. Scale bars, 10 μm and (zoomed in) 5 μm. (H and I) Immunofluorescence analyses of WT and Opa1v1Δ4 MEFs with ATP5b-specific antibodies ± CCCP (2 hours, 20 μM). Scale bars, 10 μm. Mitochondria of at least 100 cells were quantified per condition in n = 3 independent biological replicates and categorized in long tubules, short tubules, and fragmented. *P < 0.05 [two-way analysis of variance (ANOVA)]. (J and K) Mitochondrial ultrastructure in WT and Opa1v1Δ4 MEFs analyzed by TEM. Scale bars, 500 nm. Mitochondrial size quantification (three independent experiments; mitochondria WT, n = 122; and Opa1v1Δ4, n = 214 in total) and mitochondria-ER contact sites (three independent experiments; WT, n = 179; and Opa1v1Δ4, n = 188 total contact sites), ***P < 0.001 (unpaired t test). (L and M) Immunofluorescence analyses of WT and Opa1v1Δ4 MEFs with Tom20- and Calnexin-specific antibodies. Colocalization of ER and mitochondria indicated by white color is more prominent in Opa1v1Δ4 MEFs (inset). Scale bars, 10 μm (inset, 20 μm). *P < 0.05.
Fig. 3.
Fig. 3.. Expression of V1Δ4 allows normal mouse development and preserves mitochondrial structure in vivo.
(A) Life span of WT and Opa1v1Δ4 mice (WT, male, n = 25; WT, female, n = 30; Opa1v1Δ4, male, n = 24; and Opa1vΔ41, female, n = 30). (B) Body weight gain of WT (n = 10) and Opa1v1Δ4 mice (n = 10) mice. (C) Normal development of Opa1v1Δ4 mice. (D) Opa1v1Δ4 is expressed throughout mouse tissues and mostly accumulates as mature, non-cleaved l-Opa1. Steady-state levels of succinate dehydrogenase (SDH) subunit A (Sdha) and vinculin were monitored as controls. (E) Normal heart structure and normal COX/SDH activity in 12-week-old WT and Opa1v1Δ4 mice, as shown by H&E or COX/SDH staining, respectively. Scale bars, 200 μm. (F) BN-PAGE from 56-week-old WT and Opa1v1Δ4 heart mitochondria showing RCC and respiratory supercomplexes (n = 3). (G) Representative TEM images from 12-week-old WT and Opa1v1Δ4 heart tissue showing normal mitochondrial morphology and cristae structure. Scale bars, 100 nm. (H) Quantification of mitochondrial area and aspect ratio in hearts (n = 3 mice; mitochondria WT, n = 247; and Opa1v1, n = 405 in total; measurements from different mice are color-coded). Cristae density was calculated for 80 mitochondria from each n = 3 animals in WT and Opa1v1Δ4. The number of cristae was normalized to the mitochondrial area.
Fig. 4.
Fig. 4.. Opa1 processing is not essential upon HFD feeding or cold exposure of mice.
(A) Feeding of 54-week-old male mice for 10 weeks with a high-fat diet (HFD) did not induce Opa1 processing in various tissues. (B) HFD causes similar body weight gain in WT and Opa1v1Δ4 mice (WT, n = 6; Opa1v1Δ4, n = 6; WT HFD, n = 4; and Opa1v1Δ4 HFD, n = 5). (C) HFD increased fat mass similarly in WT and Opa1v1Δ4 animals (male mice, n = 3 to 4 in the control diet and n = 4 to 6 in HFD). (D) WT and Opa1v1Δ4 mice performed similarly in treadmill analysis (male mice, n = 7 in the control diet and n = 4 in HFD). (E) Heart/body weight ratio was similar in WT and Opa1v1Δ4 mice on both diets (standard diet, n = 4; and HFD, n = 6). (F and G) HFD did not affect mitochondrial ultrastructure in the heart as shown by TEM analysis: Four mice were analyzed on control diet (n = 529 WT and n = 658 Opa1v1Δ4 mitochondria); four WT mice on HFD (n = 458 mitochondria) and three Opa1v1Δ4 mice on HFD (n = 408 mitochondria). Scale bars, 1 μm. (H and I). Rectal body temperature during 12 hours of cold exposure (4°C) for 12-week-old male mice and body weight before and after 12 hours at 4°C (WT, n = 7; and Opa1v1Δ4, n = 5). (J and K) Cold exposure did not increase Opa1 processing in the heart or BAT (n = 3 to 4). (L) Uncoupling protein 1 (Ucp1) and Pgc1α mRNA levels were similar in BAT of WT and Opa1v1Δ4 mice (n = 3 to 6). (M) Oil Red O staining from the liver and BAT. Cold exposure decreased the fat deposits in BAT similarly in WT and Opa1v1Δ4 mice (n = 3). Scale bars, 50 μm. RT, room temperature.
Fig. 5.
Fig. 5.. Opa1 processing is protective in mitochondrial cardiomyopathy and supports hypertrophic growth.
(A and B) Opa1v1 and Opa1v1Δ4 mice were crossed with cardiac and skeletal muscle–specific knockout mice of Cox10. Loss of Opa1 processing markedly reduced the life span of Cox10−/− mice, whereas V1 preserves the life span of Cox10−/− mice. (C) Increased Opa1 processing and s-Opa1 levels in Cox10−/− and Cox10−/−Opa1v1 hearts indicating Oma1 activation. Opa1 processing is abolished in Cox10−/−Opa1v1Δ4 hearts. (D) Cox10−/− and Cox10−/−Opa1v1 mice show an increased heart/body weight ratio, which is reduced in Cox10−/−Opa1v1Δ4 mice. Heart/body weight ratios were determined in age-matched mice and are from 2-week-old (Cox10−/−Opa1v1Δ4) and from 3.5-week-old Cox10−/−Opa1v1 mice (n = 10; 5 females and 5 males). (E) Cross-sectional images from Masson’s trichrome stained hearts showing hypertrophic growth of Cox10−/− and Cox10−/−Opa1v1 hearts. Scale bars, 1 mm. (F) Close-up images (10×) of Masson’s trichrome-stained hearts. (G) Representative TEM and (H) toluidine blue images from hearts, showing the accumulation of distorted mitochondria in Cox10−/−, Cox10−/−Opa1v1, and Cox10−/−Opa1v1Δ4 heart section and additionally accumulating vacuolar structures in Cox10−/−Opa1v1Δ4 heart sections. (G) Scale bars, 1 μm. (H) Scale bars, 20 μm. (I and J) Lipidated LC3II form and p62 accumulates in Cox10−/− and, at an even higher level, in Cox10−/−Opa1v1Δ4 hearts.
Fig. 6.
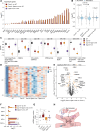
Fig. 6.. Impaired mitochondrial biogenesis in Cox10−/−Opa1v1Δ4 hearts.
(A) RNA-seq analysis of 2-week-old WT, Cox10−/−, Cox10−/−Opa1v1Δ4, and Opa1v1Δ4 mice revealed increased expression of hypertrophic genes both in Cox10−/− and Cox10−/−Opa1v1Δ4 hearts. Hypertrophic genes were annotated according to (55). (B) Analysis of heart proteomes showed significant down-regulation of mitochondrial proteins (MitoCarta3.0) in Cox10−/− and Opa1v1Δ4 hearts that was aggravated in Cox10−/−Opa1v1Δ4 hearts (n = 5). A Mann-Whitney U test was used to compare the log2 fold change (log2FC) distributions (C) K-means clustering result of the z-score–transformed LFQ intensities (six clusters). Significantly enriched Gene Ontology (GO)/MitoCarta3.0 pathways (FDR < 0.02, Fisher exact test) are listed below each cluster. The title indicates the cluster index and the number of proteins. ROS, reactive oxygen species; GSH, glutathione; FAO, fatty acid oxidation; BCAA, branched-chain amino acids; CI, complex I; CIV, complex IV; MOM, mitochondrial outer membrane; TCA, tricarboxylic acid cycle. (D) Heatmap of z-scores of transformed LFQ intensities of proteins annotated to the GO term “mitochondrial ribosome.” (E) Volcano blot of mitochondrial proteins after normalization to mitochondrial mass in Cox10−/−Opa1v1Δ4 versus Cox10−/− hearts (Mitocarta3.0). (F) Relative expression (fold change) of selected transcription factors in mouse heart RNA-seq dataset (A) shown as log2FC. (G) Relative mtDNA levels in the heart of 2-week-old mice determined by qPCR for cytB. (H) Schematic presentation of the role of Opa1 processing in cardiac hypertrophy induced by OXPHOS dysfunction. Scheme was created with BioRender.com.

References

    1. Giacomello M., Pyakurel A., Glytsou C., Scorrano L., The cell biology of mitochondrial membrane dynamics. Nat. Rev. Mol. Cell Biol. 21, 204–224 (2020). - PubMed
    1. Quintana-Cabrera R., Scorrano L., Determinants and outcomes of mitochondrial dynamics. Mol. Cell 83, 857–876 (2023). - PubMed
    1. Chan D. C., Mitochondrial dynamics and its involvement in disease. Annu. Rev. Pathol. 15, 235–259 (2020). - PubMed
    1. Yapa N. M. B., Lisnyak V., Reljic B., Ryan M. T., Mitochondrial dynamics in health and disease. FEBS Lett. 595, 1184–1204 (2021). - PubMed
    1. Alexander C., Votruba M., Pesch U. E. A., Thiselton D. L., Mayer S., Moore A., Rodriguez M., Kellner U., Leo-Kottler B., Auburger G., Bhattacharya S. S., Wissinger B., OPA1, encoding a dynamin-related GTPase, is mutated in autosomal dominant optic atrophy linked to chromosome 3q28. Nat. Genet. 26, 211–215 (2000). - PubMed

Publication types