. 2024 Aug 2;10(31):eadj3145.
doi: 10.1126/sciadv.adj3145. Epub 2024 Aug 2.

Caspase-2 is essential for proliferation and self-renewal of nucleophosmin-mutated acute myeloid leukemia

Affiliations

Caspase-2 is essential for proliferation and self-renewal of nucleophosmin-mutated acute myeloid leukemia

Dharaniya Sakthivel et al. Sci Adv. .

Erratum in

Abstract

Mutation in nucleophosmin (NPM1) causes relocalization of this normally nucleolar protein to the cytoplasm (NPM1c+). Despite NPM1 mutation being the most common driver mutation in cytogenetically normal adult acute myeloid leukemia (AML), the mechanisms of NPM1c+-induced leukemogenesis remain unclear. Caspase-2 is a proapoptotic protein activated by NPM1 in the nucleolus. Here, we show that caspase-2 is also activated by NPM1c+ in the cytoplasm and DNA damage-induced apoptosis is caspase-2 dependent in NPM1c+ but not in NPM1wt AML cells. Strikingly, in NPM1c+ cells, caspase-2 loss results in profound cell cycle arrest, differentiation, and down-regulation of stem cell pathways that regulate pluripotency including impairment of the AKT/mTORC1 pathways, and inhibition of Rictor cleavage. In contrast, there were minimal differences in proliferation, differentiation, or the transcriptional profile of NPM1wt cells lacking caspase-2. Our results show that caspase-2 is essential for proliferation and self-renewal of AML cells expressing mutated NPM1. This study demonstrates that caspase-2 is a major effector of NPM1c+ function.


Figures
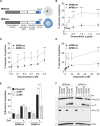
Fig. 1.
Fig. 1.. Increased sensitivity of NPM1c+ AML cells to DNA damage–induced apoptosis is caspase-2 dependent.
(A) Schematic representation showing the protein domains of NPM1 and NPM1c+. The NuLS sequence is indicated in NPM1, which is mutated to a nuclear exclusion signal (NES) in NPM1c+. The localization of NPM1 in NPM1wt cells and in NPM1c+ cells is shown in the nucleolus or cytoplasm, respectively, in blue. (B to D) OCI-AML-2 (NPM1wt) and OCI-AML-3 (NPM1c+) cells were treated with the indicated doses of doxorubicin (B), daunorubicin (C), and etoposide (D) for 16 hours. Apoptosis was assessed by flow cytometry for annexin V binding. Results are the mean of three to four independent experiments ± SD. *P < 0.05, **P < 0.01, ***P < 0.001, ****P < 0.0001 (two-way ANOVA with Sidak’s multiple comparison test). (E) NPM1wt and NPM1c+ cells and their respective CRISPR/Cas9-generated caspase-2–deficient clones (ΔC2) were treated with and without daunorubicin (Dnr, 0.5 μM) for 16 hours. The percentage of cells undergoing apoptosis was measured by flow cytometry for annexin V binding. Results are the mean of four independent experiments ± SD. ****P < 0.0001 (two-way ANOVA with Sidak’s multiple comparison test). (F) Parental NPM1wt cells, NPM1c+ cells, and the ΔC2 clones of each were treated with daunorubicin for 16 hours (0.5 μM). Lysates were immunoblotted for caspase-3 and caspase-2. Pro-C3 and Pro-C2, the pro-form of caspase-3 and caspase-2; p17, the large catalytic subunit. Actin was used as a loading control. Results are representative of three independent experiments.
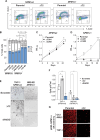
Fig. 2.
Fig. 2.. Caspase-2 is activated in the same cellular compartment as NPM1.
(A) OCI-AML-2 (NPM1wt), OCI-AML-3 (NPM1c+) [parental (P)], and CRISPR/Cas9-generated caspase-2–deficient clones (ΔC2) were fractionated into the cytosol, nucleoplasm, and nucleolus and immunoblotted for caspase-2, NPM1, and fibrillarin (nucleolus). (B) Schematic of the caspase-2 BiFC reporter construct (top) and the readout, where recruitment of the C2-Pro VN or C2-Pro VC monomers to the PIDDosome results in induced proximity and refolding of Venus (bottom). (C) NPM1wt and NPM1c+ cells stably expressing C2-Pro VC-2A-C2-Pro VN-2A-mCherry (C2-Pro BiFC) were treated with daunorubicin (0.5 μM) and imaged by confocal microscopy for 16 hours. Confocal time-lapse images show a representative NPM1wt cell (red) with induction of caspase-2 BiFC (yellow) in the nucleolus (dashed outline) and a representative NPM1c+ cell with caspase-2 BiFC induced in the cytoplasm (at the periphery). Scale bar, 5 μm. (D) Quantification of the imaging shown in (C). Percentage of cells per field positive for caspase-2 BiFC in the cytoplasm (C) or the nucleolus (No) at the start of the time lapse (resting) or that became positive during the time lapse (induced) was calculated from 20 fields of view with 10 to 20 cells per field. Error bars represent SEM. ****P < 0.0001 (one-way ANOVA with Tukey’s multiple comparison test). Results are representative of multiple independent experiments.
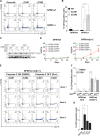
Fig. 3.
Fig. 3.. Loss of caspase-2 induces growth arrest in NPM1c+ cells.
(A) OCI-AML-2 (NPM1wt) and OCI-AML-3 (NPM1c+) parental or ΔC2 cells were harvested following a 30-min BrdU (10 μM) pulse. The proportion of cells in S, G1, and G2 phase was determined by flow cytometry. Representative flow plots gated on live cells are shown. (B) The percent of cells in each phase of the cell cycle was determined for each cell line. Results are the average of three independent experiments ± SD (two-way ANOVA with Sidak’s multiple comparison test). (C and D) Cells of each genotype were seeded at 1 × 10⁴ cells per well, and cell viability was measured by MTT at the indicated times for NPM1wt parental and ΔC2 cells (C) and NPM1c+ parental and ΔC2 cells (D). Results are the average of three independent experiments ± SD (unpaired t test with Holm-Sidak’s multiple comparison test). (E) THP-1 (NPM1wt) and IMS-M2 (NPM1c+) cells (2 × 10⁵) were electroporated with Cas9RNP with a scramble sgRNA or sgRNAs targeting caspase-2 or RAIDD. Representative bright-field images taken 1 week later are shown. Scale bar, 400 μm. (F) Viable cells were counted 1 week after electroporation of the Cas9 RNPs. Results represent the average cell counts resulting from three independent Cas9RNP electroporations ± SD. *P < 0.05, **P < 0.01, ***P < 0.001, ****P < 0.0001 (two-way ANOVA with Sidak’s multiple comparison test). (G) NPM1wt and NPM1wtΔC2 OCI-AML-2 or THP-1 cells transduced with NPM1c+ linked to an mCherry reporter (pRRL.NPM1c+-2A-mCherry) were imaged 2 weeks after antibiotic selection. The viable cells are shown in red. Scale bar, 100 μm.
Fig. 4.
Fig. 4.. Loss of caspase-2 induces NPM1c+-dependent differentiation.
(A) Cell surface expression of CD34 and CD14 was measured in OCI-AML-2 (NPM1wt) and OCI-AML-3 (NPM1c+) parental or ΔC2 cells cultured for 2 weeks by flow cytometry. Representative flow plots are shown. (B) Percentage of cells expressing CD14. Results are the average of three independent experiments ± SD. ***P < 0.001, ****P < 0.0001 (two-way ANOVA with Sidak’s multiple comparison test). (C) NPM1wtΔC2 or NPM1wtΔC2[c+] cells expressing a Tet-repressible caspase-2 (TetOFF-C2WT) or a Tet-repressible catalytically inactive caspase-2 (TetOFF-C2C/A) were treated with doxycycline (2 μg/ml) for 16 hours to repress caspase-2 expression. Lysates were immunoblotted for caspase-2 and actin as a loading control. (D) NPM1wtΔC2-TetOFF-C2WT or NPM1wtΔC2[c+]-TetOFF-C2WT cells were grown in DMSO (C2ON) or doxycycline (2 μg/ml, C2OFF) for 3 weeks. Cell surface CD14 and CD34 expression was measured once a week by flow cytometry. Results represent the average of three independent experiments ± SD. **P < 0.01, ****P < 0.0001 (two-way ANOVA with Sidak’s multiple comparison test). (E) Representative flow plots from (D) are shown (see also fig. S4D). (F) NPM1wtΔC2 or NPM1wtΔC2[c+] cells expressing a TetOFF-C2WT or TetOFF-C2C/A were grown in DMSO or doxycycline (2 μg/ml) for 1 week. Cell surface expression of CD14 was measured by flow cytometry. Results are the average of three independent experiments ± SD. ***P < 0.001 (two-way ANOVA with Sidak’s multiple comparison test). (G) IMS-M2 cells were incubated with the indicated selective caspase-2 pentapeptide inhibitors (20 μM). Cell surface expression of CD14 was measured by flow cytometry 24 hours later. Results are the average of three independent experiments ± SD. *P < 0.05, **P < 0.01 (one-way ANOVA with Dunnett’s multiple comparison test).
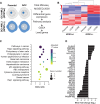
Fig. 5.
Fig. 5.. Loss of caspase-2 in NPM1c+ cells down-regulates pathways regulating pluripotency.
(A) Experimental design for total RNA sequencing and analysis of DEGs from parental OCI-AML-2 (NPM1wt) and OCI-AML-3 (NPM1c+) and their respective caspase-2–deficient (ΔC2) cells. (B) DEGs between the parental NPM1wt and NPM1c+ and their respective ΔC2 transcriptomes are shown by heatmap. Genes with more than log5 fold changes are shown. Decreased expression is shown in blue, and increased expression is shown in red. (C) Total RNAseq data were analyzed with ENRICHR to identify genes involved in the indicated KEGG term biological processes that are most significantly differentially regulated in NPM1c+ parental and ΔC2 cells. The size of the dots represents the number of genes associated with each biological pathway. The color of the dots represents the significance (adjusted P value). (D) Mean log2 fold change of significant DEGs between NPM1c+ parental and ΔC2 cells involved in the KEGG term pathways that regulate pluripotency of stem cells [the most significantly down-regulated pathway (see Table 1)]. Gene names in bold are referred to in the text.
Fig. 6.
Fig. 6.. Caspase-2 regulates the mTORC and WNT pathways in NPM1c+ cells.
(A) RPPA analysis was carried out on OCI-AML-2 (NPM1c+) parental and ΔC2 cells. Signal intensities were normalized and filtered as described in Materials and Methods (see data file S1). The heatmap shows z scores of three biological replicates of parental NPM1c+ cells and each ΔC2 clone with q > 0.01. Up-regulated proteins are shown in red, and down-regulated proteins are shown in blue. Proteins in the mTORC1/AKT pathway are labeled in blue text, and proteins in the Wnt signaling pathway are labeled in green text. (B) OCI-AML-2 (NPM1wt) and OCI-AML-3 (NPM1c+) parental or ΔC2 cells were left untreated or treated with IL-2 for 16 hours. Lysates were harvested and immunoblotted for phosphorylated AKT (p-AKT) and total AKT. Actin was used as the loading control. The spacer lane was omitted from the p-AKT blot. The red line serves to align the remaining lanes. (C to E) The indicated cell lines were treated with or without IGF-1 (10 ng/ml) (C to E) or Wnt (5.0 nM) (E) for 16 hours. Lysates were harvested and immunoblotted for the indicated proteins with actin as a loading control. (F and G) Unstimulated OCI-AML-2 (NPM1wt) and OCI-AML-3 (NPM1c+) parental or ΔC2 cells were immunoblotted for the indicated proteins with actin or GAPDH used as a loading control. Experiments shown in (B) to (G) are each representative of two to three independent experiments.

Update of

References

    1. A. M. Noone, N. Howlader, M. Krapcho, D. Miller, A. Brest, M. Yu, J. Ruhl, Z. Tatalovich, A. Mariotto, D. R. Lewis, H. S. Chen, E. J. Feuer, K. A. Cronin, Eds. SEER Cancer Statistics Review, 1975-2015 (National Cancer Institute, 2018); https://seer.cancer.gov/csr/1975_2015/.
    1. Falini B., Mecucci C., Tiacci E., Alcalay M., Rosati R., Pasqualucci L., la Starza R., Diverio D., Colombo E., Santucci A., Bigerna B., Pacini R., Pucciarini A., Liso A., Vignetti M., Fazi P., Meani N., Pettirossi V., Saglio G., Mandelli F., Lo-Coco F., Pelicci P. G., Martelli M. F., Cytoplasmic nucleophosmin in acute myelogenous leukemia with a normal karyotype. N. Engl. J. Med. 352, 254–266 (2005). - PubMed
    1. Grisendi S., Mecucci C., Falini B., Pandolfi P. P., Nucleophosmin and cancer. Nat. Rev. Cancer 6, 493–505 (2006). - PubMed
    1. Arber D. A., Orazi A., Hasserjian R. P., Borowitz M. J., Calvo K. R., Kvasnicka H. M., Wang S. A., Bagg A., Barbui T., Branford S., Bueso-Ramos C. E., Cortes J. E., Dal Cin P., DiNardo C. D., Dombret H., Duncavage E. J., Ebert B. L., Estey E. H., Facchetti F., Foucar K., Gangat N., Gianelli U., Godley L. A., Gökbuget N., Gotlib J., Hellström-Lindberg E., Hobbs G. S., Hoffman R., Jabbour E. J., Kiladjian J. J., Larson R. A., le Beau M. M., Loh M. L. C., Löwenberg B., Macintyre E., Malcovati L., Mullighan C. G., Niemeyer C., Odenike O. M., Ogawa S., Orfao A., Papaemmanuil E., Passamonti F., Porkka K., Pui C. H., Radich J. P., Reiter A., Rozman M., Rudelius M., Savona M. R., Schiffer C. A., Schmitt-Graeff A., Shimamura A., Sierra J., Stock W. A., Stone R. M., Tallman M. S., Thiele J., Tien H. F., Tzankov A., Vannucchi A. M., Vyas P., Wei A. H., Weinberg O. K., Wierzbowska A., Cazzola M., Döhner H., Tefferi A., International Consensus Classification of Myeloid Neoplasms and Acute Leukemias: Integrating morphologic, clinical, and genomic data. Blood 140, 1200–1228 (2022). - PMC - PubMed
    1. Martelli M. P., Gionfriddo I., Mezzasoma F., Milano F., Pierangeli S., Mulas F., Pacini R., Tabarrini A., Pettirossi V., Rossi R., Vetro C., Brunetti L., Sportoletti P., Tiacci E., di Raimondo F., Falini B., Arsenic trioxide and all-trans retinoic acid target NPM1 mutant oncoprotein levels and induce apoptosis in NPM1-mutated AML cells. Blood 125, 3455–3465 (2015). - PubMed

Publication types