. 2024 Aug 19;59(16):2035-2052.e10.
doi: 10.1016/j.devcel.2024.07.004. Epub 2024 Aug 1.

Sestrin2 drives ER-phagy in response to protein misfolding

Affiliations

Sestrin2 drives ER-phagy in response to protein misfolding

Chiara De Leonibus et al. Dev Cell. .

Abstract

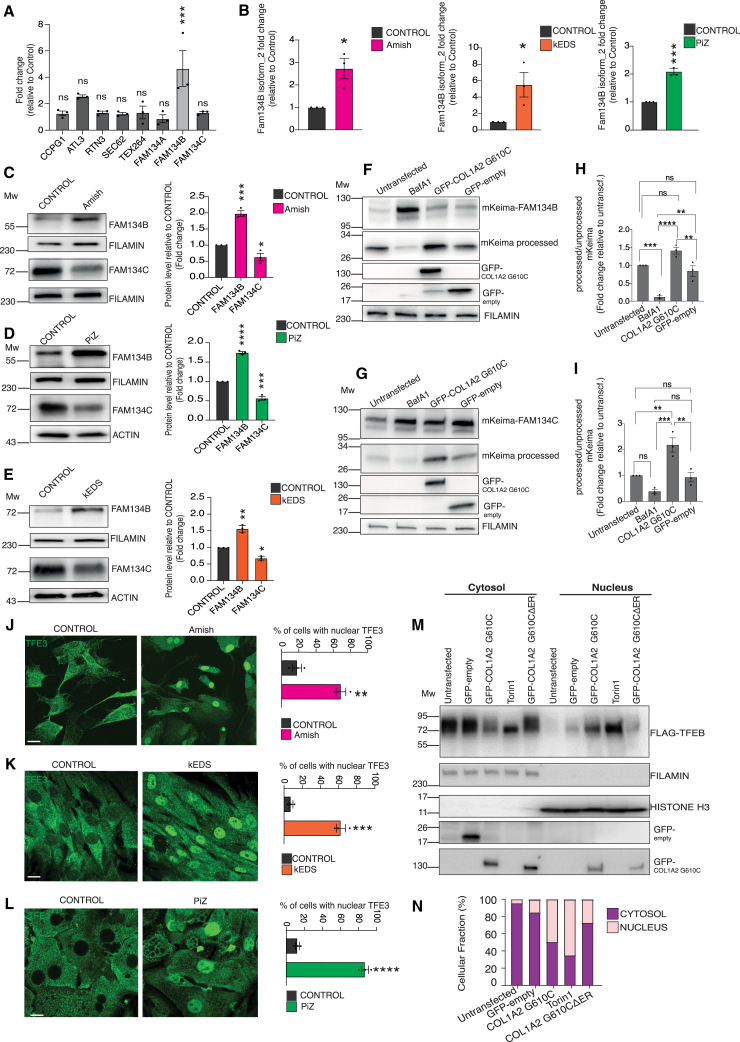
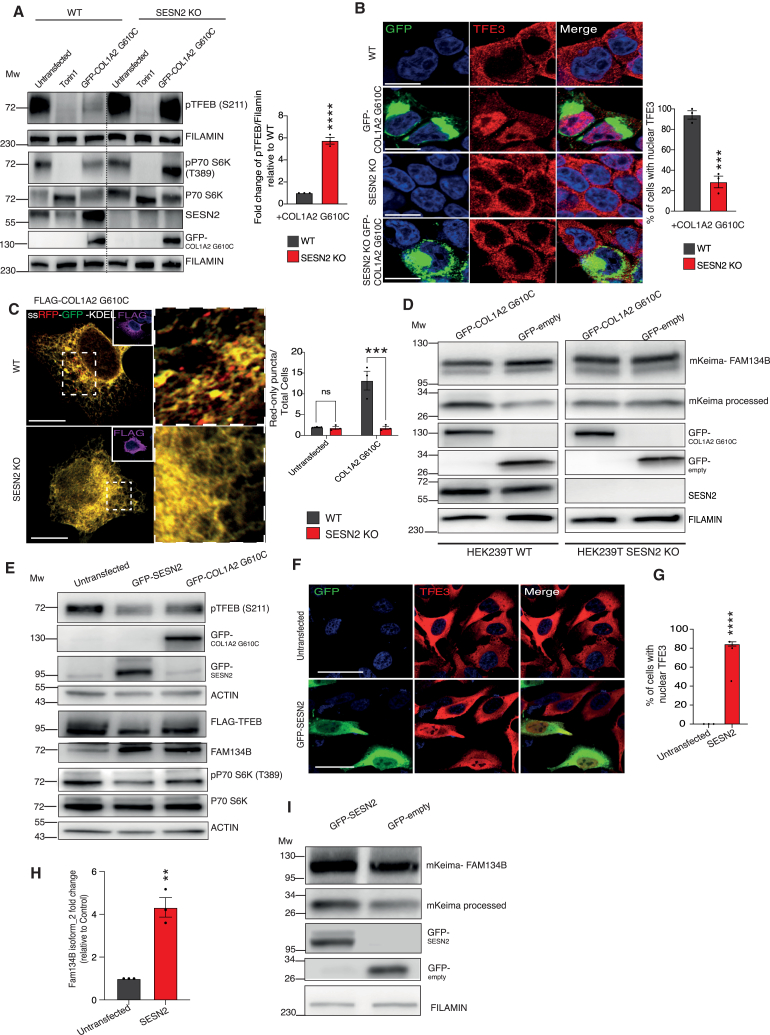
Protein biogenesis within the endoplasmic reticulum (ER) is crucial for organismal function. Errors during protein folding necessitate the removal of faulty products. ER-associated protein degradation and ER-phagy target misfolded proteins for proteasomal and lysosomal degradation. The mechanisms initiating ER-phagy in response to ER proteostasis defects are not well understood. By studying mouse primary cells and patient samples as a model of ER storage disorders (ERSDs), we show that accumulation of faulty products within the ER triggers a response involving SESTRIN2, a nutrient sensor controlling mTORC1 signaling. SESTRIN2 induction by XBP1 inhibits mTORC1's phosphorylation of TFEB/TFE3, allowing these transcription factors to enter the nucleus and upregulate the ER-phagy receptor FAM134B along with lysosomal genes. This response promotes ER-phagy of misfolded proteins via FAM134B-Calnexin complex. Pharmacological induction of FAM134B improves clearance of misfolded proteins in ERSDs. Our study identifies the interplay between nutrient signaling and ER quality control, suggesting therapeutic strategies for ERSDs.

Keywords: ER storage disorders; ER-phagy; FAM134B; TFEB; alpha(1)-antitrypsin Z (alpha(1)-ATZ); autophagy; collagen; endoplasmic reticulum; mTORC1; quality control.


Conflict of interest statement

Declaration of interests The authors declare no competing interests.

Figures

None
Graphical abstract
Figure 1
Figure 1
ER storage activates ER-phagy (A) Schematic representation of the ssRFP-GFP-KDEL ER-phagy reporter composed of an N-terminal ER signal sequence, a tandem monomeric RFP and GFP, and the ER retention sequence KDEL. Delivery of ssRFP-GFP-KDEL to lysosomes quenches the GFP signal, while RFP is relatively stable. Quantification of the red-only puncta provides a measure of ER-phagy induction. (B) Representative fluorescence microscopy of primary osteoblasts derived from wild-type (control) and Amish mice expressing the ssRFP-GFP-KDEL plasmid. Scale bars, 10 μm. (C) Bar graph showing the ratio of red-only puncta/total cells in (B). Mean ± standard error of mean (SEM) of N = 3 biological replicates. n = 33 cells were counted. Student’s unpaired t test: ∗∗∗p < 0.0005. (D) Representative fluorescence microscopy of primary hepatocytes, isolated from control and PiZ mice, transfected with ssRFP-GFP-KDEL. Scale bars, 10 μm. (E) Bar graph showing the ratio of red-only puncta/total cells in (D). Mean ± SEM of N = 3 biological replicates. n = 17 cells were counted. Student’s unpaired t test: ∗∗p < 0.005. (F) Representative fluorescence microscopy of primary human fibroblasts, isolated from control subjects and kEDS patients, transfected with ssRFP-GFP-KDEL. Scale bars, 10 μm. (G) Bar graph showing the ratio of red-only puncta/total cells in (F). Mean ± SEM of N = 3 biological replicates of n = 21 cells. Student’s unpaired t test: p < 0.05. (H) GFP-COL1A2 G610C accumulates as a misfolded protein in the ER. In the absence of the N-terminal signal peptide the GFP-COL1A2 G610CΔER accumulates as a misfolded protein in the cytosol. (I) Immunofluorescence analysis of GFP-COL1A2 G610C and GFP-COL1A2 G610CΔER by confocal microscopy. COL1A2 G610C (GFP, green) shows co-localization with the ER-marker Calnexin (red). Conversely, COL1A2 G610CΔER shows a cytosolic localization. Scale bars, 5 μm. (J) Immunofluorescence staining of CLIMP63 (green) and lysosomes (LAMP1, red) in U2OS cells transfected with GFP-COL1A2 G610C or GFP-COL1A2 G610CΔER, or GFP-empty plasmid as a transfection control. Starvation with Hank's Balanced Salt Solution (HBSS) was used as a positive control for ER-phagy induction. Cells were treated with BafA1 (100 nM, 4 h). Scale bars, 5 μm. Insets show magnification of CLIMP63 localization in lysosomes. (K) Bar graph showing data quantification of (J). Mean ± SEM of N = 3 independent experiments. n = 18 cells were counted. One-way analysis of variance (ANOVA) with Dunnett’s multiple comparisons test: p < 0.05; ∗∗p < 0.005; ns ≥ 0.05.
Figure 2
Figure 2
ER storage induces TFE3/TFEB nuclear translocation and transcriptional induction of FAM134B (A) Quantitative real-time PCR analysis of ER-phagy receptors in U2OS cells expressing COL1A2 G610C. Values were normalized to HPRT gene expression and shown as fold change relative to untransfected cells (control). Mean ± standard error of mean (SEM) of N = 3 biological replicates. One-way analysis of variance (ANOVA) with Dunnett’s multiple comparisons test: ∗∗∗p < 0.0005; ns ≥ 0.05. (B) Quantitative real-time PCR analysis of FAM134B isoform 2 in Amish, osteoblasts, kEDS fibroblasts, and PiZ hepatocytes. Values are normalized to S16 (osteoblasts and hepatocytes) and HPRT (fibroblasts) and shown as fold change relative to their corresponding controls. Mean ± SEM of N = 3 biological replicates. Student’s unpaired t test: p < 0.05; ∗∗∗p < 0.0005. (C–E) Western blot analysis (left) of FAM134B and FAM134C proteins in control and Amish, osteoblasts (C), PiZ hepatocytes (D), and kEDS fibroblasts (E), and their corresponding controls. FILAMIN and actin were used as a loading control. Bar graphs showing mean ± SEM of N = 3 biological replicates. One-way ANOVA with Dunnett’s multiple comparisons test: p < 0.05; ∗∗p < 0.005, ∗∗∗p < 0.0005; ∗∗∗∗p < 0.0001. (F–I) Western blot analysis and quantification of cells expressing mKeima-FAM134B (F) and mKeima-FAM134C (G), transfected with GFP-COL1A2 G610C or GFP-empty plasmid (control) and treated with BafA1 (50 nM, 12 h) where indicated. FILAMIN was used as a loading control. Bar graphs showing quantification of mKeima/mKeima-FAM134B (H) and FAM134C (I) ratio relative to untransfected cells. Mean ± SEM of N = 3 biological replicates. One-way ANOVA with Tukey’s multiple comparisons test: ∗∗p < 0.005; ∗∗∗p < 0.0005; ∗∗∗∗p < 0.0001; ns ≥ 0.05. (J–L) Immunofluorescence analysis (left panels) of TFE3 (green) subcellular localization in control and Amish, primary osteoblasts (J), human kEDS fibroblasts (K), and PiZ hepatocytes (L) and their corresponding controls. Scale bars, 20 μm. Bar graphs showing quantification of the percentage of cells with nuclear TFE3 (right). Mean ± SEM of N = 3 independent experiments. n = 245 control and Amish osteoblasts; n = 312 control and kEDS fibroblasts; n = 421 control and PiZ hepatocytes. Student’s unpaired t test: ∗∗p < 0.005; ∗∗∗p < 0.0005; ∗∗∗∗p < 0.0001. (M) Nuclear and cytosolic levels of FLAG-TFEB in U2OS cells transfected with GFP-COL1A2 G610C and GFP-COL1A2 G610CΔER. GFP-empty plasmid was used as control. Torin1 was used as a positive control. FILAMIN and Histone H3 were used as a loading control. (N) Quantification the data in (M). TFEB localization was expressed as % of cytosolic and nuclear fractions relative to total. Mean of N = 4 independent experiments.
Figure 3
Figure 3
ER storage activates ER-phagy via TFEB/TFE3-mediated transcriptional induction of FAM134B (A–C) Quantitative real-time PCR analysis showing transcriptional levels of FAM134B isoform 2 in control and TFEB/TFE3 DKO cell lines expressing the indicated proteins. Values were normalized to HPRT and shown as fold change relative to untransfected cells (control). Mean ± standard error of mean (SEM) of N = 3 biological replicates. One-way analysis of variance (ANOVA) with Šídák’s multiple comparisons test: p < 0.05; ∗∗p < 0.005; ∗∗∗p < 0.0005; ns ≥ 0.05. (D) Venn diagram showing specific and common genes identified by transcriptomic analysis performed in WT and TFEB/3 DKO RCS cells with or without the expression of the COL2A1 R789C mutant protein. (E) Heatmap on 24 lysosomal genes induced by COL2A1 R789C overexpression in a TFE3- and TFEB-dependent manner. (F) Immunofluorescence analysis of FLAG-COL2A1 R789C (blue inset) in WT RCS, FAM134B KO RCS, and TFEB/3 DKO RCS overexpressing ER-phagy tandem reporter (ssRFP-GFP-KDEL). HBSS treatment was used as a positive control. Bottom insets show magnification of the boxed areas. Scale bars, 5 μm. (G) Quantification of the data in (F). The bar graph represents mean ± standard error of mean (SEM) of N = 3 independent experiments. n = 21 cells were counted for each condition. One-way ANOVA with Šídák’s multiple comparisons test: ∗∗∗∗p < 0.0001; ns ≥ 0.05. (H) Western blot analysis in WT, FAM134B KO, and TFEB/3 DKO RCS cells expressing mKeima-RAMP4, transfected with GFP-COL1A2 G610C or GFP-empty plasmid (control). Actin was used as a loading control. (I) Immunofluorescence staining of Calnexin (green) and lysosomes (LAMP1, red) in U2OS cells transfected with GFP-COL1A2 G610C or GFP-COL1A2 G610CΔER, or GFP-empty plasmid (control). Cells were treated with BafA1 (100 nM, 4 h). Scale bars, 5 μm. Insets show magnification of Calnexin localization in lysosomes. Bar graph (bottom) showing data quantification of Calnexin fluorescence intensity in lysosomes. Mean ± SEM of N = 3 independent experiments. n = 21 cells were counted. One-way ANOVA with Dunnett’s multiple comparisons test: ∗∗p < 0.005; ns ≥ 0.05. (J and K) Western blot analysis showing immunoprecipitation (IP) experiment of endogenous FAM134B in U2OS cells overexpressing GFP-COL1A2 G610C (J) or GFP-TFEB (K). BafA1 (200 nM, 4 h) was supplied where indicated. Actin was used as a loading control. See also Tables S1 and S3.
Figure 4
Figure 4
ER storage promotes TFEB nuclear translocation via the upregulation of the leucine sensor Sestrin2 (A) Venn diagram showing that 73 genes were commonly regulated in RCS and HeLa cells upon COL2A1 R789C and COL1A2 G610C expression, respectively. (B) Heatmap of the genes whose silencing significantly reverted TFEB nuclear localization in HeLa GFP-TFEB cells expressing COL1A2 G610C. A low score of nuclear TFEB localization is represented in violet, a high score in pink. Values represent the mean of N = 8 biological replicates. (C)Quantitative real-time PCR analysis of Sestrin2 (SESN2) in Amish, PiZ, and kEDS primary cells. Values were normalized to CYC (Amish and PiZ) and HPRT (kEDS and PiZ) gene expression and shown as fold change relative to their corresponding controls. Mean ± standard error of mean (SEM) of N = 3 biological replicates in Amish, N = 4 biological replicates in PiZ, and N = 3 biological replicates in kEDS. Student’s unpaired t test: p < 0.05; ∗∗p < 0.005. (D–F) Western blot analysis of (D) phospho-TFEB (S211) and phosho-P70S6K (T389) in HeLa cells and (E) phospho-ULK1 (S757) in U2OS cells expressing COL1A2 G610C. Torin 1 was used as a positive control. Actin and FILAMIN were used as loading controls. In (F), the bar graphs show quantification of the indicated proteins as fold change relative to untransfected cells. Mean ± SEM of N = 3 independent experiments. One-way analysis of variance (ANOVA) with Dunnett’s multiple comparisons test: p < 0.05; ∗∗p < 0.005; ∗∗∗p < 0.0005; ∗∗∗∗p < 0.0001. (G) Immunofluorescence staining of mTORC1 (green) and lysosomes (LAMP1, red) in U2OS cells expressing GFP-COL1A2 G610C. Inset, GFP-COL1A2 G610C immunostaining. Small right panels are magnifications of the boxed areas. Scale bars, 10 μm. The bar graph shows co-localization of mTORC1 with LAMP1 (expressed as Manders’ coefficient). Mean ± SEM of N = 3 independent experiments. n = 20 control and GFP-COL1A2 G610C transfected cells. Student’s unpaired t test: ∗∗p < 0.005. (H) Subcellular localization of endogenous TFE3 (red) in WT and KICSTOR KO HEK293T cells transfected with GFP-COL1A2 G610C (green) or treated with Torin 1. Scale bars, 20 μm. The bar graph (bottom) shows quantification of cells with nuclear TFE3. Mean ± SEM of N = 3 independent experiments. n = 40 cells. One-way ANOVA with Šídák’s multiple comparisons test: ∗∗∗∗p < 0.0001; ns ≥ 0.05. (I) Representative immunofluorescence of FLAG-TFEB (red) subcellular localization in U2OS cells expressing GFP-COL1A2 G610C cells (green) without or with leucine (1.2 mM, 1 h). The dotted circle indicates nuclei. Scale bars, 7 μm. The bar graph shows quantification of % cells with nuclear TFEB relative to control. Mean ± SEM of N = 3 independent experiments. n = 40 cells for each treatment. One-way ANOVA with Dunnett's multiple comparisons test: ∗∗∗p < 0.0005; ns ≥ 0.05. (J) Immunofluorescence analysis of TFE3 (green) subcellular localization in PiZ hepatocytes untreated (control) or treated with leucine (4 mM, 3 h). The dotted circle indicates nuclei. Scale bars, 20 μm. Bar graph showing quantification of the percentage of cells with nuclear TFE3 (right). Mean ± SEM of N = 3 independent experiments. n = 292 control and PiZ hepatocytes. Student’s unpaired t test: ∗∗∗∗p < 0.0001. (K) Representative fluorescence microscopy analysis of PiZ hepatocytes transfected with the ssRFP-GFP-KDEL plasmid, left untreated (control) or treated with leucine (4 mM, 3 h). Scale bars, 10 μm. Bar graph shows the ratio of red-only puncta/total cells. Mean ± SEM of N = 3 biological replicates. n = 19 control and PiZ hepatocytes. Student’s unpaired t test: ∗∗∗p < 0.0005. See also Tables S4 and S5.
Figure 5
Figure 5
ER storage response activates ER-phagy via Sestrin2 induction (A) Western blot analysis of phosho-TFEB (S211) and phosho-P70S6K (T389) in WT and SESN2 KO HEK283T cells transfected with GFP-COL1A2 G610C or treated with Torin 1. FILAMIN was used as a loading control. Bar graph shows quantification of phospho-TFEB levels. Mean ± standard error of mean (SEM) of N = 3 biological replicates. Student’s unpaired t test: ∗∗∗∗p < 0.0001. (B) Representative images of immunofluorescence staining of TFE3 (red) subcellular localization in WT and SESN2 KO HEK283T cells expressing or not GFP-COL1A2 G610C. Scale bars, 8 μm. Bar graph shows quantification of % cells with nuclear TFE3. Mean ± SEM of N = 3 biological replicates. n = 70 WT and SESN2 KO cells. Student’s unpaired t test: ∗∗∗p < 0.0005. (C) Representative images of WT and SESN2 KO cells expressing FLAG-COL1A2 G610C and the ssRFP-GFP-KDEL plasmid. Scale bars, 8 μm. Right: bar graph showing the ratio of red-only puncta/total cells. Mean ± SEM of N = 3 biological replicates. n = 45 WT and SESN2 KO cells. Two-way analysis of variance (ANOVA) with Šídák’s multiple comparisons test: ∗∗∗p < 0.0005; ns ≥ 0.05. (D) Western blot analysis of WT and SESN2 KO HEK283T cells overexpressing mKeima-FAM134B transfected with GFP-COL1A2 G610C or GFP-empty plasmid as a control. FILAMIN was used as a loading control. (E) Western blot analysis of phosho-TFEB (S211) and phosho-P70S6K (T389) in U2OS cells with GFP-COL1A2 G610C and GFP-SESN2 overexpression. Actin was used as a loading control. (F) Immunofluorescence staining of TFE3 (red) subcellular localization in U2OS cells overexpressing GFP-SESN2. Scale bars, 8 μm. (G) Bar graph shows % of cells with nuclear TFE3 with GFP-SESN2 overexpression relative to untransfected cells. Mean ± SEM of N = 3 biological replicates. n = 45 cells. Student’s unpaired t test: ∗∗∗∗p < 0.0001. (H) Quantitative real-time PCR analysis of FAM134B isoform 2 in U2OS cells overexpressing GFP-SESN2 relative to untransfected cells (control). Mean ± standard error of mean (SEM) of N = 3 biological replicates. Values were normalized to HPRT gene expression and are shown as fold change relative to control. Student’s unpaired t test: ∗∗p < 0.005. (I) Western blot analysis in HEK283T cells overexpressing mKeima-FAM134B transfected with GFP-SESN2 or GFP-empty plasmid. FILAMIN was used as a loading control.
Figure 6
Figure 6
XBP1 activation triggers SESN2 induction and TFEB nuclear translocation in response to ER storage (A) Quantitative real-time PCR analysis of the expression of indicated gene in U2OS cells transfected with COL1A2 G610C. Values were normalized to HPRT and are shown as fold change relative to untransfected cells (control). Mean ± standard error of mean (SEM) of N = 3 biological replicates. One-way analysis of variance (ANOVA) with Dunnett’s multiple comparisons test: ∗∗p < 0.005; ns ≥ 0.05. (B) Cytosolic and nuclear levels of FLAG-TFEB in U2OS cells transfected or not with GFP-COL1A2 G610C and treated with the indicated drugs or DMSO as control. Torin1 was used as a positive control for TFEB nuclear translocation. FILAMIN and histone H3 served as loading controls. (C) Quantification of TFEB localization in (B) was expressed as % of cytosolic and nuclear fractions relative to the total. Mean of N = 4 independent experiments. (D) Quantification of TFEB nuclear levels by high-content fluorescent microscopy in cells transfected with COL1A2 G610C and treated with scramble, XBP1, ATF6, and ATF4 siRNAs. Mean ± SEM of N = 6 biological replicates. One-way ANOVA with Dunnett’s multiple comparisons test: p < 0.05; ∗∗p < 0.005; ∗∗∗p < 0.0005. (E and F) Quantitative real-time PCR analysis of the spliced form of XBP1 (SP XBP1) (E) and SESN2 (F) in HeLa cells expressing COL1A2 G610C and treated with scramble or XBP1 siRNA at different time points. Mean ± standard error of mean (SEM) of N = 5 biological replicates. Values were normalized to HPRT gene expression and are shown as fold change relative to untransfected cells (control). Two-way ANOVA with Tukey’s multiple comparisons test: p < 0.05; ∗∗p < 0.005; ∗∗∗p < 0.0005. (G) Western blot analysis of SESN2 levels in cells transfected with GFP-COL1A2 G610C and with scramble or XBP1 SiRNAs. Tubulin was used as a loading control. (H) Bar graph showing quantification of SESN2 levels relative to loading control. Mean ± standard error of mean (SEM) of N = 3 biological replicates. Student’s unpaired t test: p < 0.05. (I) Proposed model of ER-phagy activation in ERSDs. When misfolded proteins accumulation induces IRE1-XBP1 mediated transcriptional induction of SESN2 (I). By limiting mTORC1 activity on lysosome, SESN2 promotes TFEB/TFE3 activation (II). As a consequence, there is a transcriptional induction of FAM134B, as well as lysosomal and autophagy genes (III), promoting ER-phagy-mediated clearance of misfolded proteins (IV). (J) Western blot analysis of soluble and insoluble ATZ polymers in PiZ hepatocytes in which FAM134B was silenced. FILAMIN and histone H3 were used as a loading control. (K) Bar graph showing quantification of insoluble ATZ polymers. Mean ± standard error of mean (SEM) of N = 3 biological replicates. Student’s unpaired t test: p < 0.05. (L) Western blot analysis of soluble and insoluble ATZ polymers in PiZ hepatocytes in which HA-FAM134B was overexpressed. FILAMIN and histone H3 were used as a loading control. (M) Bar graph showing quantification of insoluble ATZ polymers. Mean ± standard error of mean (SEM) of N = 3 biological replicates. Student’s unpaired t test: ∗∗p < 0.005.
Figure 7
Figure 7
Pharmacological induction of FAM134B promotes ER-cargo clearance via ER-phagy (A) Representative fluorescence microscopy analysis of U2OS cells stably expressing the ssRFP-GFP-KDEL reporter and treated with fluphenazine (FPZ) or tetrandrine (TET) (10 μM, 12 h). Torin1 (500 nM for 12 h) and DMSO were used as positive control and vehicle, respectively. Scale bars, 10 μm. Bar graph showing the ratio of red-only puncta/total cells. Mean ± standard error of mean (SEM) of N = 3 independent experiments. n = 21 cells were counted. One-way analysis of variance (ANOVA) with Dunnett’s multiple comparisons test: ∗∗p < 0.005; ∗∗∗p < 0.0005; ∗∗∗∗p < 0.0001. (B) Western blot analysis in RCS cells expressing mKeima-RAMP4, treated with FPZ, TET (10 μM, 12 h), or BafA1 (100 nM, 4 h). Torin1 (500 nM for 12 h) and DMSO were used as positive control and vehicle, respectively. FILAMIN was used as a loading control. (C) TFE3 (green) subcellular localization in U2OS cells treated with FPZ and TET (10 μM, 12 h). Scale bars, 30 μm. Quantitative analysis of nuclear TFE3 (expressed as %) Torin 1 (500 nM for 12 h) was used as a positive control. Mean ± SEM of N = 3 independent experiments. n = 85 cells were counted. One-way ANOVA with Dunnett’s multiple comparisons test: ∗∗∗∗p < 0.0001. (D and E) Western blot analysis of phospho-TFEB (S211 and S142) and total TFEB in U2OS cells treated with FPZ (E) or TET (F) (10 μM) for the indicated time points. Torin1 (500 nM for 12 h) and DMSO were used as positive control and vehicle, respectively. Actin was used as a loading control. (F)Quantitative real-time PCR analysis of FAM134B isoform 2 in WT and TFEB/3 DKO RCS cells treated with Torin1 (500 nM for 12 h), and FPZ and TET (10 μM, 12 h). Mean ± standard error of mean (SEM) of N = 4 independent experiments. Values were normalized to cyclophilin (CYC) gene expression and expressed as fold change relative to DMSO cells. One-way ANOVA with Šídák’s multiple comparisons test: p < 0.05; ∗∗∗∗p < 0.0001. (G) Fluorescence microscopy analysis in U2OS cell with indicated genotype expressing tandem ssRFP-GFP-COL1A2 G610C and treated with FPZ or TET (10 μM, 12 h). Scale bars, 5 μm. Insets show magnification of boxed area. Bar graph showing the ratio of red-only puncta/total cells. n = 26 cells were counted. Two-way ANOVA with Tukey’s multiple comparisons test: p < 0.05; ∗∗p < 0.005; ∗∗∗∗p < 0.0001. (H) Western blot analysis of GFP-COL1A2 G610C levels in WT, shFAM134B, TFEB/3 DKO, and ATG7 KO U2OS cells treated with the indicated drugs. Actin was used as a loading control. (I) Western blot analysis of insoluble ATZ polymers of PiZ primary hepatocytes treated with the indicated compounds. FILAMIN and histone H3 were used as a loading control. Quantitative analysis of indicated proteins levels (on right). Mean ± SEM of N = 3 independent experiments. One-way ANOVA with Šídák’s multiple comparisons test: ∗∗∗∗p < 0.0001; ns ≥ 0.05.

References

    1. Schwarz D.S., Blower M.D. The endoplasmic reticulum: structure, function and response to cellular signaling. Cell. Mol. Life Sci. 2016;73:79–94. doi: 10.1007/s00018-015-2052-6. - DOI - PMC - PubMed
    1. Oakes S.A., Papa F.R. The Role of Endoplasmic Reticulum Stress in Human Pathology. Annu. Rev. Pathol. 2015;10:173–194. doi: 10.1146/annurev-pathol-012513-104649. - DOI - PMC - PubMed
    1. Wu X., Rapoport T.A. Mechanistic insights into ER-associated protein degradation. Curr. Opin. Cell Biol. 2018;53:22–28. doi: 10.1016/j.ceb.2018.04.004. - DOI - PMC - PubMed
    1. Fregno I., Molinari M. Proteasomal and lysosomal clearance of faulty secretory proteins: ER-associated degradation (ERAD) and ER-to-lysosome-associated degradation (ERLAD) pathways. Crit. Rev. Biochem. Mol. Biol. 2019;54:153–163. doi: 10.1080/10409238.2019.1610351. - DOI - PubMed
    1. Ferro-Novick S., Reggiori F., Brodsky J.L. ER-Phagy, ER Homeostasis, and ER Quality Control: Implications for Disease. Trends Biochem. Sci. 2021;46:630–639. doi: 10.1016/j.tibs.2020.12.013. - DOI - PMC - PubMed

Publication types

MeSH terms

Associated data