. 2024 Aug 20;5(8):101663.
doi: 10.1016/j.xcrm.2024.101663. Epub 2024 Aug 1.

In vivo vulnerabilities to GPX4 and HDAC inhibitors in drug-persistent versus drug-resistant BRAFV600E lung adenocarcinoma

Collaborators, Affiliations

In vivo vulnerabilities to GPX4 and HDAC inhibitors in drug-persistent versus drug-resistant BRAFV600E lung adenocarcinoma

Marie-Julie Nokin et al. Cell Rep Med. .

Abstract

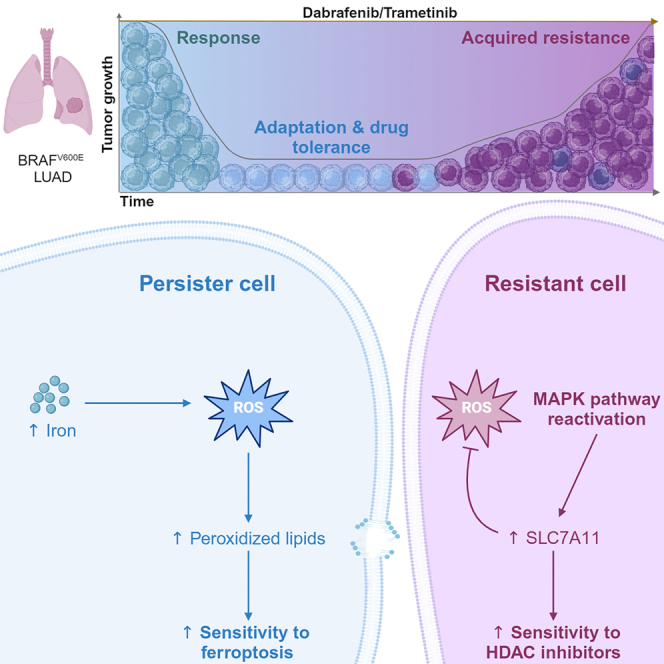
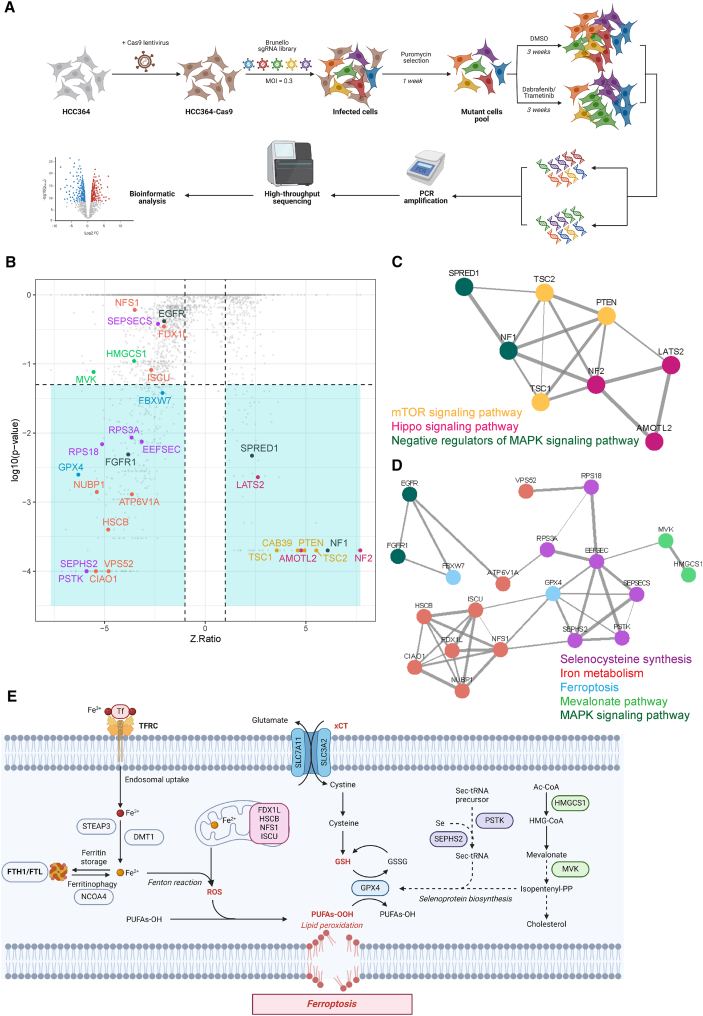
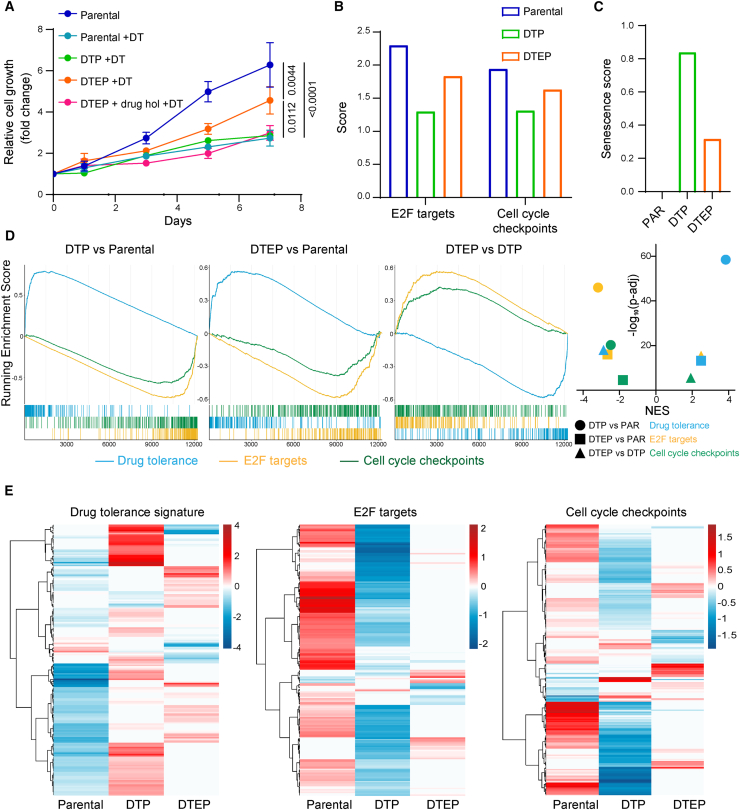
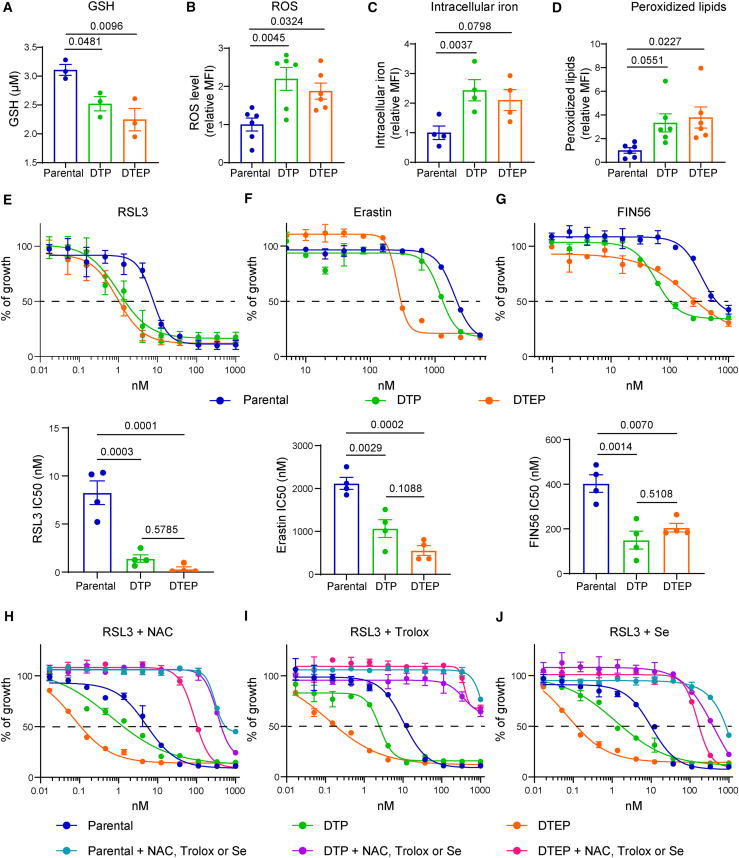
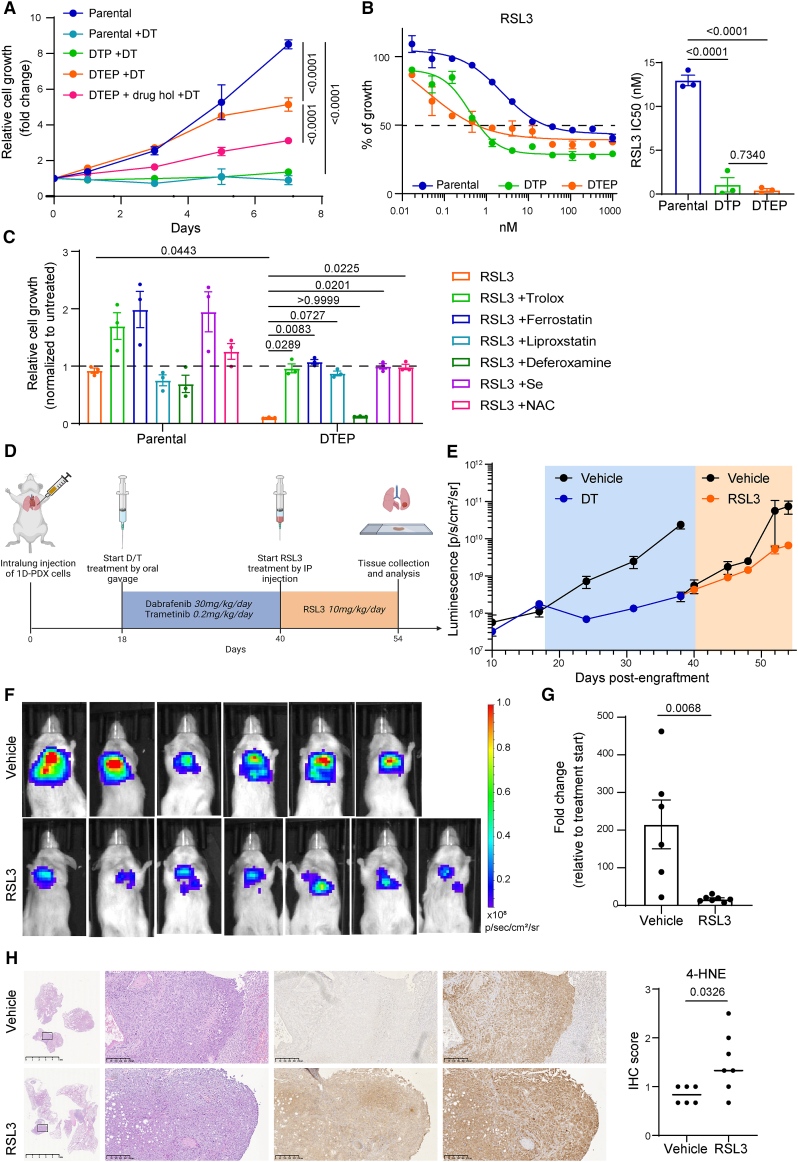
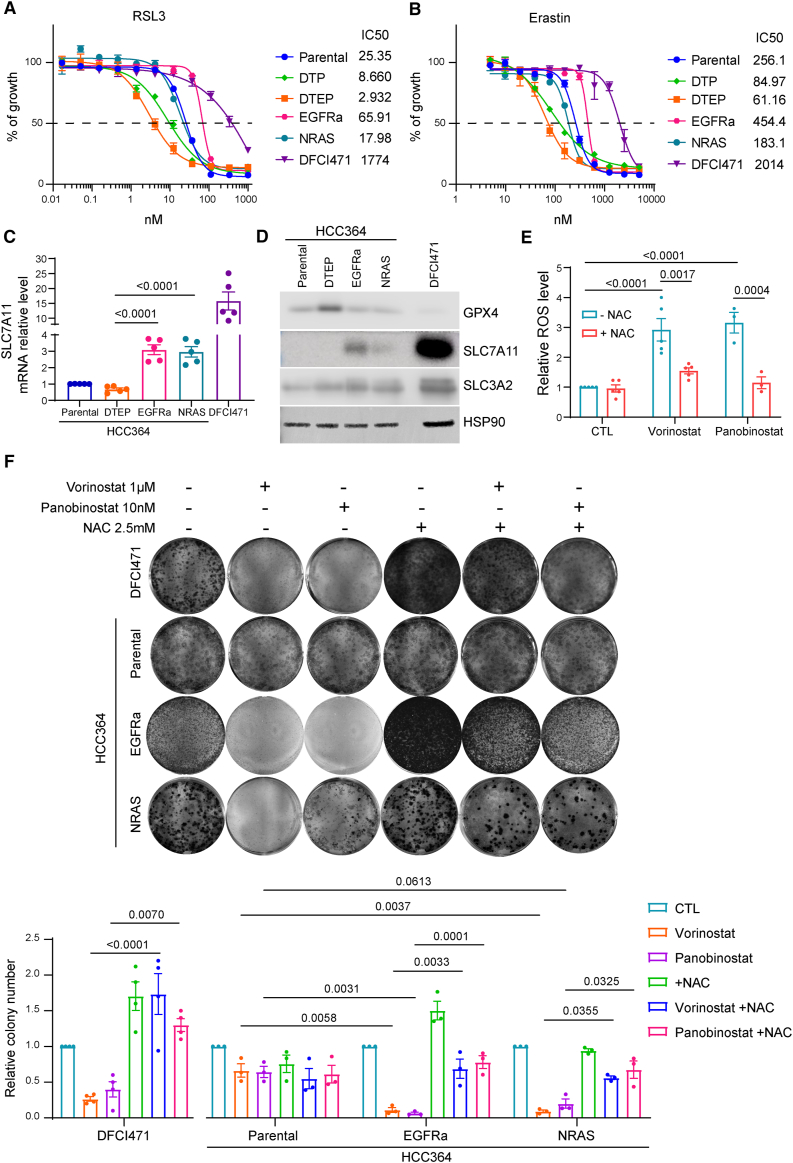
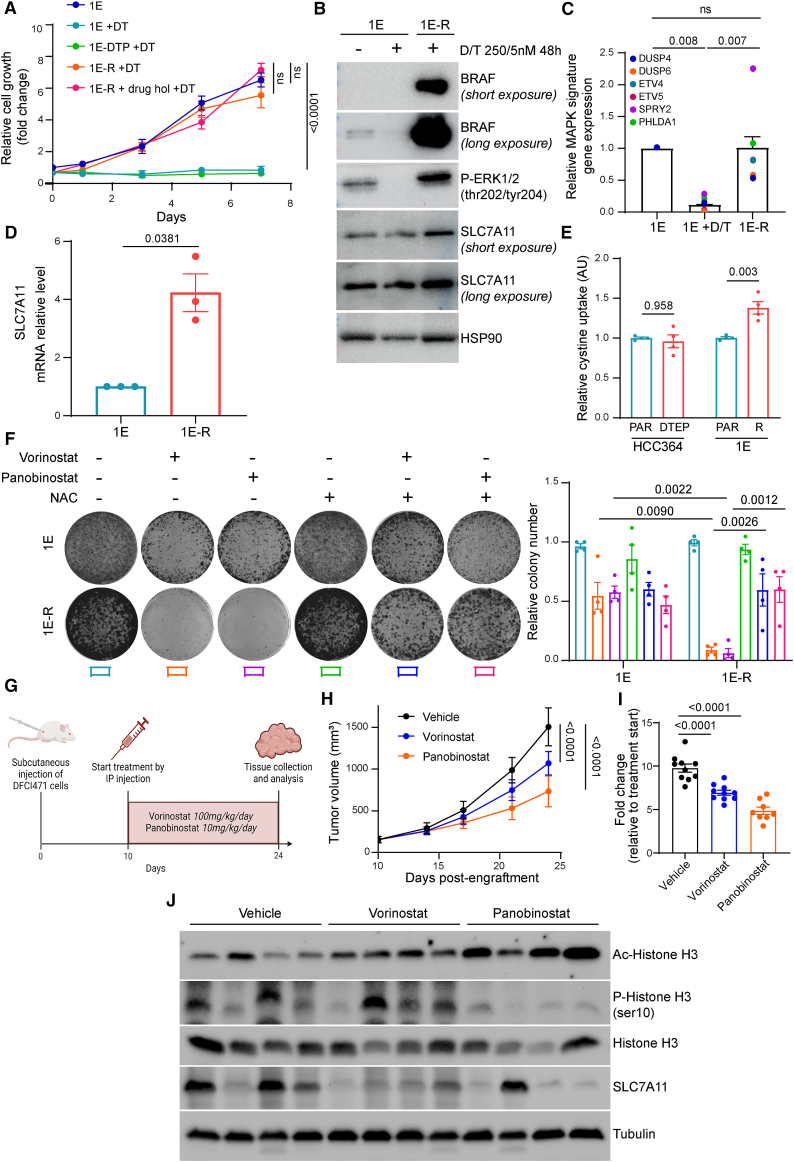
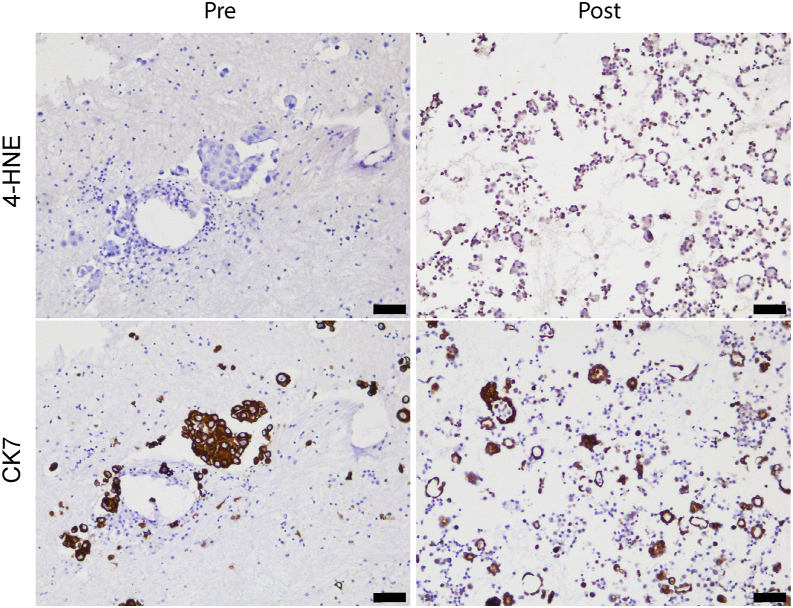
The current targeted therapy for BRAFV600E-mutant lung cancer consists of a dual blockade of RAF/MEK kinases often combining dabrafenib/trametinib (D/T). This regimen extends survival when compared to single-agent treatments, but disease progression is unavoidable. By using whole-genome CRISPR screening and RNA sequencing, we characterize the vulnerabilities of both persister and D/T-resistant cellular models. Oxidative stress together with concomitant induction of antioxidant responses is boosted by D/T treatment. However, the nature of the oxidative damage, the choice of redox detoxification systems, and the resulting therapeutic vulnerabilities display stage-specific differences. Persister cells suffer from lipid peroxidation and are sensitive to ferroptosis upon GPX4 inhibition in vivo. Biomarkers of lipid peroxidation are detected in clinical samples following D/T treatment. Acquired alterations leading to mitogen-activated protein kinase (MAPK) reactivation enhance cystine transport to boost GPX4-independent antioxidant responses. Similarly to BRAFV600E-mutant melanoma, histone deacetylase (HDAC) inhibitors decrease D/T-resistant cell viability and extend therapeutic response in vivo.

Keywords: BRAF oncogene; GPX4 inhibition; HDAC inhibition; ferroptosis; lung adenocarcinoma; persister cells; targeted therapy.


Conflict of interest statement

Declaration of interests D.S. received research fees from Aelin Therapeutics. C.A. received research fees from Revolution Medicines, Aelin Therapeutics, Verastem, Roche, and Boehringer Ingelheim. E.N. reports research funding from Pfizer and Roche. P.L. is listed as an inventor on patent applications filed by MSKCC that describe approaches to treat KRAS or BRAF-mutant tumors. P.A.J. has received consulting fees from AstraZeneca, Boehringer Ingelheim, Pfizer, Roche/Genentech, Takeda Oncology, ACEA Biosciences, Eli Lilly and Company, Araxes Pharma, Ignyta, Mirati Therapeutics, Novartis, Loxo Oncology, Daiichi Sankyo, Sanofi Oncology, Voronoi, SFJ Pharmaceuticals, Takeda Oncology, Transcenta, Silicon Therapeutics, Syndax, Nuvalent, Bayer, Eisai, Biocartis, Allorion Therapeutics, Accutar Biotech, Monte Rosa, Scorpion Therapeutics, Merus, Frontier Medicines, Hongyun Biotechnology, Duality, and AbbVie; post-marketing royalties from DFCI-owned intellectual property on EGFR mutations licensed to Lab Corp; sponsored research agreements with AstraZeneca, Daiichi Sankyo, Puma, Boehringer Ingelheim, Eli Lilly and Company, Revolution Medicines, and Astellas Pharmaceuticals; and stock ownership in Gatekeeper Pharmaceuticals. M.M.A. reports grants and personal fees from Genentech, grants and personal fees from Bristol Myers Squibb, personal fees from Merck, grants and personal fees from AstraZeneca, grants from Lilly, and personal fees from Maverick, Blueprint Medicine, Syndax, Ariad, Nektar, Gritstone, ArcherDX, Mirati, NextCure, Novartis, EMD Serono, and Panvaxal/NovaRx, outside the submitted work.

Figures

None
Graphical abstract
Figure 1
Figure 1
Genome-wide CRISPR-Cas9 screening identifies determinants of dabrafenib/trametinib sensitivity in BRAF-mutant LUAD cells (A) Schematic diagram illustrates the genome-wide CRISPR-Cas9 knockout library screening. Human Brunello sgRNA library was packed into lentiviral particles and transduced into Cas9-overexpressing HCC364 cells (HCC364-Cas9). The sgRNA-transduced cells were selected by puromycin and cultured in vehicle and dabrafenib/trametinib (D/T) (250/5 nM, refreshed every 3 days) for 3 weeks. Genomic DNA was extracted from the treated cells and the sgRNA fragment was amplified by PCR. Copy number of sgRNAs was determined by high-throughput sequencing analysis. (B) Scatterplot depicting gene-level results for D/T negatively and positively selected hits in the CRISPR screen. A number of representative hits are shown in color and are detailed in C and D. n = 1 biological replicate. (C and D) STRING protein network of the positively (C) and negatively (D) selected hits as defined in (B). Colored nodes highlight proteins enriched in certain signaling pathways. The edges represent protein-protein associations, and the line thickness indicates the strength of data support. n = 1 biological replicate. (E) Scheme representing the major actors of ferroptosis, highlighting the central role of GPX4 in the detoxification of peroxidized lipids. See also Figure S1.
Figure 2
Figure 2
Transcriptomic analysis of drug-tolerant persister and drug-tolerant expanded persister HCC364 cells points to redox homeostasis as a potential vulnerability in these cell populations (A) Drug-tolerant persisters (DTPs) and drug-tolerant expanded persisters (DTEPs) were generated by maintaining BRAFV600E-mutant HCC364 cells on constant D/T (250/5 nM) treatment for 3 and 40 weeks, respectively. Growth curves of parental, DTP, and DTEP HCC364 cells in the presence of 250/5 nM D/T. DTEPs underwent a drug holiday for 3 weeks and were rechallenged with D/T to further confirm the non-genetic adaptation of these cells to the treatment (DTEP + drug hol + D/T). Data were analyzed using two-way ANOVA followed by Tukey’s multiple comparisons post-test and are shown as the mean values ± SEM. n = 3 biological replicates. (B) RNA sequencing analyses were performed on HCC364 parental, DTP, and DTEPs cells. E2F targets and cell cycle checkpoints ssGSEA scores in parental, DTP, and DTEP HCC364 cells. n = 1 biological replicate. (C) Senescence score in parental (PAR), DTP, and DTEP HCC364 cells. n = 1 biological replicate. (D) Running enrichment scores of GSEA (left panel) in DTP vs. PAR, DTEP vs. PAR, and DTEP vs. DTP using the drug tolerance signature and the E2F targets and cell cycle checkpoints gene sets. Normalized enrichment scores (NESs) against the log10 of adjusted p value are shown (right panel). n = 1 biological replicate. (E) Heatmap of the significantly differentially expressed genes from the 3 gene sets (drug tolerance signature, E2F targets, and cell cycle checkpoints) in PAR, DTP, and DTEP cells. n = 1 biological replicate. See also Figure S1.
Figure 3
Figure 3
DTP and DTEP HCC364 cells are hypersensitive to ferroptosis induction in vitro (A) Intracellular GSH concentration in parental, DTP, and DTEP HCC364 cells. n = 3 biological replicates. (B) ROS level in parental, DTP, and DTEP HCC364 cells. n = 6 biological replicates. (C) Iron level in parental, DTP, and DTEP HCC364 cells. n = 4 biological replicates. (D) Peroxidized lipids content in parental, DTP, and DTEP HCC364 cells. n = 6 biological replicates. (E–G) Cell viability assessment by MTT assay of parental, DTP, and DTEP HCC364 cells treated with serial dilutions of RSL3 (E), erastin (F), or FIN56 (G) for 72 h (upper panel). IC50 values (lower panel) are represented for each condition. n = 4 biological replicates. (H–J) Cell viability assessment by MTT assay of parental, DTP, and DTEP HCC364 cells treated with serial dilutions of RSL3 in the presence of 2.5 mM N-acetylcysteine (NAC, H), 10 μM Trolox (I), or 200 nM selenium (Se, J) for 72 h n = 3 biological replicates. All data were analyzed using one-way ANOVA followed by Dunnett’s multiple comparisons post-test and are shown as the mean values ± SEM. See also Figures S2–S4 and S10.
Figure 4
Figure 4
GPX4 inhibition reduces the tumor growth of D/T-resistant cells in vivo (A) DTPs and DTEPs were generated by maintaining BRAFV600E-mutant 1D-PDX cells on increasing concentrations of D/T treatment for 3 and 40 weeks, respectively. Growth curves of parental, DTP, and DTEP 1D cells in the presence of 250/5 nM D/T. DTEPs underwent a drug holiday for 3 weeks and were rechallenged with D/T to further confirm the non-genetic adaptation of these cells to the treatment (DTEP + drug hol + D/T). Data were analyzed using two-way ANOVA followed by Tukey’s multiple comparisons post-test and are shown as the mean values ± SEM. n = 3 biological replicates. (B) Cell viability assessment by MTT assay of parental, DTP, and DTEP 1D cells treated with serial dilutions of RSL3 for 72 h. Data are shown as the mean values ± SEM. IC50 values ± SD are indicated for each condition. n = 3 biological replicates. (C) Cell viability assessment by MTT assay of parental and DTEP 1D cells treated with 50 nM RSL3 in the presence of 10 μM Trolox, 200 nM ferrostatin, 100 nM liproxstatin, 1 μM deferoxamine, 200 nM Se, or 2.5 mM NAC for 72 h. Data are normalized to untreated cells and shown as the mean values ± SEM. Data were analyzed using two-way ANOVA followed by Tukey’s multiple comparisons post-test. n = 3 biological replicates. (D) Schematic outline of the 1D intrapulmonary xenograft model. After lung orthotopic injection, mice were treated with dabrafenib (30 mg/kg/day) and trametinib (0.2 mg/kg/day) by oral gavage 5 days per week. At disease progression, mice were treated with RSL3 (10 mg/kg/day) by intraperitoneal injection 5 days per week. Mice were sacrificed and lungs were collected for further analysis. (E) Follow-up of intralung 1D tumor growth by bioluminescence imaging. Mice were treated as mentioned in D. Data are represented as mean signal intensity (p/s/cm2/sr) ± SEM, n = 6 or 7 mice for each group. (F) Representative images of bioluminescence signal in mice treated with RSL3. (G) Fold change in tumor growth compared to baseline (the start of RSL3 treatment, day 40 post-implantation) for individual cell xenografts treated for 14 days with vehicle or with 10 mg/kg/day RSL3. Fold changes were calculated based on the values presented in Figure 4E (p/s/cm2/sr). Statistical significance was tested using unpaired two-tailed t test. n = 6 or 7 mice for each group. (H) Representative 4-HNE and GPX4 immunostaining in lung sections of mice treated with RSL3. Quantification of 4-HNE staining scores in 1D tumors from mice treated with vehicle or with RSL3. Data are shown as mean scores (average of three independent stainings) per mice and were analyzed using Mann-Whitney t test. n = 6 or 7 mice for each group. See also Figures S1 and S9.
Figure 5
Figure 5
NRAS-mediated resistance leads to increased sensitivity to oxidative stress but not to ferroptosis (A and B) DFCI471 cells derived from a biopsy of a patient with BRAFV600E LUAD at disease progression upon D/T treatment. HCC364NRAS cells were generated by exogenous expression of NRASQ61K in HCC364-DTPs and HCC364EGFRa cells were derived spontaneously from HCC364-DTEPs after continuous D/T (250/5 nM) treatment for 70 weeks. Cell viability assessment by MTT assay of parental and DTEP HCC364, HCC364EGFRa, HCC364NRAS, and DFCI471 cells treated with serial dilutions of RSL3 (A) or erastin (B) for 72 h. Data are shown as the mean values ± SEM. n = 3 biological replicates. (C) Quantitative reverse-transcription PCR (RT-PCR) analysis of relative SLC7A11 mRNA level in parental and DTEP HCC364, HCC364EGFRa, HCC364NRAS, and DFCI471 cells. Data were analyzed using one-way ANOVA followed by Tukey’s multiple comparisons post-test and are shown as the mean values ± SEM. n = 5 biological replicates. (D) Immunoblot of SLC7A11, SLC3A2, and GPX4 in parental and DTEP HCC364, HCC364EGFRa, HCC364NRAS, and DFCI471 cells. HSP90 was used as a loading control. n = 3 biological replicates. (E) Intracellular ROS level in DFCI471 cells co-treated with 1 μM vorinostat or 10 nM panobinostat and 2.5 mM NAC for 72 h. Data were analyzed using two-way ANOVA followed by Tukey’s multiple comparisons post-test and are shown as the mean values ± SEM. n = 3 or 5 biological replicates. (F) Clonogenic assay of DFCI471, HCC364, HCC364EGFRa, and HCC364NRAS cells co-treated with 1 μM vorinostat or 10 nM panobinostat and 2.5 mM NAC. Data were analyzed using two-way ANOVA followed by Tukey’s multiple comparisons post-test and are shown as the mean values ± SEM. n = 3 biological replicates. See also Figures S2, S6, S7, and S10.
Figure 6
Figure 6
MAPK pathway reactivation through BRAF amplification is associated with ROS vulnerabilities and in vivo targeting of NRAS-mediated D/T resistance in BRAFV600E LUAD cells with HDAC inhibitors (A) DTPs and 1E-R cells were generated by maintaining BRAFV600E-mutant 1E-PDX cells on increasing concentrations of D/T treatment for 3 and 30 weeks, respectively. Growth curves of parental, DTP, and -R 1E cells in the presence of 250/5 nM D/T. 1E-R cells underwent a drug holiday for 3 weeks and were rechallenged with D/T to confirm the genetic adaptation of these cells to the treatment (1E-R + drug hol + D/T). Data were analyzed using two-way ANOVA followed by Tukey’s multiple comparisons post-test and are shown as the mean values ± SEM. n = 3 biological replicates. (B) Immunoblot of BRAF, phospho-ERK (p-ERK), and SLC7A11 in 1E and 1E-R cells cultured in the presence of 250/5 nM D/T for 48 h. HSP90 was used as a loading control. n = 2 biological replicates. (C) Quantitative RT-PCR analysis of relative MAPK pathway target genes (DUSP4, DUSP6, ETV4, ETV5, SPRY2, and PHLDA1) mRNA levels in 1E and 1E-R cells cultured in the presence of 250/5 nM D/T for 48 h. Data were analyzed using one-way ANOVA followed by Tukey’s multiple comparisons post-test and are shown as the mean values ±SEM. n = 3 biological replicates. (D) Quantitative RT-PCR analysis of SLC7A11 mRNA level in 1E and 1E-R cells. Data were analyzed using unpaired t test with Welch’s correction and are shown as the mean values ± SEM. n = 3 biological replicates. (E) Intracellular cystine uptake in HCC364 (parental and DTEP) and 1E (parental and -R) cells. Data were analyzed using two-way ANOVA followed by Tukey’s multiple comparisons post-test and are shown as the mean values ± SEM. n = 4 biological replicates. (F) Clonogenic assay of 1E and 1E-R cells co-treated with 1 μM vorinostat or 10 nM panobinostat and 2.5 mM NAC. Data were analyzed using two-way ANOVA followed by Tukey’s multiple comparisons post-test and are shown as the mean values ± SEM. n = 4 biological replicates. (G) Schematic outline of the DFCI471 subcutaneous xenograft model. Mice were treated with vorinostat (100 mg/kg/day) or panobinostat (10 mg/kg/day) by intraperitoneal injection 5 days per week. After 14 days, mice were sacrificed and tumors were collected for further analysis. (H) Follow-up of tumor growth of the indicated conditions. Data are represented as mean tumor volume ±SEM. n = 8 or 10 mice for each group. (I) Fold change in tumor growth compared to baseline. (J) Immunoblot of acetyl and phospho-histone H3 (Ac and p-histone H3), histone H3, and SLC7A11 in 4 representative tumors per condition. Tubulin was used as a loading control. n = 4 biological replicates. See also Figure S8.
Figure 7
Figure 7
Clinical evidence of the occurrence of lipid peroxidation at disease progression following D/T treatment Representative 4-HNE immunostaining in patient samples pre- and post-D/T treatment. Immunostaining for the epithelial marker CK7 was performed in consecutive sections as control. Scale bars represent 75 μm.

References

    1. Lavoie H., Therrien M. Structural keys unlock RAS-MAPK cellular signalling pathway. Nature. 2022;609:248–249. doi: 10.1038/d41586-022-02189-7. - DOI - PubMed
    1. Wiesweg M., Preuss C., Roeper J., Metzenmacher M., Eberhardt W., Stropiep U., Wedeken K., Reis H., Herold T., Darwiche K., et al. BRAF mutations and BRAF mutation functional class have no negative impact on the clinical outcome of advanced NSCLC and associate with susceptibility to immunotherapy. Eur. J. Cancer. 2021;149:211–221. doi: 10.1016/j.ejca.2021.02.036. - DOI - PubMed
    1. Dagogo-Jack I., Martinez P., Yeap B.Y., Ambrogio C., Ferris L.A., Lydon C., Nguyen T., Jessop N.A., Iafrate A.J., Johnson B.E., et al. Impact of BRAF Mutation Class on Disease Characteristics and Clinical Outcomes in BRAF-mutant Lung Cancer. Clin. Cancer Res. 2019;25:158–165. doi: 10.1158/1078-0432.CCR-18-2062. - DOI - PubMed
    1. Tabbo F., Pisano C., Mazieres J., Mezquita L., Nadal E., Planchard D., Pradines A., Santamaria D., Swalduz A., Ambrogio C., et al. How far we have come targeting BRAF-mutant non-small cell lung cancer (NSCLC) Cancer Treat Rev. 2022;103 doi: 10.1016/j.ctrv.2021.102335. - DOI - PubMed
    1. Planchard D., Besse B., Groen H.J.M., Hashemi S.M.S., Mazieres J., Kim T.M., Quoix E., Souquet P.J., Barlesi F., Baik C., et al. Phase 2 Study of Dabrafenib Plus Trametinib in Patients With BRAF V600E-Mutant Metastatic NSCLC: Updated 5-Year Survival Rates and Genomic Analysis. J. Thorac. Oncol. 2022;17:103–115. doi: 10.1016/j.jtho.2021.08.011. - DOI - PubMed

MeSH terms