. 2024 Sep 11;32(9):1579-1593.e8.
doi: 10.1016/j.chom.2024.07.006. Epub 2024 Aug 1.

Viral hijacking of hnRNPH1 unveils a G-quadruplex-driven mechanism of stress control

Affiliations

Viral hijacking of hnRNPH1 unveils a G-quadruplex-driven mechanism of stress control

Philipp Schult et al. Cell Host Microbe. .

Abstract

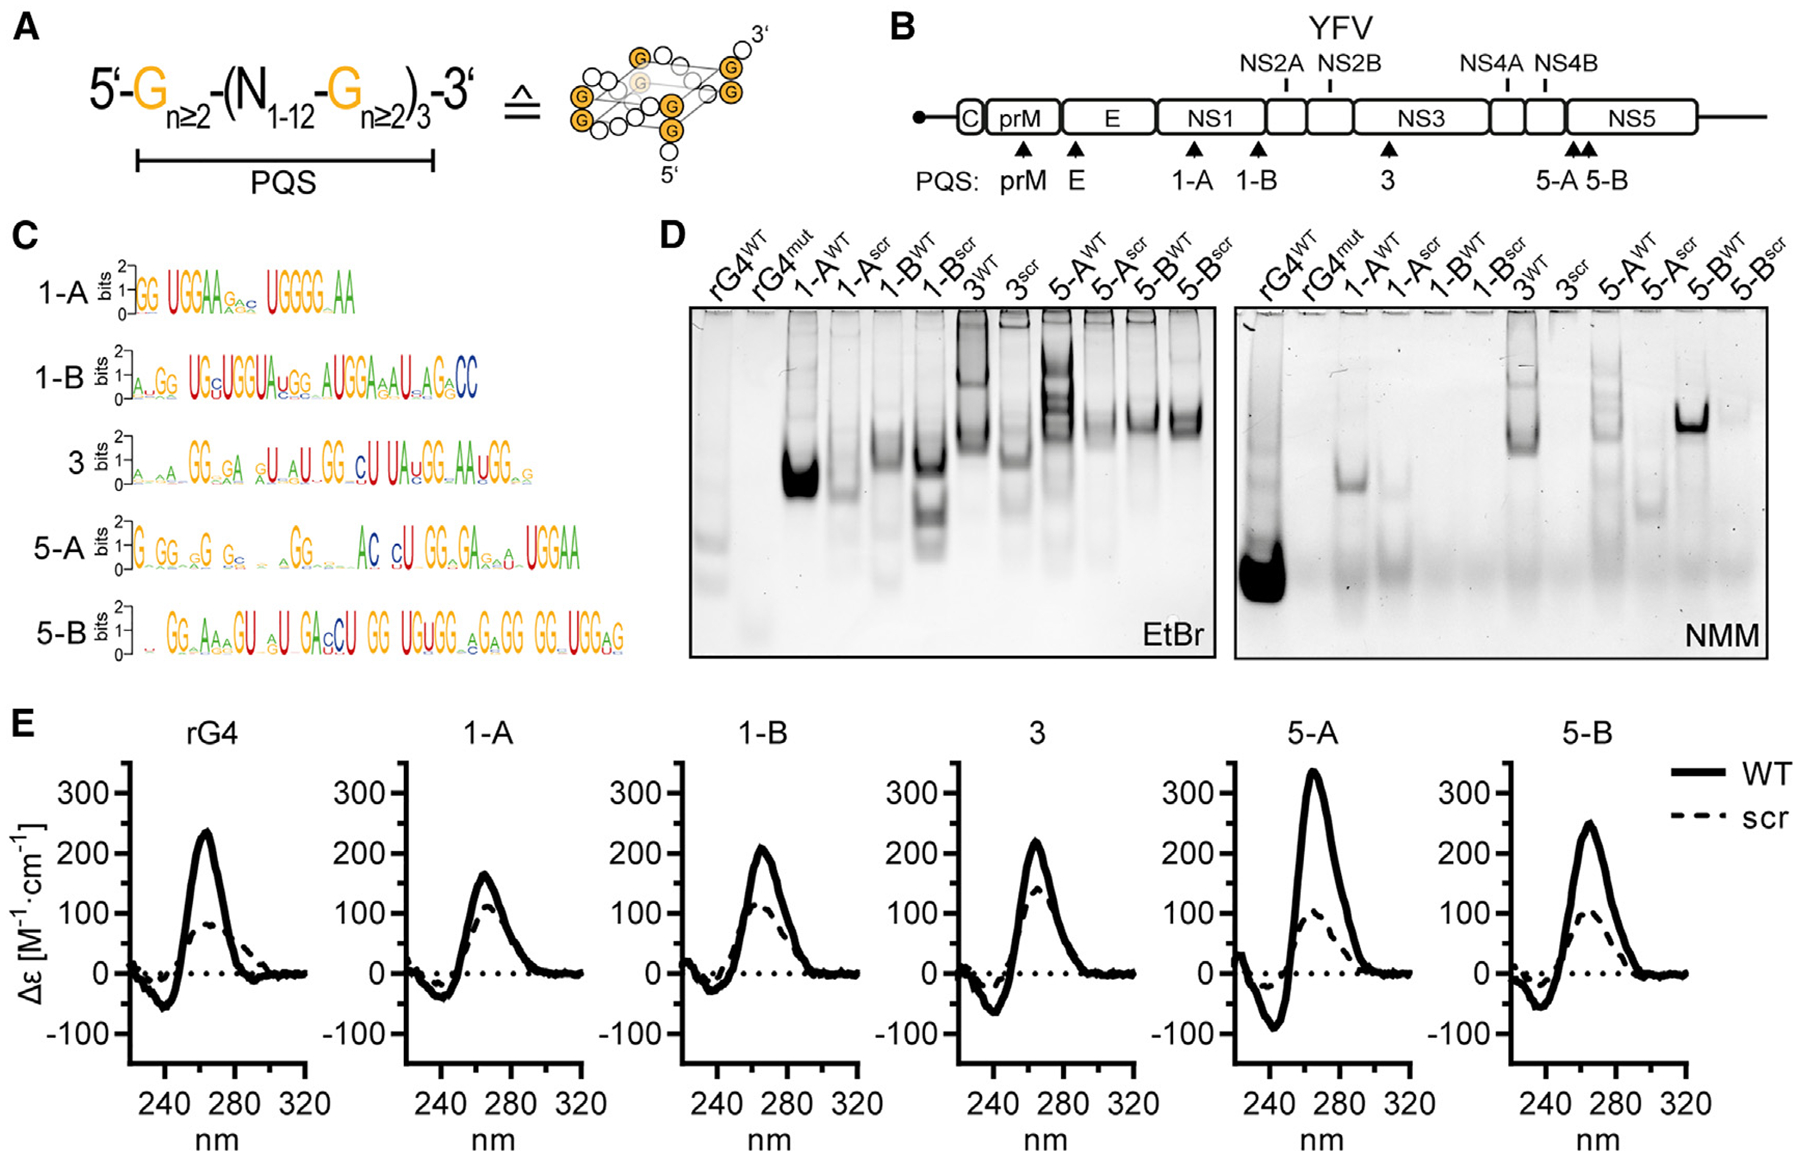
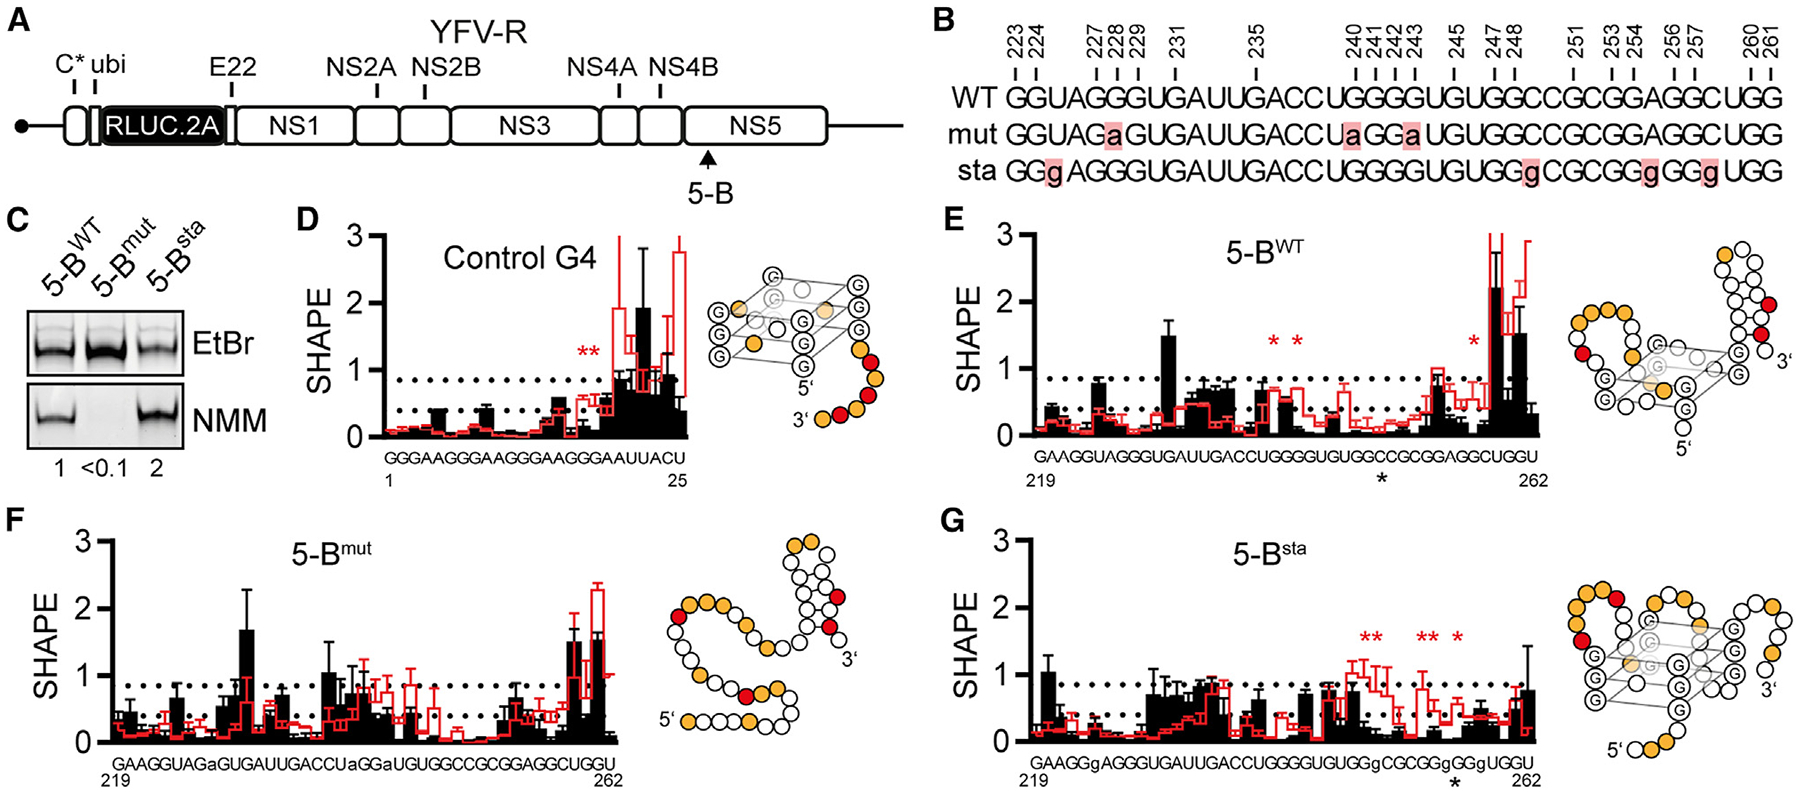
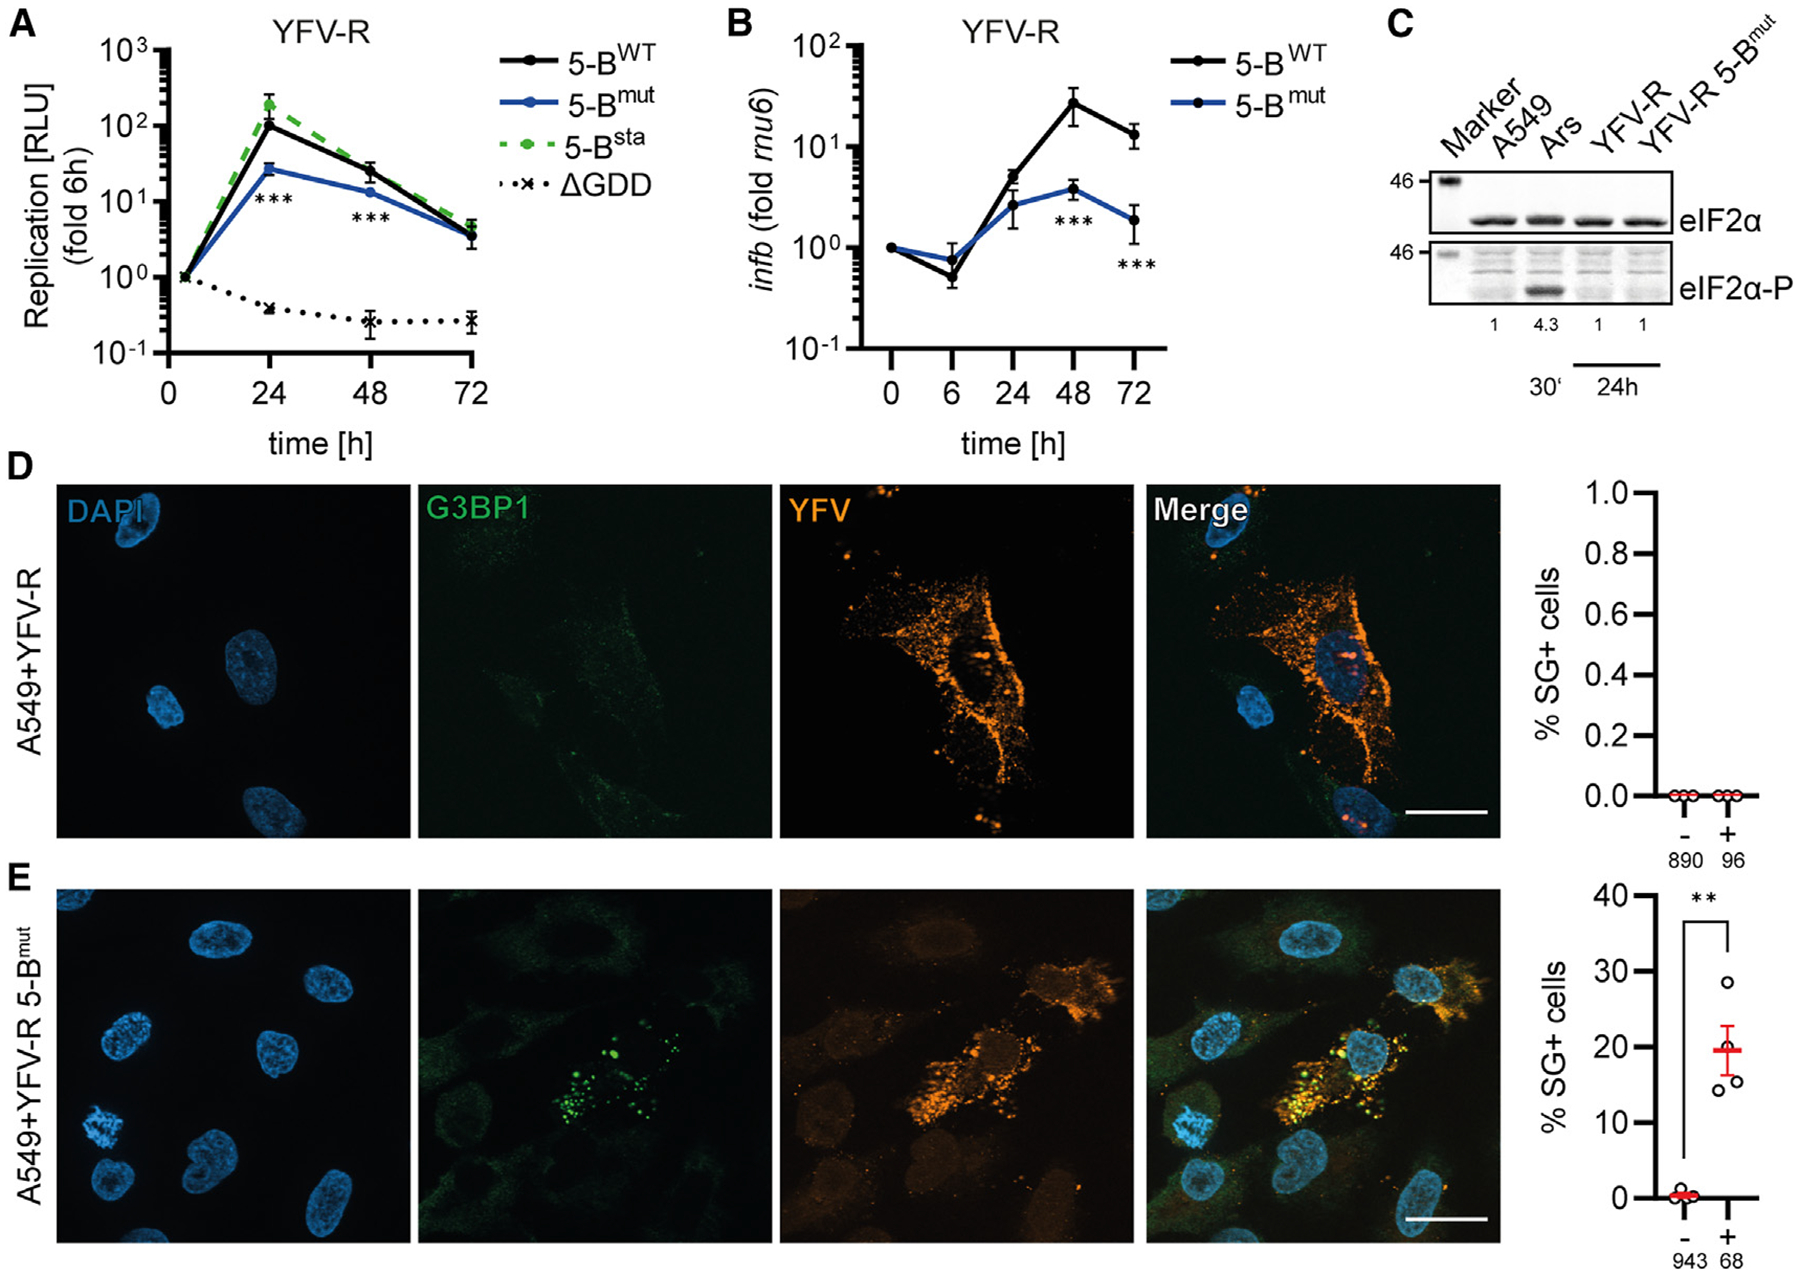
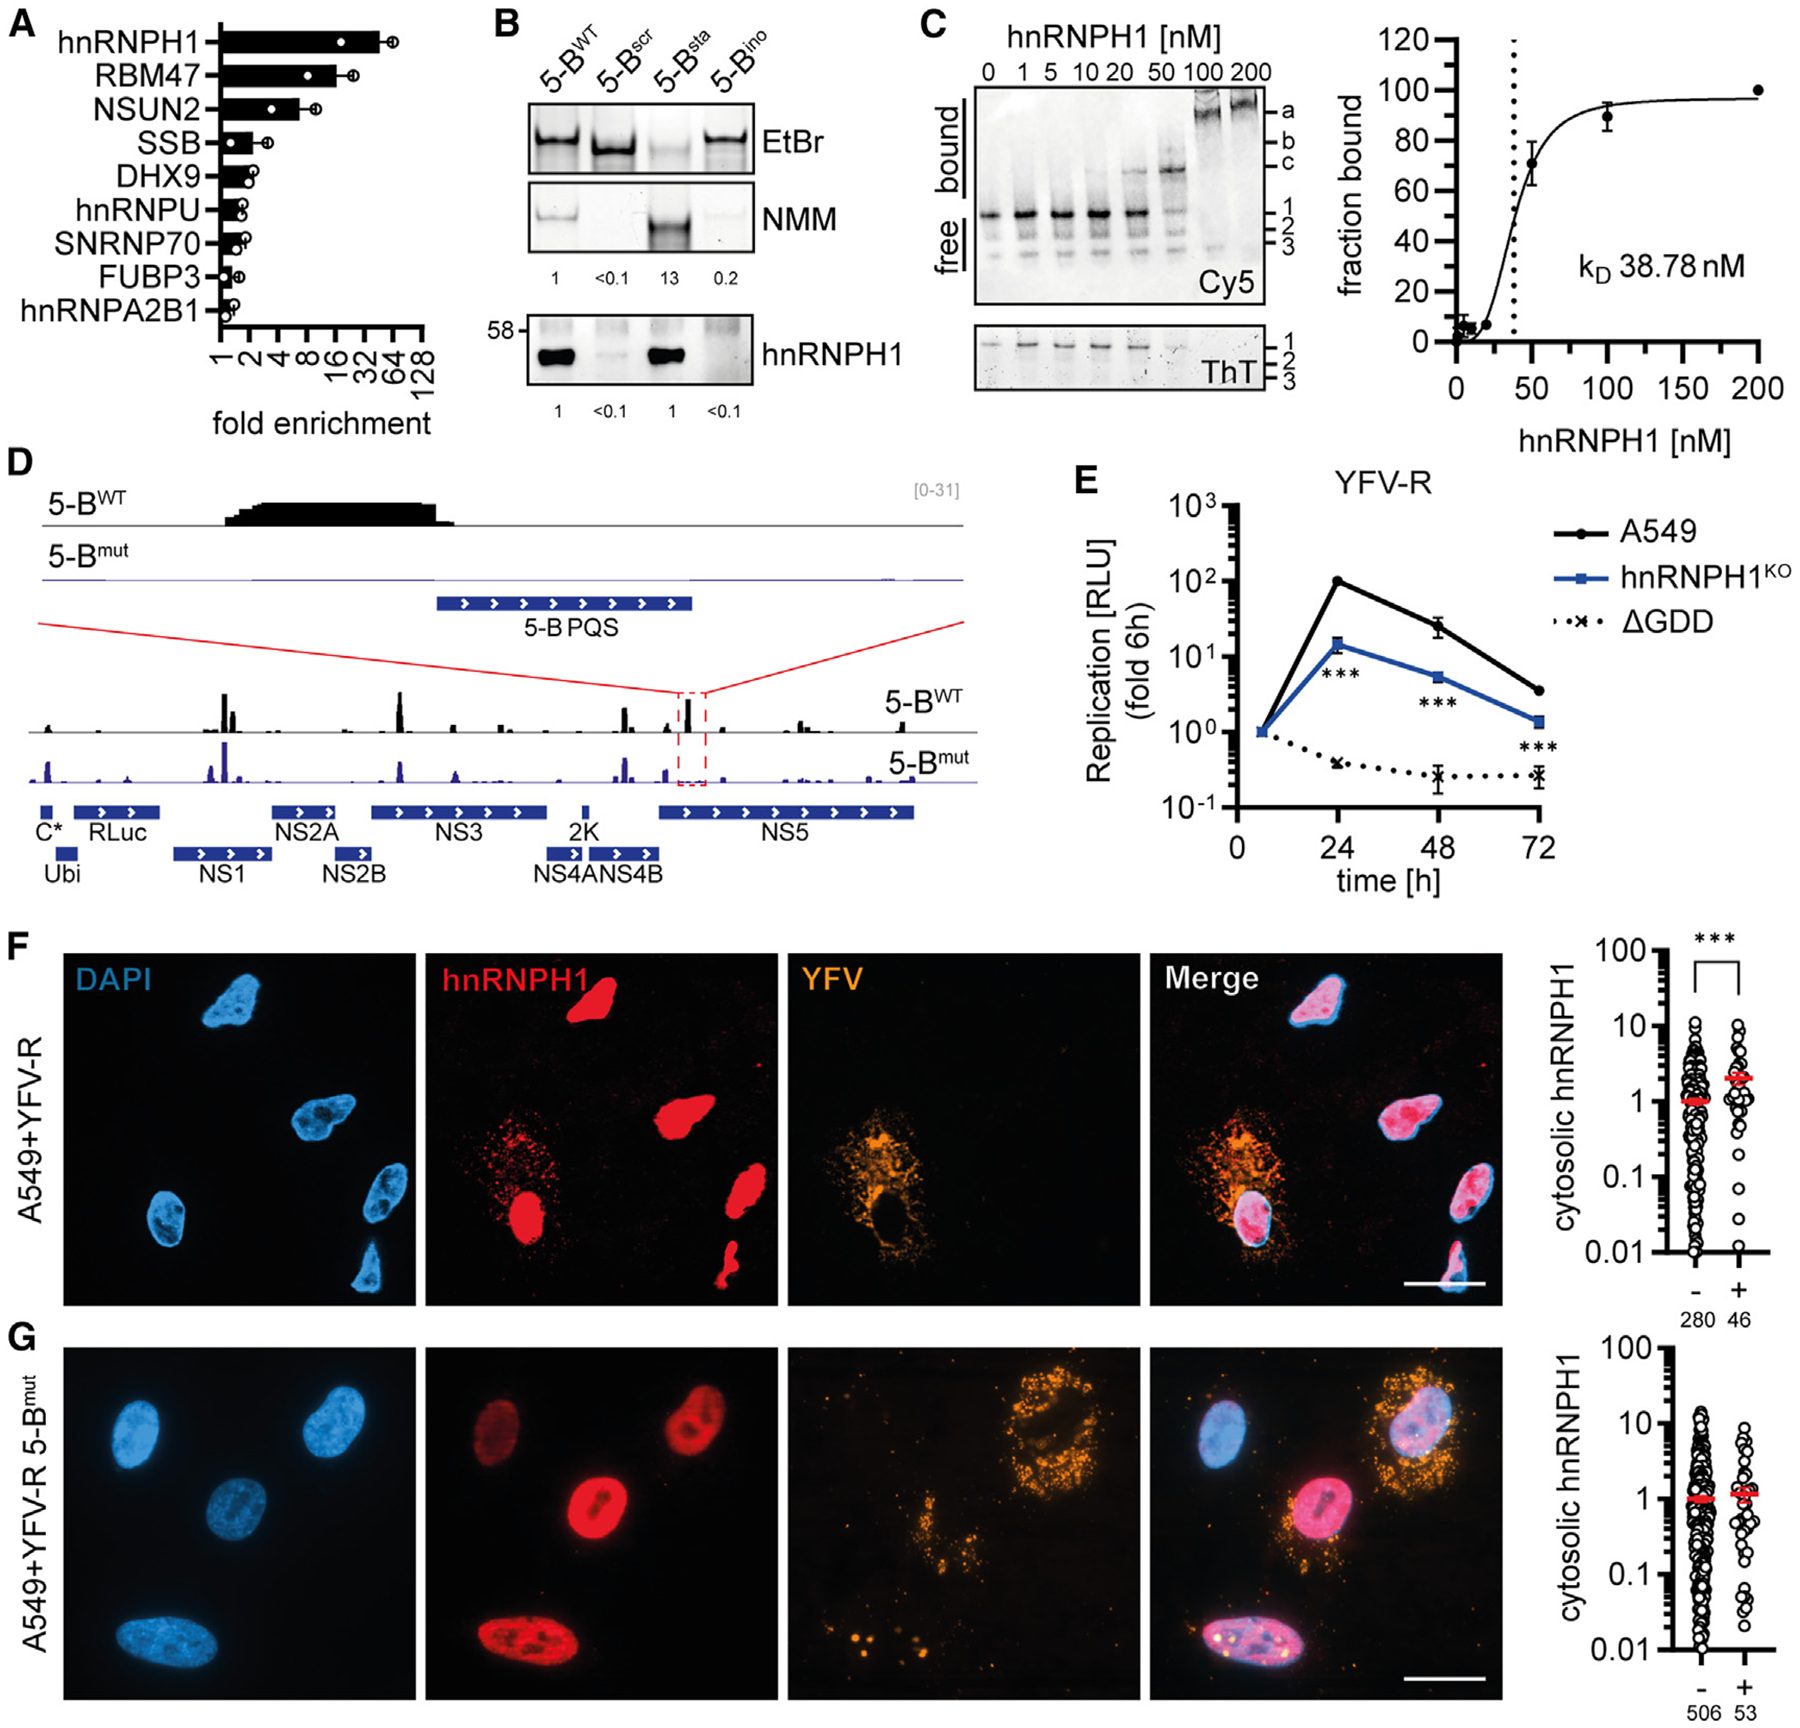
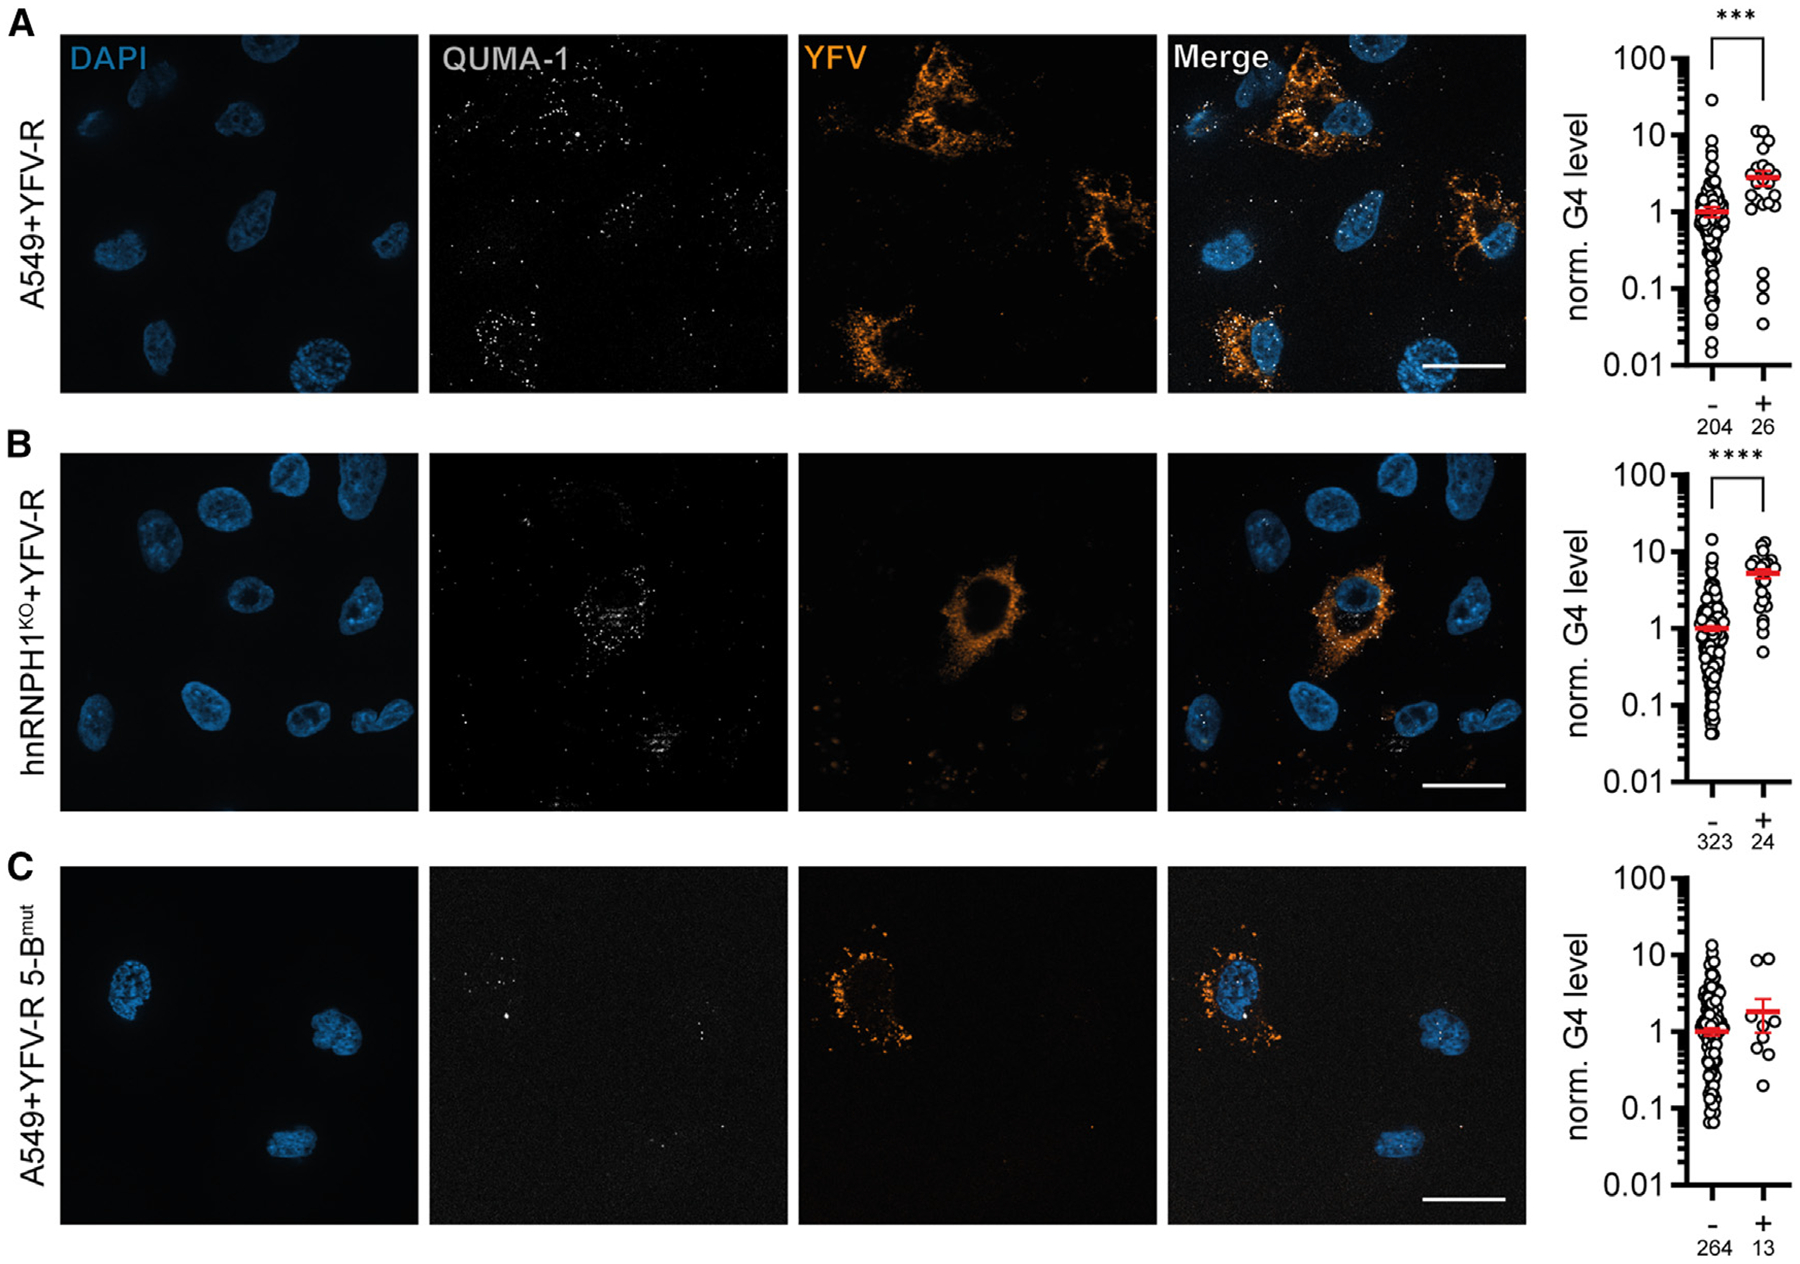
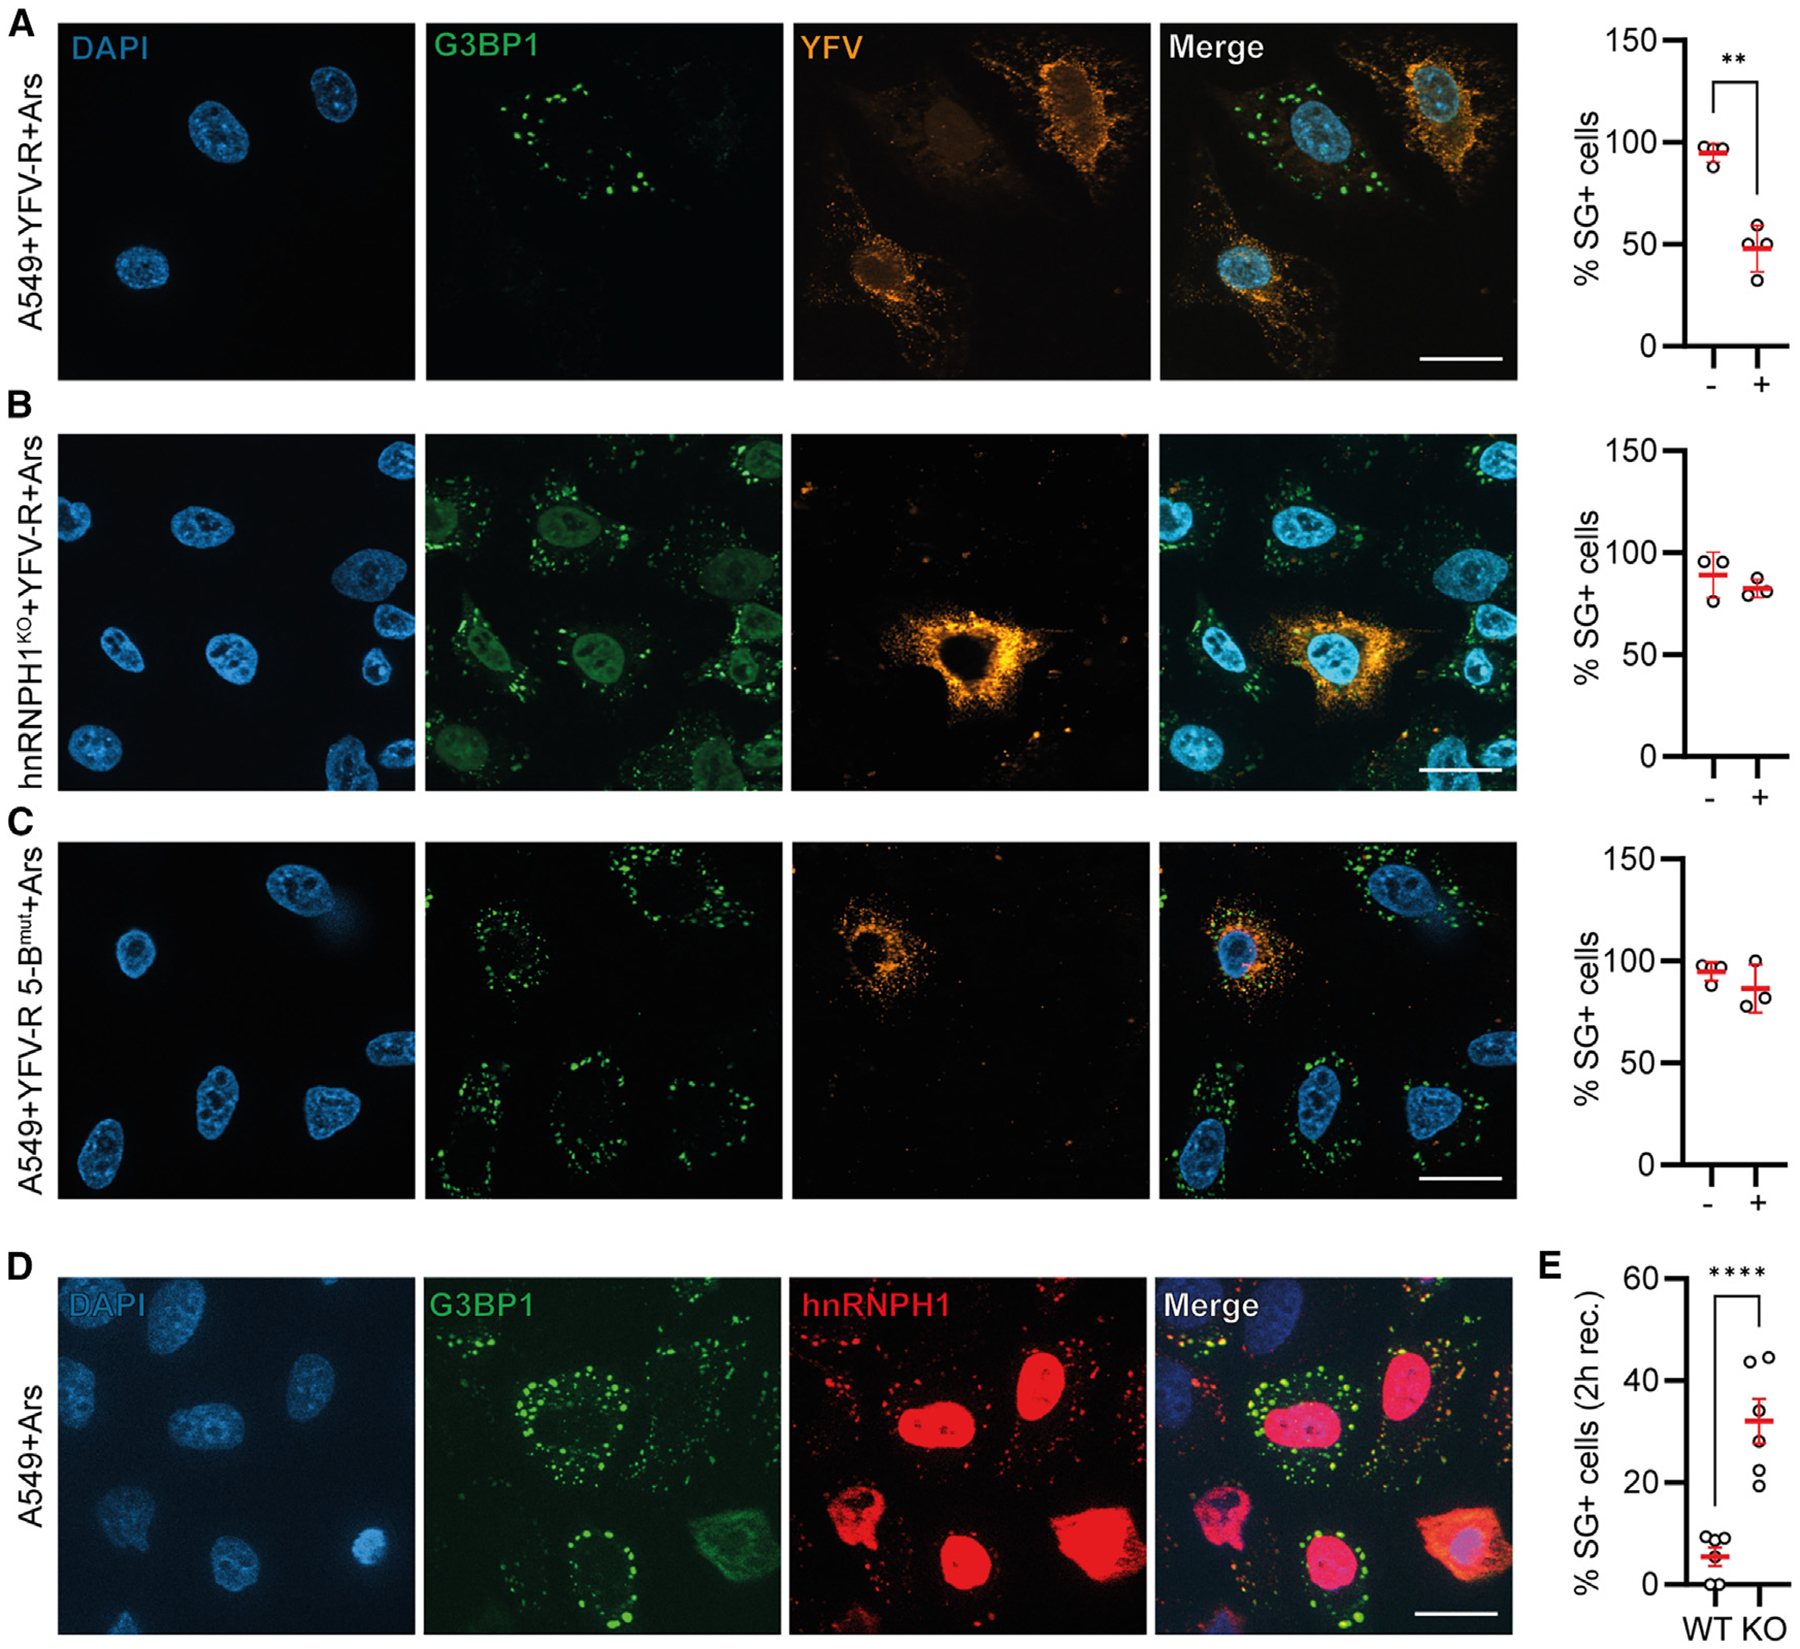
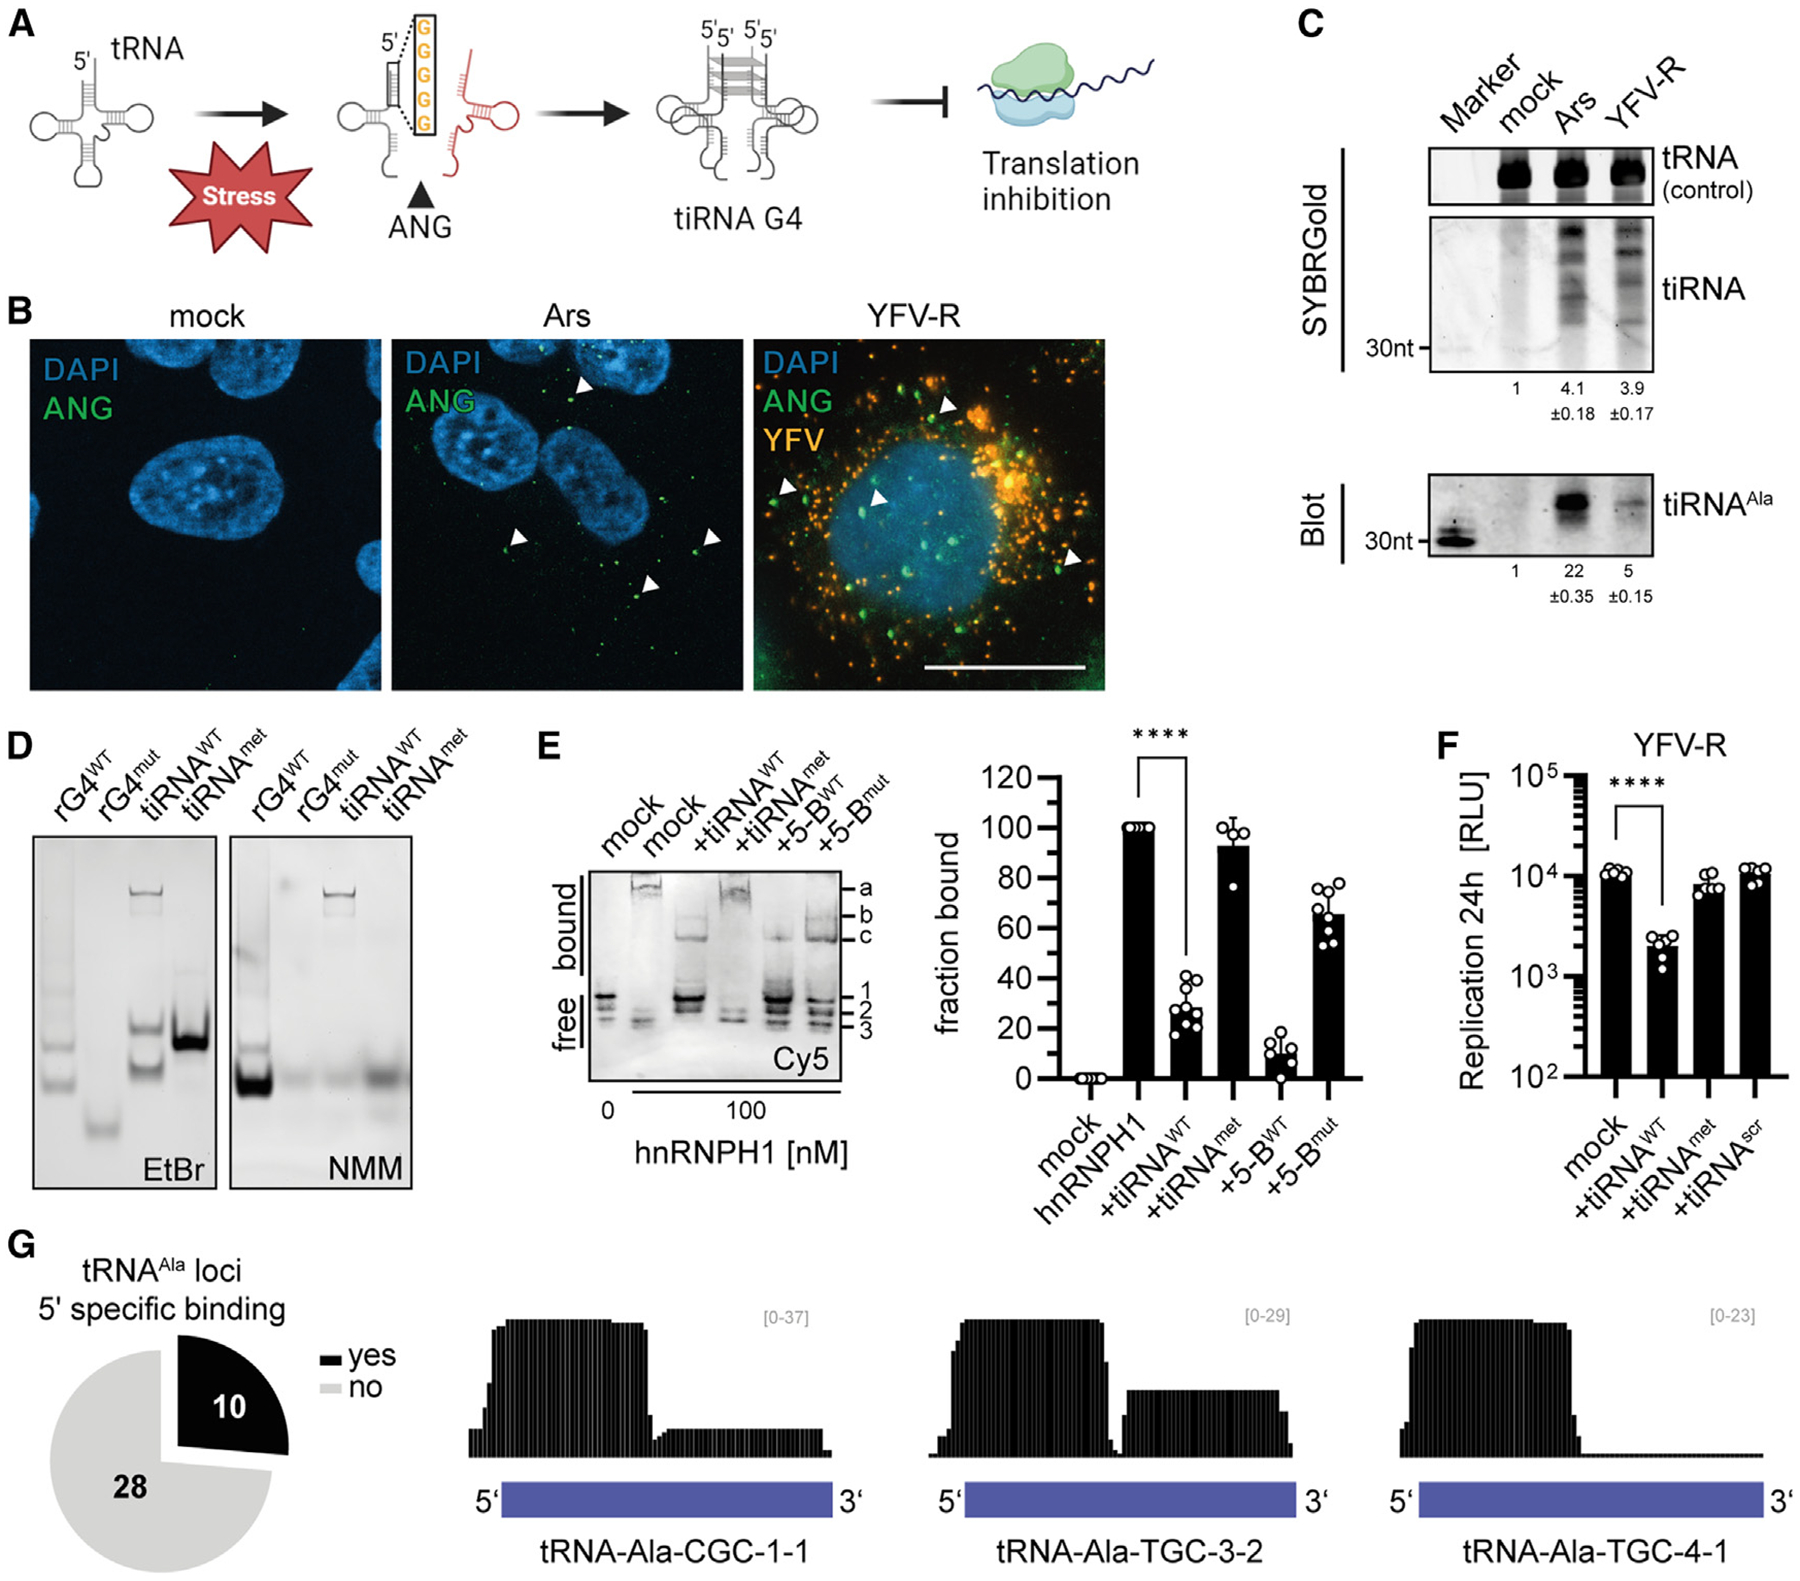
Viral genomes are enriched with G-quadruplexes (G4s), non-canonical structures formed in DNA or RNA upon assembly of four guanine stretches into stacked quartets. Because of their critical roles, G4s are potential antiviral targets, yet their function remains largely unknown. Here, we characterize the formation and functions of a conserved G4 within the polymerase coding region of orthoflaviviruses of the Flaviviridae family. Using yellow fever virus, we determine that this G4 promotes viral replication and suppresses host stress responses via interactions with hnRNPH1, a host nuclear protein involved in RNA processing. G4 binding to hnRNPH1 causes its cytoplasmic retention with subsequent impacts on G4-containing tRNA fragments (tiRNAs) involved in stress-mediated reductions in translation. As a result, these host stress responses and associated antiviral effects are impaired. These data reveal that the interplay between hnRNPH1 and both host and viral G4 targets controls the integrated stress response and viral replication.

Keywords: G-quadruplex; antiviral stress response; hnRNPH1; host factor; orthoflavivirus; tiRNA.


Conflict of interest statement

Declaration of interests The authors declare no competing interests.

Figures

Figure 1.
Figure 1.. Conserved G-rich sequences in YFV can form G4s
(A) General composition of a PQS and G-quadruplex structure. (B) YFV genome and the position of the previously reported PQS. (C) Evolutionary conservation of G-tracts in selected genomic regions of 18 mosquito-borne orthoflaviviruses. (D) Native TBE acrylamide gel analysis of the oligonucleotides with total RNA staining (ethidium bromide [EtBr]) or a G4 light-up probe (N-methylmesoporphyrin IX [NMM]). (E) CD spectroscopy of oligonucleotides containing the conserved PQS and respective scramble mutants as negative controls.
Figure 2.
Figure 2.. The 5′ G-tracts of the 5-B PQS are involved in G4 formation
(A) Schematic representation of the YFV replicon (YF-R). C* represents the 20 N-terminal amino acids of the YFV capsid protein, followed by ubiquitin (ubi). This is followed by a Renilla luciferase fused to an autoproteolytic peptide of the foot-and-mouth disease virus (FMDV) 2A protease (RLuc.2A) and the C-terminal 22 amino acids of the envelope protein (E22). The arrowhead indicates the approximate position of the 5-B G4. (B) Sequence alignment of the introduced mutations (red) within the 5-B PQS. Nucleotide positions are numbered relative to the YFV NS5 coding sequence. (C) Native TBE gel analysis of oligonucleotides containing the WT or mutated PQS with total RNA (EtBr) or a G4 light-up probe (NMM). (D) Quantification of SHALiPE signal for a control G4 sequence (GGGAA)4. (E–G) SHALiPE of WT (E), 5-Bmut (F), and 5-Bsta (G) PQS, folded in presence of K+ (black bars) or Li+ (red lines). Black asterisks below represent the first major stop positions in the corresponding RT stop assay (E). Red asterisks above indicate increased SHAPE reactivity under Li+ folding conditions. The structures to the right depict the inferred folding of a putative G4. Each nucleotide is colored corresponding to its normalized reactivity. Red: ≥0.8; orange: ≥0.4; white: <0.4. All experiments were performed in three independent biological replicates. Data are represented as mean ± SEM.
Figure 3.
Figure 3.. The 5-B G4 supports orthoflavivirus replication by stress reduction
(A) Luciferase reporter assay to monitor replication of the WT and mutated replicons over a time course of 72 h. ΔGDD: replication dead control. (B) qPCR monitoring interferon β induction over the course of viral replication. (C) Western blot for eIF2α phosphorylation as general marker of ISR activation. Below is the ratio of total and phosphorylated eIF2α, normalized to mock. Arsenite was used as positive control. (D and E) In situ hybridization/immunofluorescence assay performed at 24 h post electroporation of the YFV replicon to monitor cellular stress induction (G3BP1 as marker for stress granules) and viral RNA (RNAScope ISH probe). Stress granules were quantified in YFV negative (−) and positive (+) cells after transfection of WT (D) or 5-Bmut (E) replicon. Scale bars represent 20 mm. The quantification is shown to the right. All experiments were performed in three independent biological replicates. Data are represented as mean ± SD. Statistical significance (Student’s t test) is represented by asterisks: *p < 0.05, **p < 0.01, ***p < 0.001, ****p < 0.0001.
Figure 4.
Figure 4.. hnRNPH1 is a pro-viral G4-specific interactor of the YFV genome
(A) Evaluation of G4 binders after pull-down with 5-BWT versus 5-Bscr oligonucleotides containing a 3′ biotin tag (n = 2). (B) Identification of determinants in sequence or structure. Top: native gel analysis and corresponding total RNA (EtBr) and G4s (NMM). The ratio of band intensities used as estimate for G4 formation is shown below. All values were normalized to WT. Bottom: pull-down efficiency of hnRNPH1 detected by western blot. Below are the band intensities relative to WT. (C) Electrophoretic mobility shift assay (EMSA) to determine the KD of hnRNPH1 to the 5-B G4. Top: visualization of hnRNPH1:RNA complexes by streptavidin-Cy5. Free RNA bands are labeled 1–3, complexes are labeled a–c. Bottom: in-gel ThT staining of G4-forming conformers. Bands are labeled 1–3. Right: Hill diagram and KD calculation of EMSA data. (D) hnRNPH1 interaction sites on YFV-R WT (n = 3) or 5-Bmut (n = 1) RNA determined by PAR-CLIP. (E) Luciferase reporter assay to monitor replication of YFV replicon in A549 and hnRNPH1KO cells. (F and G) Immunofluorescence assay to determine localization of hnRNPH1 upon replication of WT (F) or 5-Bmut (G) replicon. Scale bars represent 20 μm. Cell counts are indicated below. ΔGDD: replication dead control. All experiments were performed in three independent biological replicates, except when stated otherwise. Data are represented as mean ± SD. Statistical significance (Whitney-Mann) is represented by asterisks: *p < 0.05, **p < 0.01, ***p < 0.001, ****p < 0.0001.
Figure 5.
Figure 5.. hnRNPH1 acts as G4 destabilizer in viral RNA replication
(A and B) Detection of G4s (QUMA-1) and YFV replicon RNA (RNAScope in situ hybridization probe) for the WT replicon in A549 (A) and hnRNPH1KO cells (B). (C) Assay as in (A), but with the 5-Bmut replicon. G4s in the cytoplasm were quantified separately for YFV replicon negative (−) and positive (+) cells. The quantification of the individual cells is shown to the right. Cell counts are indicated below. Scale bars represent 20 μm. All experiments were performed in three independent biological replicates. Data are represented as mean ± SD. Statistical significance (Whitney-Mann) is represented by asterisks: *p < 0.05, **p < 0.01, ***p < 0.001, ****p < 0.0001.
Figure 6.
Figure 6.. hnRNPH1 supports viral suppression of persistent stress
(A and B) In situ hybridization/immunofluorescence assay to monitor cellular stress induction (G3BP1 as marker for stress granules) and viral RNA (RNAScope ISH probe) after 30 min treatment with arsenite. The assay was performed at 24 h post electroporation of naive A549 (A) or hnRNPH1KO (B) cells with the WT replicon. Stress granules were quantified in YFV replicon negative (−) and positive (+) cells. Quantification of cells containing SG for WT replicon and 5-B mutants is shown to the right. (C) Assay as in (A), but with the 5-Bmut replicon. (D) Immunofluorescence assay to examine hnRNPH1 localization after treatment with arsenite. (E) IF-based stress relief assay. Each data point represents the quantification of SG in A549 WT and hnRNPH1KO cells, 2 h after removal of arsenite. Scale bars represent 20 mm. All experiments were performed in three independent biological replicates. Data are represented as mean ± SD. Statistical significance (Student’s t test) is represented by asterisks: *p < 0.05, **p < 0.01, ***p < 0.001, ****p < 0.0001.
Figure 7.
Figure 7.. tiRNAs link virally induced stress with the G4-binding activity of hnRNPH1
(A) Overview of tiRNA generation, G4-assembly, and function (created with Biorender.com). (B) Immunofluorescence analysis of ANG localization in response to different stressors. Exemplary ANG specks are marked by white triangles. (C) Induction of tiRNAs upon arsenite or transfection of viral RNA. Total tiRNA levels were determined by denaturing urea PAGE, stained with SYBR gold. 1 ng of synthetic tiRNAAla was used as size marker and positive control. tRNA is shown as loading control. Northern blot analysis was performed to measure levels of tiRNAAla. The quantification of each signal relative to the mock sample is given below. (D) Native gel analysis of tiRNAAla WT and mut stained for total RNA (EtBr) and G4s (NMM). (E) EMSA competition assay. Left: visualization of hnRNPH1:RNA complex formation by streptavidin Cy5 in presence of different competitors. Free RNA bands are labeled 1–3, complexes are labeled a–c. Right: quantification of EMSA data. (F) Luciferase assay of YFV reporter replicon in presence of tiRNAAla WT, mut, or arsenite in A549 or hnRNPH1KO cells. Shown is the signal at 24 h post electroporation, normalized to the respective 6-h value. (G) Evaluation of PAR-CLIP data for 5′ tRNAAla binding by hnRNPH1. Three representative loci are shown and named according to the GtRNAdb. Data are represented as mean ± SD. All experiments were performed in three independent biological replicates. Statistical significance (Student’s t test) is represented by asterisks: *p < 0.05, **p < 0.01, ***p < 0.001, ****p < 0.0001.

Similar articles

Cited by

References

    1. Postler TS, Beer M, Blitvich BJ, Bukh J, de Lamballerie X, Drexler JF, Imrie A, Kapoor A, Karganova GG, Lemey P, et al. (2023). Renaming of the genus Flavivirus to Orthoflavivirus and extension of binomial species names within the family Flaviviridae. Arch. Virol 168, 224. 10.1007/s00705-023-05835-1. - DOI - PubMed
    1. Bryan CS, Moss SW, and Kahn RJ (2004). Yellow fever in the Americas. Infect. Dis. Clin. N. Am 18, 275–292. 10.1016/j.idc.2004.01.007. - DOI - PubMed
    1. Alonso-Palomares LA, Moreno-García M, Lanz-Mendoza H, and Salazar MI (2018). Molecular basis for arbovirus transmission by Aedes aegypti mosquitoes. Intervirology 61, 255–264. 10.1159/000499128. - DOI - PubMed
    1. Monath TP, and Barrett ADT (2003). Pathogenesis and pathophysiology of yellow fever. Adv. Virus Res 60, 343–395. 10.1016/s0065-3527(03)60009-6. - DOI - PubMed
    1. Garske T, Van Kerkhove MD, Yactayo S, Ronveaux O, Lewis RF, Staples JE, Perea W, and Ferguson NM; Yellow; Fever; Expert Committee (2014). Yellow fever in Africa: estimating the burden of disease and impact of mass vaccination from outbreak and serological data. PLoS Med. 11, e1001638. 10.1371/journal.pmed.1001638. - DOI - PMC - PubMed

LinkOut - more resources