. 2024 Sep 18;391(1):119-129.
doi: 10.1124/jpet.124.002218.

Primaquine-5,6-Orthoquinone Is Directly Hemolytic to Older G6PD Deficient RBCs in a Humanized Mouse Model

Affiliations

Primaquine-5,6-Orthoquinone Is Directly Hemolytic to Older G6PD Deficient RBCs in a Humanized Mouse Model

Karolina H Dziewulska-Cronk et al. J Pharmacol Exp Ther. .

Abstract

Primaquine and Tafenoquine are the only approved drugs that can achieve a radical cure for Plasmodium vivax malaria but are contraindicated in patients who are deficient in glucose 6-phosphate dehydrogenase (G6PDd) due to risk of severe hemolysis from reactive oxygen species generated by redox cycling of drug metabolites. 5-hydroxyprimaquine and its quinoneimine cause robust redox cycling in red blood cells (RBCs) but are so labile as to not be detected in blood or urine. Rather, the quinoneimine is rapidly converted into primaquine-5,6-orthoquinone (5,6-POQ) that is then excreted in the urine. The extent to which 5,6-POQ contributes to hemolysis remains unclear, although some have suggested that it is a minor toxin that should be used predominantly as a surrogate to infer levels of 5-hydroxyprimaquine. In this report, we describe a novel humanized mouse model of the G6PD Mediterranean variant (hG6PDMed-) that recapitulates the human biology of RBC age-dependent enzyme decay, as well as an isogenic matched control mouse with human nondeficient G6PD hG6PDND In vitro challenge of RBCs with 5,6-POQ causes increased generation of superoxide and methemoglobin. Infusion of treated RBCs shows that 5,6-POQ selectively causes in vivo clearance of older hG6PDMed- RBCs. These findings support the hypothesis that 5,6-POQ directly induces hemolysis and challenges the notion that 5,6-POQ is an inactive metabolic waste product. Indeed, given the extreme lability of 5-hydroxyprimaquine and the relative stability of 5,6-POQ, these data raise the possibility that 5,6-POQ is a major hemolytic primaquine metabolite in vivo. SIGNIFICANCE STATEMENT: These findings demonstrate that 5,6-POQ, which has been considered an inert waste product of primaquine metabolism, directly induces ROS that cause clearance of older G6PDd RBCs. As 5,6-POQ is relatively stable compared with other active primaquine metabolites, these data support the hypothesis that 5,6-POQ is a major toxin in primaquine induced hemolysis. The findings herein also establish a new model of G6PDd and provide the first direct evidence, to our knowledge, that young G6PDd RBCs are resistant to primaquine-induced hemolysis.


Figures

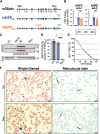
Fig. 1.
Fig. 1.
Generation and characterization of a matched set of humanized mice expressing either nondeficient or the Mediterranean variant of human G6PD. (A) Schematic diagram of the genetic modification in each animal. Blue boxes and gray boxes indicate human and murine exon sequences, respectively. The hG6PDND mouse used the nondeficient B+ variant, while the hG6PDMed- mouse encoded the S188F variant in exon 6 (exons numbered the same for mice as in humans) that constitutes the human Mediterranean-deficient variant. FRT sites (green) identify scars from excision of the FLP flanked neomycin cassette used to select ES cells. (B) mRNA levels by qPCR using two different primer/probe combinations specific for human G6PD mRNA spanning exons 3–4 (left panel) or exons 4–5 (right panel). mRNA expression is normalized to murine beta-actin expression and there was no significant (ns) difference in humanized mRNA expression in hG6PDND vs. hG6PDMed- mice (Brown-Forsythe and Welch ANOVA with Dunnett’s T3 multiple comparisons were used as data did not meet the criteria for being normally distributed). Each RT-qPCR assay was repeated four times (representative experiment shown) and bar graphs represent means with error bars indicating standard deviation. For each experiment, between three and six independent biological samples were prepared for each genotype (biological replicates) and each mRNA was amplified in triplicate (technical replicates). Every sample had a control in which reverse transcriptase was omitted to test for any amplification from contaminating DNA. (C) Western blot measuring G6PD protein in RBC lysates using an antibody specific for human G6PD. The top and middle blots are the same blot with the middle blot being a long overexposure to reveal trace amounts of hG6PD protein in hG6PDMed- RBCs. Three different mice from each strain (wild-type), hG6PDND, or hG6PDMed-) were tested. A low amount of recombinant human G6PD (rG6PD, 10 ng/lane) was included to establish the limits of detection. Each sample was also tested for beta-actin to control for loading differences. (D) G6PD enzyme activity of RBCs from each strain (one-way ANOVA with Sidak’s multiple comparisons test, *P < 0.05, **** P < 0.001). (E) RBC circulatory lifespan of each strain. Mice underwent whole blood biotinylation and were repeatedly phlebotomized over the course of the experiment. Biotinylated [i.e., streptavidin reactive (StAv+)] RBCs were enumerated with flow cytometry at the indicated timepoints. (F) Light microscopy of peripheral blood smears stained with Wright-Giemsa stain (left panel) or a reticulocyte stain (right panel). In the absence of oxidative stress, RBCs had mostly normal morphology, with some indication of poikilocytosis (V and *). Consistent with flow cytometry, reticulocyte (arrows) numbers were similar between strains. Light microscopy used a 63x objective and digital images were recorded with a Leica DMC4500 color camera (size bar indicates 5 μM at 630x magnification). Each experiment was performed at least three times with similar results and representative experiments are shown. All data points shown are derived from samples taken from different mice (biological replicates) and do not represent technical replicates. In all cases, 3–5 mice were used per group, bar values represent means, and error bars represent standard deviation. Please note that in panel E, error bars are present but too small to be easily seen.
Fig. 2.
Fig. 2.
Young RBCs fromhG6PDMed-- mice have increased G6PD protein and enzymatic-activity. Wild-type, hG6PDND, and hG6PDMed-- mice were subjected to in vivo biotinylation and blood was harvested 6 days postbiotinylation. (A) Experimental schematic highlights the in vivo biotinylation and streptavidin-based depletion of RBCs older than 6 days of age. (B) All RBCs were stained with thiazole orange to visualize reticulocytes, combined with either streptavidin [StAv (top row) or anti-CD71 (bottom row)]. Flow cytometric analysis of thiazole orange x streptavidin staining demonstrates 99% biotinylation on day zero postbiotinylation that decreases to 85% at day 6 post biotinylation as new (and unbiotinylated) RBCs emerge from the bone marrow. As predicted, reticulocyte (thiazole orange +) events are contained in the young (StAv negative) population on day 6 postbiotinylation. Of the thiazole orange + reticulocytes, 76% are CD71-positive, indicating young reticulocytes. (C) Flow cytometric analysis of biotin pulse-chased and control (mock-chased) samples undergoing streptavidin depletion demonstrates enrichment in streptavidin nonreactive (young) reticulocytes (thiazole orange and CD71+). (D) Western blot analysis with an antibody reactive with both human and mouse G6PD in lysates from the mock-depleted (all ages) and streptavidin-depleted (young) RBCs shows increased G6PD protein in young hG6PDMed- lysates compared with all age lysates. Molecular weights are noted to the right of the blot (in kDa) and are estimated based on molecular marker standard (not shown). Raw images are contained in supplemental information. (E) Change in G6PD enzymatic activity of young vs. all age RBCS for each strain. Activity in young RBCs vs. all age RBCs is normalized to baseline activity in hG6PDND RBCs. Each point represents the values of blood pooled from 3–5 animals, which is required to obtain sufficient volume of young RBCs to perform the assay — no statistical test was performed as individual mouse data are not available (due to pooling), but differences far exceed two standard deviations [shown as error bars (on the graph)], which by standard distribution theory represents a significant finding. The height of the bar represents the mean. Each experiment in this figure was performed at least three times with similar results, and a representative experiment is shown. Error bars represent standard deviation.
Fig. 3.
Fig. 3.
YounghG6PDMed-- RBCs are resistant to 5,6-POQ induced hemolysis. (A) Blood at day 6 postbiotinylation was collected and treated with the indicated concentrations of 5,6-POQ for 1 hour at 37°C and then washed. A fixed number of mCherry+ RBCs were added to each tube as a tracer control and then transfused into GFP transgenic recipient mice. (B) Gating strategy to separate test vs. control RBCs (GFP- vs. GFP+, respectively) and to enumerate tracer [StAv-, mCherry+ (pink gate)], younger [StAv-, mCherry-(blue gate)], and older [StAv+, mCherry-(violet gate)]. (C) In vitro hemolysis was assayed by enumerating young and older test RBCs vs. mCherry RBCs in the input mix by flow cytometry. As such, individual values are not shown as the bar value represents determination from thousands of events counted by flow cytometry. (D) Circulation of young (filled-in symbols, solid line) and older (empty symbols, dashed line) RBCs was assayed over time and graphed as ratio of test:tracer RBCs of indicated time point to input test:tracer ratio, and normalized to respective vehicle control. Representative data are shown for one of two independent experiments, with mixed blood from 3–5 donor mice for each condition. Please see figure legend for Fig. 2 for statistical considerations. In vivo graph represents recipient (n = 3) means ± S.D.
Fig. 4.
Fig. 4.
Electron microscopy of hG6PDND and hG6PDMed- RBCs in the absence or presence of 5,6-POQ. Arrows indicate damaged RBCs with altered morphology in each group.
Fig. 5.
Fig. 5.
hG6PDMed- RBCs have increased superoxide and MetHb levels in response to 5,6-POQ exposure (A+B) Superoxide was assayed by EPR through measurement of the unique spectrum generated by CM• formation as a result of superoxide reaction with the 1-hydroxy-3-methoxycarbonyl-2,2,5,5-tetramethylpyrrolidine spin probe. Treatment with 150 μM 5,6-POQ causes CM• concentration to rise more steeply in hG6PDMed- RBCs (panel B) than in hG6PDND RBCs (panel A), indicating higher superoxide concentration in the former. Quadruplicate data sets are plotted with different symbols (○▽◊▵) with corresponding least-squares fitted lines (dashed, solid, dotted, short-dashed). Each bold solid line is the average of all least-squares lines in the data set. Red: 5,6-POQ treatment; blue: vehicle control; gray, buffer control (cell-free PBS-G). (C+D) Methemoglobin (MetHb) concentration (panel C) and production rate (panel D) were measured over the course of 1 hour incubation with 150 μM 5,6-POQ using a ABL90 FLEX blood gas analyzer. This experiment was repeated three times with similar results. Each point shows mean and error bars represent ± S.D.
Fig. 6.
Fig. 6.
5,6-POQ treatment induces a specific metabolic lesion that is exacerbated in hG6PDMed- RBCs. RBCs treated with the indicated concentration of 5,6-POQ, in the presence of [1,2,3-13C3]glucose, were subjected to metabolomic analysis. (A) Glycolysis and the PPP were analyzed for steady state metabolite levels and flux was inferred by different 13C species abundance. The isotope at each carbon is indicated by red and white circles and 12C vs. 13C at each position is indicated by different shades in the bar graph to show relative amounts of labeled vs. endogenous unlabeled metabolites. (B) Lactate 13C2/13C3 levels indicate shunting of PPP back into distal glycolysis. (C) Free (GSH) and oxidized glutathione were measured. These data are the combined measurements from three different experiments.
Fig. 7.
Fig. 7.
Model of primaquine metabolism with 5,6-POQ as a major hemolytic metabolite. Primaquine is a prodrug that is neither antimalarial nor hemolytic as a parent compound but undergoes metabolism by two main pathways. Primaquine is metabolized into carboxy primaquine through successive actions of monoamine oxidase A (MAO-A) and aldehyde dehydrogenase (ALDH). Alternatively, cytochrome p450s (CYP) convert primaquine to a series of monohydroxy forms (in this case 5-hydroxyprimaquine) The reactive 5-hydroxyprimaquine metabolite undergoes redox cycling if an appropriate enzymatic reductase (also called diaphorase) is present as indicated in red (Vásquez-Vivar and Augusto, 1992). Enzymatic reduction of the 5-hydroxyprimaquine produces a more stable quinone-imine, which has been detected both in plasma and urine (Avula et al., 2018) (Gray box). Although the 5-hydroxyprimaquine/5-quinone-imine can generate robust ROS through redox cycling (gray box), the quinone-imine is rapidly converted to the more stable 5,6-POQ, detected in RBCs and urine (Avula et al., 2018; Khan et al., 2021). The results of the present study confirm the hemotoxic property of 5,6-POQ through further redox cycling (blue box).

References

    1. Agarwal S, Gupta UR, Daniel CS, Gupta RC, Anand N, Agarwal SS (1991) Susceptibility of glucose-6-phosphate dehydrogenase deficient red cells to primaquine, primaquine enantiomers, and its two putative metabolites. II. Effect on red blood cell membrane, lipid peroxidation, MC-540 staining, and scanning electron microscopic studies. Biochem Pharmacol 41:17–21. - PubMed
    1. Agarwal S, Gupta UR, Gupta RC, Anand N, Agarwal SS (1988) Susceptibility of glucose-6-phosphate dehydrogenase deficient red cells to primaquine enantiomers and two putative metabolites–I. Effect on reduced glutathione, methemoglobin content and release of hemoglobin. Biochem Pharmacol 37:4605–4609. - PubMed
    1. Au SW, Gover S, Lam VM, Adams MJ (2000) Human glucose-6-phosphate dehydrogenase: the crystal structure reveals a structural NADP(+) molecule and provides insights into enzyme deficiency. Structure 8:293–303. - PubMed
    1. Augusto O, Schreiber J, Mason RP (1988) Direct ESR detection of a free radical intermediate during the peroxidase-catalyzed oxidation of the antimalarial drug primaquine. Biochem Pharmacol 37:2791–2797. - PubMed
    1. Avula BTekwani BLChaurasiya NDFasinu PDhammika Nanayakkara NPBhandara Herath HMTWang Y-HBae J-YKhan SIElsohly MA, et al. (2018) Metabolism of primaquine in normal human volunteers: investigation of phase I and phase II metabolites from plasma and urine using ultra-high performance liquid chromatography-quadrupole time-of-flight mass spectrometry. Malar J 17:294. - PMC - PubMed

Publication types

LinkOut - more resources