

Anlotinib potentiates anti-PD1 immunotherapy via transferrin receptor-dependent CD8+ T-cell infiltration in hepatocellular carcinoma
- PMID: 39095323
- PMCID: PMC11296886
- DOI: 10.1002/ctm2.1738
Anlotinib potentiates anti-PD1 immunotherapy via transferrin receptor-dependent CD8+ T-cell infiltration in hepatocellular carcinoma
Abstract
Background: The therapeutic potential of immune checkpoint blockade (ICB) extends across various cancers; however, its effectiveness in treating hepatocellular carcinoma (HCC) is frequently curtailed by both inherent and developed resistance.
Objective: This research explored the effectiveness of integrating anlotinib (a broad-spectrum tyrosine kinase inhibitor) with programmed death-1 (PD-1) blockade and offers mechanistic insights into more effective strategies for treating HCC.
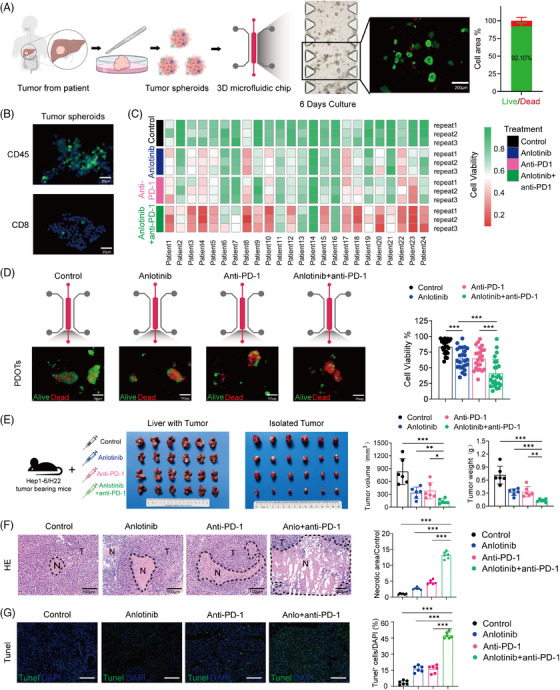
Methods: Using patient-derived organotypic tissue spheroids and orthotopic HCC mouse models, we assessed the effectiveness of anlotinib combined with PD-1 blockade. The impact on the tumour immune microenvironment and underlying mechanisms were assessed using time-of-flight mass cytometry, RNA sequencing, and proteomics across cell lines, mouse models, and HCC patient samples.
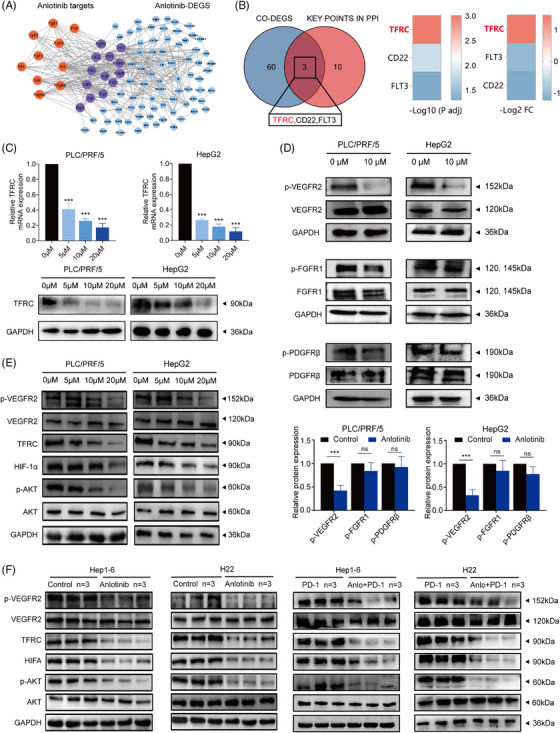
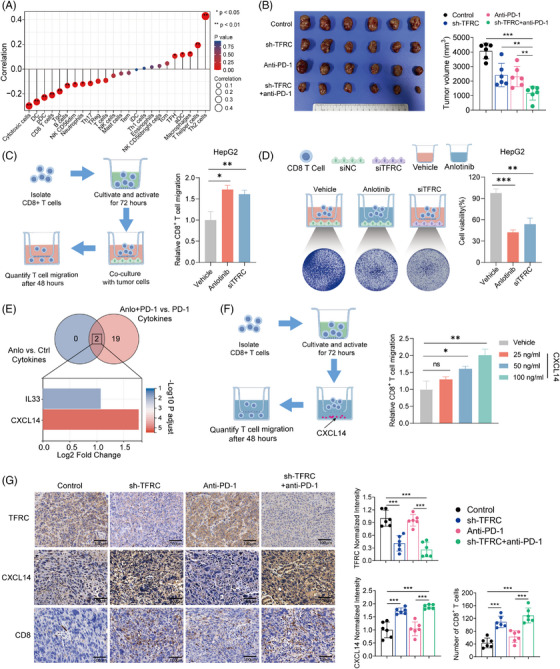
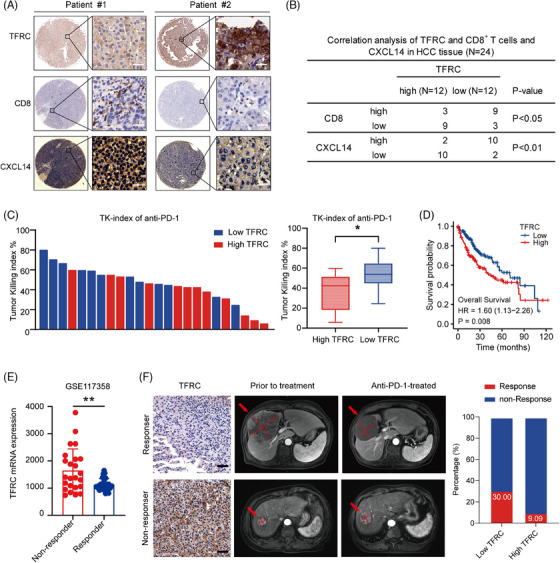
Results: The combination of anlotinib with an anti-PD-1 antibody enhanced the immune response against HCC in preclinical models. Anlotinib remarkably suppressed the expression of transferrin receptor (TFRC) via the VEGFR2/AKT/HIF-1α signaling axis. CD8+ T-cell infiltration into the tumour microenvironment correlated with low expression of TFRC. Anlotinib additionally increased the levels of the chemokine CXCL14, crucial for attracting CD8+ T cells. CXCL14 emerged as a downstream effector of TFRC, exhibiting elevated expression following the silencing of TFRC. Importantly, low TFRC expression was also associated with a better prognosis, enhanced sensitivity to combination therapy, and a favourable response to anti-PD-1 therapy in patients with HCC.
Conclusions: Our findings highlight anlotinib's potential to augment the efficacy of anti-PD-1 immunotherapy in HCC by targeting TFRC and enhancing CXCL14-mediated CD8+ T-cell infiltration. This study contributes to developing novel therapeutic strategies for HCC, emphasizing the role of precision medicine in oncology.
Highlights: Synergistic effects of anlotinib and anti-PD-1 immunotherapy demonstrated in HCC preclinical models. Anlotinib inhibits TFRC expression via the VEGFR2/AKT/HIF-1α pathway. CXCL14 upregulation via TFRC suppression boosts CD8+ T-cell recruitment. TFRC emerges as a potential biomarker for evaluating prognosis and predicting response to anti-PD-1-based therapies in advanced HCC patients.
Keywords: hepatocellular carcinoma; immune checkpoint blockade; transferrin receptor; tumour microenvironment; tyrosine kinase inhibitor.
© 2024 The Author(s). Clinical and Translational Medicine published by John Wiley & Sons Australia, Ltd on behalf of Shanghai Institute of Clinical Bioinformatics.
Conflict of interest statement
The authors declare no conflict of interest.
Figures


Similar articles
-
Lysine-specific demethylase 1 deletion reshapes tumour microenvironment to overcome acquired resistance to anti-programmed death 1 therapy in liver cancer.Clin Transl Med. 2025 May;15(5):e70335. doi: 10.1002/ctm2.70335. Clin Transl Med. 2025. PMID: 40356247 Free PMC article.
-
Anlotinib enhanced CD8+ T cell infiltration via induction of CCL5 improves the efficacy of PD-1/PD-L1 blockade therapy in lung cancer.Cancer Lett. 2024 Jun 1;591:216892. doi: 10.1016/j.canlet.2024.216892. Epub 2024 Apr 18. Cancer Lett. 2024. PMID: 38621459
-
CRKL dictates anti-PD-1 resistance by mediating tumor-associated neutrophil infiltration in hepatocellular carcinoma.J Hepatol. 2024 Jul;81(1):93-107. doi: 10.1016/j.jhep.2024.02.009. Epub 2024 Feb 23. J Hepatol. 2024. PMID: 38403027
-
Viral status, immune microenvironment and immunological response to checkpoint inhibitors in hepatocellular carcinoma.J Immunother Cancer. 2020 Apr;8(1):e000394. doi: 10.1136/jitc-2019-000394. J Immunother Cancer. 2020. PMID: 32303615 Free PMC article.
-
Anti-PD-1/PD-L1 Blockade Immunotherapy Employed in Treating Hepatitis B Virus Infection-Related Advanced Hepatocellular Carcinoma: A Literature Review.Front Immunol. 2020 May 28;11:1037. doi: 10.3389/fimmu.2020.01037. eCollection 2020. Front Immunol. 2020. PMID: 32547550 Free PMC article. Review.
Cited by
-
Combination of anlotinib with immunotherapy enhanced both anti-angiogenesis and immune response in high-grade serous ovarian cancer.Front Immunol. 2025 Apr 7;16:1539616. doi: 10.3389/fimmu.2025.1539616. eCollection 2025. Front Immunol. 2025. PMID: 40260248 Free PMC article.
-
Off-label use of anlotinib in malignancies' treatment: efficacy and management of adverse reactions.Pharmacol Rep. 2025 Apr;77(2):392-408. doi: 10.1007/s43440-025-00700-1. Epub 2025 Feb 3. Pharmacol Rep. 2025. PMID: 39899257 Free PMC article. Review.
-
ALG3 as a prognostic biomarker and mediator of PD-1 blockade resistance in hepatocellular carcinoma.Front Immunol. 2025 May 22;16:1589153. doi: 10.3389/fimmu.2025.1589153. eCollection 2025. Front Immunol. 2025. PMID: 40475760 Free PMC article.
-
Immune Microenvironment and the Effect of Vascular Endothelial Growth Factor Inhibition in Hepatocellular Carcinoma.Int J Mol Sci. 2024 Dec 19;25(24):13590. doi: 10.3390/ijms252413590. Int J Mol Sci. 2024. PMID: 39769351 Free PMC article. Review.
-
Efficacy and safety of anlotinib monotherapy for advanced hepatocellular carcinoma and clinical role of α-fetoprotein.Sci Rep. 2025 Aug 9;15(1):29209. doi: 10.1038/s41598-025-14759-6. Sci Rep. 2025. PMID: 40783436 Free PMC article.
References
-
- Minton K. Immune checkpoint blockade breaches the mucosal firewall to induce gut microbiota translocation. Nat Rev Immunol. 2023;23:269. - PubMed
-
- Llovet JM, Kelley RK, Villanueva A, et al. Hepatocellular carcinoma. Nat Rev Dis Primers. 2021;7:6. - PubMed
-
- Meric‐Bernstam F, Larkin J, Tabernero J, Bonini C. Enhancing anti‐tumour efficacy with immunotherapy combinations. Lancet. 2021;397:1010‐1022. - PubMed
MeSH terms
Substances
Grants and funding
- 82341027/National Natural Science Foundation of China
- 82072715/National Natural Science Foundation of China
- 2019CXJQ02/Shanghai Municipal Health Commission Collaborative Innovation Cluster Project
- Eastern Talent Program (Leading project)
- 21140900300/Shanghai Science and Technology Commission
- 22S31901800/Shanghai Science and Technology Commission
- SHDC2023CRD025/Shanghai hospital development center
- 201940075/Shanghai Municipal Health Commission
- 22140900600/Shanghai Municipal Health Commission
- 2022LJ005/Shanghai Municipal Health Commission
- Science Foundation of Zhongshan Hospital
- 2021ZSCX28/Fudan University
- 2020ZSLC31/Fudan University
- YJXYY202204-YSB07/Jiangsu Provincial Research Hospital
- KYCX23_3423/Postgraduate Research & Practice Innovation Program of Jiangsu Province
LinkOut - more resources
Full Text Sources
Medical
Research Materials
Miscellaneous