. 2024 Aug 2;11(1):839.
doi: 10.1038/s41597-024-03667-5.

The stroke outcome optimization project: Acute ischemic strokes from a comprehensive stroke center

Affiliations

The stroke outcome optimization project: Acute ischemic strokes from a comprehensive stroke center

John Absher et al. Sci Data. .

Abstract

Stroke is a leading cause of disability, and Magnetic Resonance Imaging (MRI) is routinely acquired for acute stroke management. Publicly sharing these datasets can aid in the development of machine learning algorithms, particularly for lesion identification, brain health quantification, and prognosis. These algorithms thrive on large amounts of information, but require diverse datasets to avoid overfitting to specific populations or acquisitions. While there are many large public MRI datasets, few of these include acute stroke. We describe clinical MRI using diffusion-weighted, fluid-attenuated and T1-weighted modalities for 1715 individuals admitted in the upstate of South Carolina, of whom 1461 have acute ischemic stroke. Demographic and impairment data are provided for 1106 of the stroke survivors from this cohort. Our validation demonstrates that machine learning can leverage the imaging data to predict stroke severity as measured by the NIH Stroke Scale/Score (NIHSS). We share not only the raw data, but also the scripts for replicating our findings. These tools can aid in education, and provide a benchmark for validating improved methods.


Conflict of interest statement

The authors declare no competing interests.

Figures

Fig. 1
Fig. 1
Percentage of patients experiencing damage to 32 distinct vascular territories described by the digital arterial territory atlas created by Faria and colleagues. The largest percentage of patients experienced MCA injury, but a significant number also experienced ACA and MLS/LLS injuries. The wide variety of lesion location, as well as the bilateral distribution (see Fig. 3) makes SOOP particularly useful to researchers and clinicians interested in recovery of functions that are primarily lateralized (i.e. language) or considered bilateral (i.e. motor).
Fig. 2
Fig. 2
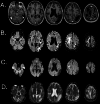
Example data for one individual (participant 342). For each individual we provide a scan with T1-weighting (A), a T2-weighted fluid-attenuated inversion recovery (FLAIR) (B), as well as two images from an echo-planar imaging diffusion sequence. With regards to the diffusion sequences shown, this study chose to use very short DWI sequences referred to Apparent Diffusion Coefficient (ADC) (C) and TRACE (D) scans, as opposed to longer (10–20 minute) DWI sequences used to calculate tractography. These shorter DWI scans allowed for detection of abnormal diffusion using a very short acquisition time, which is apt for clinical settings.
Fig. 3
Fig. 3
Top Panel: Bitmap image generated by our validation scripts for a single participant (#23). This image shows axial, sagittal and coronal slices, as well as a rendered image, in standard MNI space. The lesion, located in the right caudate nucleus, is depicted in red. White matter hyperintensities (periventricular) are visible on the anterior boundary of the left and right ventricles. Users can inspect this bitmap can as part of the quality assurance process. In particular, the unified segmentation and normalization method we use develops a virtuous cycle between the spatial warping and the tissue segmentation that drives the brain extraction. Therefore, an accurate volume rendering (right panel) is consistent with a successful spatial warping to standard space. Middle Panel: Despite the variable differences in quality and resolution of each individual FLAIR scan (renderings for four representative individuals shown on the left side), all are normalized into a standard space, as seen by the rendering of the mean normalized FLAIR scan from all individuals (right side). Bottom Panel: Lesion incidence map (N = 1461) for the SOOP dataset. Hotter colors show regions with higher injury incidence.
Fig. 4
Fig. 4
We created an easy-to-modify script that attempts to predict NIH Stroke Scale (NIHSS) scores based on participant age and lesion load to each brain region described in the vascular territory brain atlas created by Faria and colleagues. Our script deep_learn.py, which is contained in our open-source GitHub repository: https://github.com/neurolabusc/StrokeOutcomeOptimizationProjectDemo), can be run in a Python environment or using Jupyter Notebooks, to predict NIHSS scores using two different algorithms: support vector regression (SVR - red) and neural network (NN - green). This GitHub page contains more detailed instructions on dependencies and how to run this script. Comparison of the performance of these algorithms shows that NN outperforms SVR for this classification task. Other researchers can easily modify this script to run it on subsets of our data (e.g. males vs. females, large vs. small lesions determined by a median split, etc) or compare the performance of other types of machine learning or AI models. *Each circle represents a unique participant. Lesion sizes were converted to z-scores and are represented by the size of each dot. Data points with predicted NIHSS Values > = 30 (N = 2) or < = 0 (N = 8) were excluded from the graph for visualization.

Similar articles

Cited by

References

    1. Writing Group Members. et al. Heart Disease and Stroke Statistics-2016 Update: A Report From the American Heart Association. Circulation133, e38–360 (2016). - PubMed
    1. Weimar, C. et al. Prediction of recurrent stroke and vascular death in patients with transient ischemic attack or nondisabling stroke: a prospective comparison of validated prognostic scores. Stroke41, 487–493 (2010). 10.1161/STROKEAHA.109.562157 - DOI - PubMed
    1. O’Brien, E. C. et al. Quality of Care and Ischemic Stroke Risk After Hospitalization for Transient Ischemic Attack: Findings From Get With The Guidelines-Stroke. Circ. Cardiovasc. Qual. Outcomes8, S117–24 (2015). 10.1161/CIRCOUTCOMES.115.002048 - DOI - PubMed
    1. Smith, E. E. et al. Risk score for in-hospital ischemic stroke mortality derived and validated within the Get With the Guidelines-Stroke Program. Circulation122, 1496–1504 (2010). 10.1161/CIRCULATIONAHA.109.932822 - DOI - PubMed
    1. Menon, B. K. et al. Risk score for intracranial hemorrhage in patients with acute ischemic stroke treated with intravenous tissue-type plasminogen activator. Stroke43, 2293–2299 (2012). 10.1161/STROKEAHA.112.660415 - DOI - PubMed

LinkOut - more resources