. 2024 Aug 3;15(1):6569.
doi: 10.1038/s41467-024-51050-0.

Prion-like domain mediated phase separation of ARID1A promotes oncogenic potential of Ewing's sarcoma

Affiliations

Prion-like domain mediated phase separation of ARID1A promotes oncogenic potential of Ewing's sarcoma

Yong Ryoul Kim et al. Nat Commun. .

Abstract

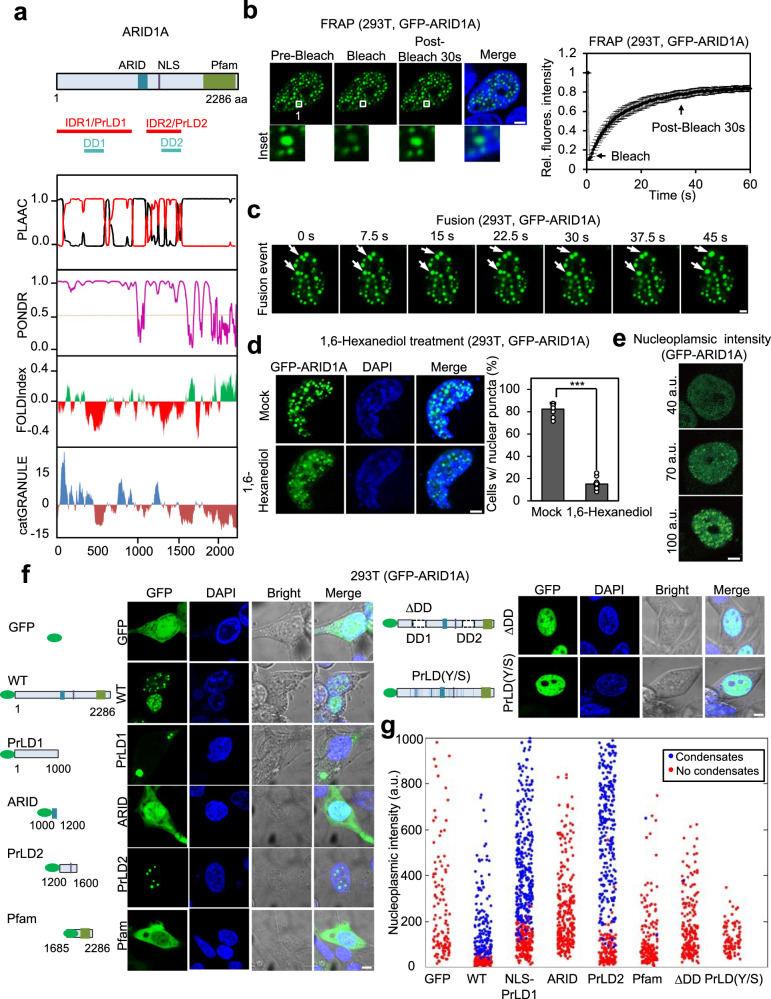
Liquid-liquid phase separation (LLPS) facilitates the formation of membraneless organelles within cells, with implications in various biological processes and disease states. AT-rich interactive domain-containing protein 1A (ARID1A) is a chromatin remodeling factor frequently associated with cancer mutations, yet its functional mechanism remains largely unknown. Here, we find that ARID1A harbors a prion-like domain (PrLD), which facilitates the formation of liquid condensates through PrLD-mediated LLPS. The nuclear condensates formed by ARID1A LLPS are significantly elevated in Ewing's sarcoma patient specimen. Disruption of ARID1A LLPS results in diminished proliferative and invasive abilities in Ewing's sarcoma cells. Through genome-wide chromatin structure and transcription profiling, we identify that the ARID1A condensate localizes to EWS/FLI1 target enhancers and induces long-range chromatin architectural changes by forming functional chromatin remodeling hubs at oncogenic target genes. Collectively, our findings demonstrate that ARID1A promotes oncogenic potential through PrLD-mediated LLPS, offering a potential therapeutic approach for treating Ewing's sarcoma.


Conflict of interest statement

The authors declare no competing interests.

Figures

Fig. 1
Fig. 1. ARID1A undergoes liquid–liquid phase separation through PrLDs.
a Domain structure and intrinsic disorder tendency of ARID1A. The top panel shows the domains of ARID1A, along with PLAAC analysis, PONDR analysis, FOLD analysis, and catGRANULE analysis. b Representative images of the FRAP experiment conducted in GFP-ARID1A transfected 293T cells. The white box highlights the organelle subjected to targeted bleaching. The bottom presents the quantification of FRAP data for GFP-ARID1A puncta. Bleaching occurred at t = 0 s. Initial fluorescence was used as the reference value to calculate relative fluorescence intensity. Data are presented as the means ± SEMs (n = 9), n = individual ARID1A nuclear condensate. Scale bar: 5 μm. c Live-cell imaging of 293T cells expressing GFP-ARID1A. The arrows indicate representative ARID1A puncta that fused over time. Scale bar: 2 μm. The representative images supported by the relevant statistics have been chosen upon three independent preparations with similar outcome. d GFP-ARID1A formed nuclear puncta in 293T cells. Cells transfected with GFP-ARID1A were treated with or without 6% Hex for 5 min and imaged using confocal microscopy. Nuclei were stained with DAPI. The quantification on the right shows the percentage of cells with nuclear puncta. Data are presented as the mean ± SEM. ***p < 0.001. Statistics by two-tailed t-test. Twelve transfected cells from each group (mock and hexanediol treatment) were analyzed; n = 12 biologically independent samples. Scale bar: 5 μm. e Representative confocal images of 293T cells expressing GFP-ARID1A at different fluorescence intensities. Scale bar: 5 μm. The representative images supported by the relevant statistics have been chosen upon three independent preparations with similar outcome. f Representative confocal images of 293T cells transfected with different forms of recombinant GFP-ARID1A constructs, including GFP, GFP-ARID1A, GFP-PrLD1, GFP-ARID, GFP-PrLD2, GFP-Pfam, GFP-ARID1A PrLD(Y/S), and GFP-ΔDD mutant. Scale bar: 5 μm. The representative images supported by the relevant statistics have been chosen upon three independent preparations with similar outcomes. g Quantitative phase diagram depicting the intra-nuclear concentration of ARID1A domains and mutants observed. Each dot represents the ARID1A concentration from a unique cell. Red indicates positive phase separation, while blue indicates negative phase separation. (a.u. = arbitrary unit). Source data are provided as a Source Data file.
Fig. 2
Fig. 2. ARID1A requires both PrLDs and Pfam homology domain to incorporate BAF subunits into condensates.
a Co-immunoprecipitation assay performed to detect the interaction between endogenous BAF complex subunit and ARID1A wild type (WT), ΔDD, or ΔPfam mutant expressed in 293T cells. The representative images supported by the relevant statistics have been chosen upon three independent preparations with similar outcomes. b Representative confocal images showing the cellular localization of different GFP-BAF complex subunits. Scale bar: 5 μm. The representative images supported by the relevant statistics have been chosen upon three independent preparations with similar outcomes. c Representative confocal images demonstrating the colocalization pattern of recombinant ARID1A proteins (green) and SMARCB1 (red). Scale bar: 5 μm. The representative images supported by the relevant statistics have been chosen upon three independent preparations with similar outcomes. d Representative confocal images illustrating the colocalization pattern of recombinant ARID1A proteins (green) and SMARCD1 (red). Scale bar: 5 μm. The representative images supported by the relevant statistics have been chosen upon three independent preparations with similar outcomes. e Schematics of ARID1A Corelet system. f Representative confocal images of the Corelet system using PrLD1-mch-SspB or PrLD1-Pfam-mch-SspB to observe recruitment of BAF complex subunit upon blue light stimulation. Scale bars: 5 μm. The representative images supported by the relevant statistics have been chosen upon three independent preparations with similar outcomes. g Representative confocal images of 293T cells transfected with recombinant ARID1A and immunostained with anti-SMARCD and anti-SMARCC1 antibodies. Scale bars: 5 μm. The representative images supported by the relevant statistics have been chosen upon three independent preparations with similar outcomes. Source data are provided as a Source Data file.
Fig. 3
Fig. 3. Loss of ARID1A LLPS significantly reduces proliferative and invasive property of Ewing’s sarcoma.
a Expression levels of ARID1A protein in different types of cancer obtained from the cancer cell line encyclopedia. b Representative immunoblot image measuring ARID1A protein levels in various cancer cell lines. The quantification represents ARID1A/β-actin protein density ratio. The representative images supported by the relevant statistics have been chosen upon three independent preparations with similar outcomes. c Immunohistochemistry results showing ARID1A staining in normal bone tissue and two Ewing’s sarcoma patient tissues. Scale bars: 10 μm. The representative images supported by the relevant statistics have been chosen upon three independent preparations with similar outcomes. d Immnuocytochemistry image illustrating endogenous ARID1A localization in WT, ARID1A−/−, ARID1A−/− + WT and ARID1A−/− + ΔDD cells. Scale bars: 5 μm. The representative images supported by the relevant statistics have been chosen upon three independent preparations with similar outcomes. e Left: wound healing assay conducted on WT, ARID1A−/−, ARID1A−/− + WT, and ARID1A−/− + ΔDD A673 cell lines. Right: quantification of the wound healing assay. Bars represent the SEM; **p < 0.01, ***p < 0.001, NS non-significant. n = 10 technical replicate of wound closures. Statistical analysis performed using a two-tailed Wilcoxon signed rank test on 48 h samples of ARID1A−/− + WT, and ARID1A−/− + ΔDD A673 cell lines. Scale bar: 500 μm. f Left: spheroid formation assay performed for four cell lines over 4 days. Right: quantification of the spheroid formation assay. Bars represents the mean ± SEM; **p < 0.01, ***p < 0.001, NS non-significant. n = 10 technical replicates of spheroids. Statistical analysis performed using a two-tailed Wilcoxon signed rank test on day 4 samples of ARID1A−/− + WT, and ARID1A−/− + ΔDD A673 cell lines. Scale bar: 500 μm. g Left: spheroid invasion assay conducted on four cell lines over 2 days. Right: quantification of the spheroid invasion assay. Bars represents the mean ± SEM; **p < 0.01, ***p < 0.001, NS non-significant. n = 10 technical replicates of spheroids. Statistical analysis performed using a two-tailed Wilcoxon signed rank test on day 4 samples of ARID1A−/− + WT, and ARID1A−/− + ΔDD A673 cell lines. Scale bar: 500 μm. h Left: in vivo xenograft assay performed using four cell lines. Nude mice and extracted tumors are shown. Top right: quantification of the volume of the extracted tumors. Bottom right: quantification of the weight of the extracted tumors. Bars represents the mean ± SEM; **p < 0.01, ***p < 0.001, NS non-significant. n = 10 tumor extracts. Statistical analysis performed using a two-tailed Wilcoxon signed rank test. ARID1A−/−, ARID1A−/− + WT, and ARID1A−/− + ΔDD A673 cell lines were individually compared to WT. i Representative immunohistochemistry images of extracted tumors formed by the four cell lines. Immunostaining was performed using an anti-ARID1A antibody. Scale bars: 10 μm. The representative images supported by the relevant statistics have been chosen upon three independent preparations with similar outcomes. Source data are provided as a Source Data file.
Fig. 4
Fig. 4. ARID1A LLPS-dependent altered transcriptome and epigenome.
a A heatmap illustrating expression of DEGs (FDR < 0.05) obtained from the RNA-seq results of WT, ARID1A−/−, five ARID1A−/− + WT, five ARID1A−/− + ΔDD, and ARID1A−/− + PrLD(Y/S) A673 cell lines. The colors indicate normalized gene expression. The dendrogram above the heatmap indicates the hierarchical clustering result of the samples. b Tornado plots illustrating ±800 bp regions from each dysregulated cREs (FDR < 0.05) obtained from ATAC-seq of WT, ARID1A−/−, five ARID1A−/− + WT, five ARID1A/ + ΔDD, and ARID1A−/− + PrLD(Y/S) A673 cell lines. The colors indicate normalized read counts (left, red) and log2 (LLPS-positive/LLPS-negative) read counts (right, yellow, and cyan). c Top 10 enriched gene ontologies in ARID1A LLPS-dependent upregulated DEGs. The cancer-related terms are marked with an asterisk. d The rank of transcription factor motifs overrepresented in the ARID1A LLPS-dependent upregulated cREs. The top two enriched motifs are highlighted. e Tornado plots illustrating published A673 EWS/FLI1 ChIP-seq signal on the ARID1A LLPS-dependent upregulated cREs, ARID1A LLPS-dependent downregulated cREs, and other randomly selected cREs, respectively. The colors indicate normalized EWS/FLI1 ChIP-seq signal over the input signal.
Fig. 5
Fig. 5. ARID1A LLPS links EWS/FLI1-associated cREs and oncogene activation.
a A heatmap showing significantly (P value < 0.05) altered long-range chromatin contacts between the DEGs and the dysregulated cREs in an ARID1A LLPS-dependent manner. b A barplot illustrating the number of linkages between upregulated DEGs and upregulated, downregulated, and control cREs, respectively. c Left: a tornado plot illustrating published A673 EWS/FLI1 ChIP-seq signal on the upregulated cREs connecting to ARID1A LLPS-dependent upregulated genes. The colors indicate normalized EWS/FLI1 ChIP-seq signal over the input signal. Middle and right: a heatmap illustrating the upregulated cREs (middle) and the upregulated genes connected to the upregulated cREs (right). The colors indicate normalized read count in the regions and normalized gene expression, respectively. The dashed line indicates linkages between EWS/FLI1-bound upregulated cREs and the upregulated genes. d The normalized Hi-C contact frequencies around the TFAP2B gene promoter are illustrated as a virtual 4C plot. The genome tracks of ATAC-seq and published EWS/FLI1 ChIP-seq signal are shown below. The dashed vertical line indicates the viewpoint of the 4C plot and the asterisk indicates the transcription start site of the TFAP2B gene. The shaded regions highlight the linkages between the TFAP2B gene and the EWS/FLI1-bound upregulated cREs via the proximal colocalization or the altered long-range chromatin contacts. e Odds ratio that an activated gene is included in the cancer-related GO terms shown in Fig. 4c, comparing the genes linked to the upregulated cREs versus unlinked genes (P values for the enrichment of the linked genes versus the unlinked genes: migration = 0.034, cell adhesion = 0.038, two-sided Fisher’s exact test). f A heatmap comparing normalized Hi-C contact frequencies of ARID1A LLPS-positive, negative, and published EWS/FLI1 knockdown (KD) A673 cells, respectively. Only the contacts between EWS/FLI1-bound upregulated cREs and their linked upregulated genes are shown.
Fig. 6
Fig. 6. ARID1A directly interacts with EWS/FLI1 through phase separation.
a Binding site mapping of FLAG-EWS/FLI1 and GFP-ARID1A recombinant proteins by co-immunoprecipitation assay. Tested proteins include PrLD1, ARID, PrLD2, Pfam, PrLD(Y/S) mutant, and full-length ARID1A. The representative images supported by the relevant statistics have been chosen upon three independent preparations with similar outcomes. b Confocal image of an in vitro co-droplet assay demonstrating colocalization of purified GFP-ARID1A and mCherry-EWS/FLI1. Scale bars: 5 μm. The representative images supported by the relevant statistics have been chosen upon three independent preparations with similar outcomes. c Representative confocal images of ARID1A−/− + WT and ARID1A−/− + ΔDD A673 cell lines immunostained with anti-FLI1 and anti-ARID1A antibodies. Scale bars: 5 μm. d Quantification of number of FLI1 puncta per cell lines in (c). n = 32 technical replicates of cells; bars represents mean ± SEM; **p < 0.01, ***p < 0.001, NS non-significant. Statistical analysis performed using a two-tailed t-test. ARID1A−/−, ARID1A−/− + WT, and ARID1A−/− + ΔDD A673 cell lines were individually compared to WT. e ChIP assays performed on EWS/FLI1-bound enhancers in ARID1A−/− + WT and ARID1A−/− + ΔDD A673 cell lines using antibodies against IgG, FLI1, H3K27ac, and SMARCC1. Bars represents mean ± SEM; n = 3 technical replicates; **p < 0.01, ***p < 0.001, NS non-significant. Statistics by two-tailed t-test using ARID1A−/− + WT, and ARID1A−/− + ΔDD A673 cell lines as comparison. Source data are provided as a Source Data file.
Fig. 7
Fig. 7. Schematic representation of ARID1A phase separation.
ARID1A undergoes phase separation at EWS/FLI1-bound enhancers and forms condensates, which compartmentalize BAF complex subunits, leading to chromatin remodeling and transcriptional activation of oncogenes. Loss of ARID1A phase separation results in chromatin closure and reduced transcription of oncogenic target genes, leading to a significant decrease in the oncogenic potential of Ewing’s sarcoma. This figure was created with BioRender.com released under a Creative Commons Attribution-NonCommercial-NoDerivs 4.0 International License.

References

    1. Bhowmik, D. et al. Cooperative DNA binding mediated by KicGAS/ORF52 oligomerization allows inhibition of DNA-induced phase separation and activation of cGAS. Nucleic Acids Res.49, 9389–9403 (2021). 10.1093/nar/gkab689 - DOI - PMC - PubMed
    1. Martin, E. W. et al. Valence and patterning of aromatic residues determine the phase behavior of prion-like domains. Science367, 694–699 (2020). 10.1126/science.aaw8653 - DOI - PMC - PubMed
    1. Choi, J.-M., Holehouse, A. S. & Pappu, R. V. Physical principles underlying the complex biology of intracellular phase transitions. Annu. Rev. Biophys.49, 107–133 (2020). 10.1146/annurev-biophys-121219-081629 - DOI - PMC - PubMed
    1. Jung, J.-H. et al. A prion-like domain in ELF3 functions as a thermosensor in Arabidopsis. Nature585, 256–260 (2020). 10.1038/s41586-020-2644-7 - DOI - PubMed
    1. Wang, Y. et al. A prion-like domain in transcription factor EBF1 promotes phase separation and enables B cell programming of progenitor chromatin. Immunity53, 1151–1167 (2020). 10.1016/j.immuni.2020.10.009 - DOI - PubMed

MeSH terms