. 2024 Aug 2;15(1):6534.
doi: 10.1038/s41467-024-50877-x.

Huntington's disease cellular phenotypes are rescued non-cell autonomously by healthy cells in mosaic telencephalic organoids

Affiliations

Huntington's disease cellular phenotypes are rescued non-cell autonomously by healthy cells in mosaic telencephalic organoids

Maura Galimberti et al. Nat Commun. .

Erratum in

Abstract

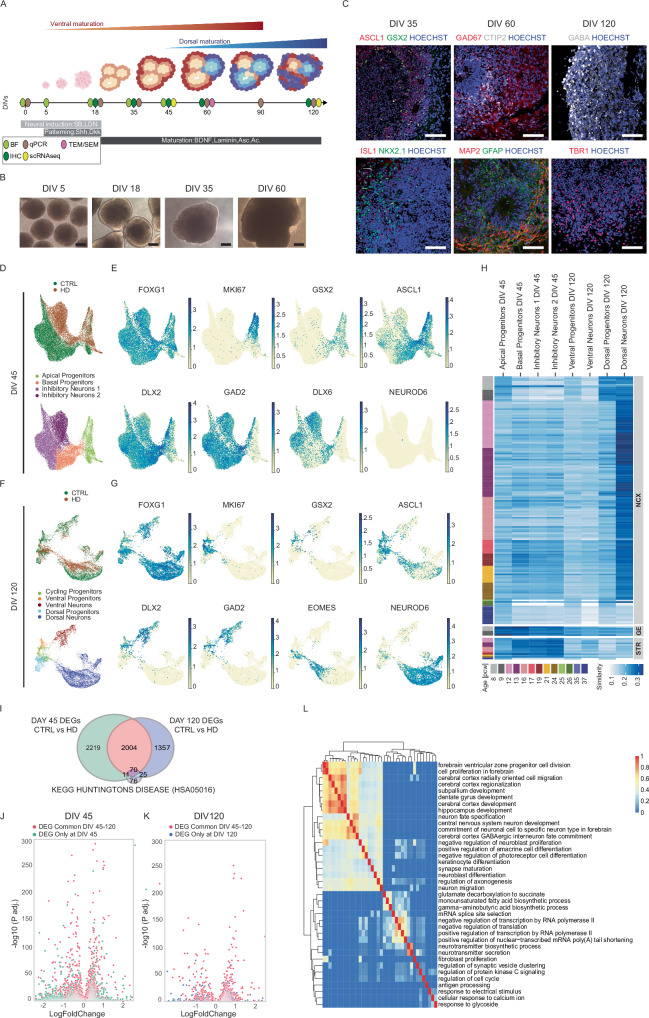
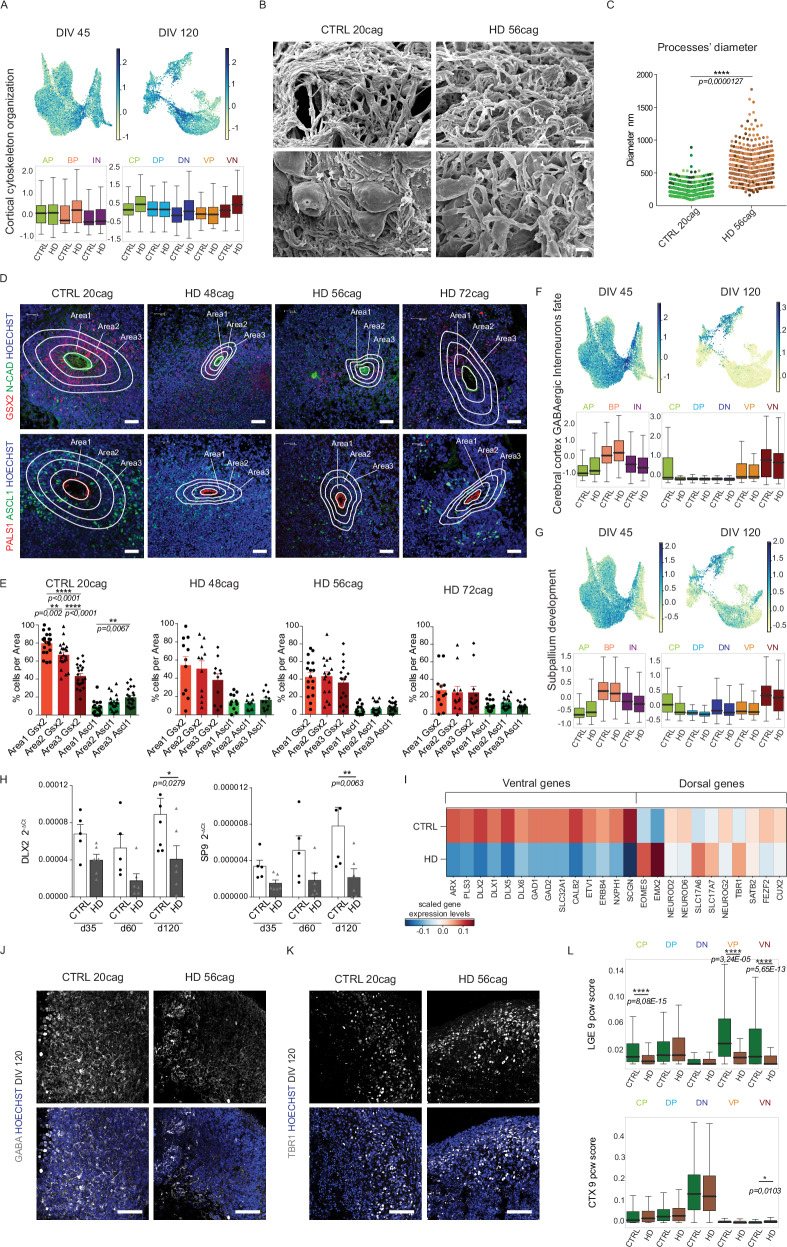
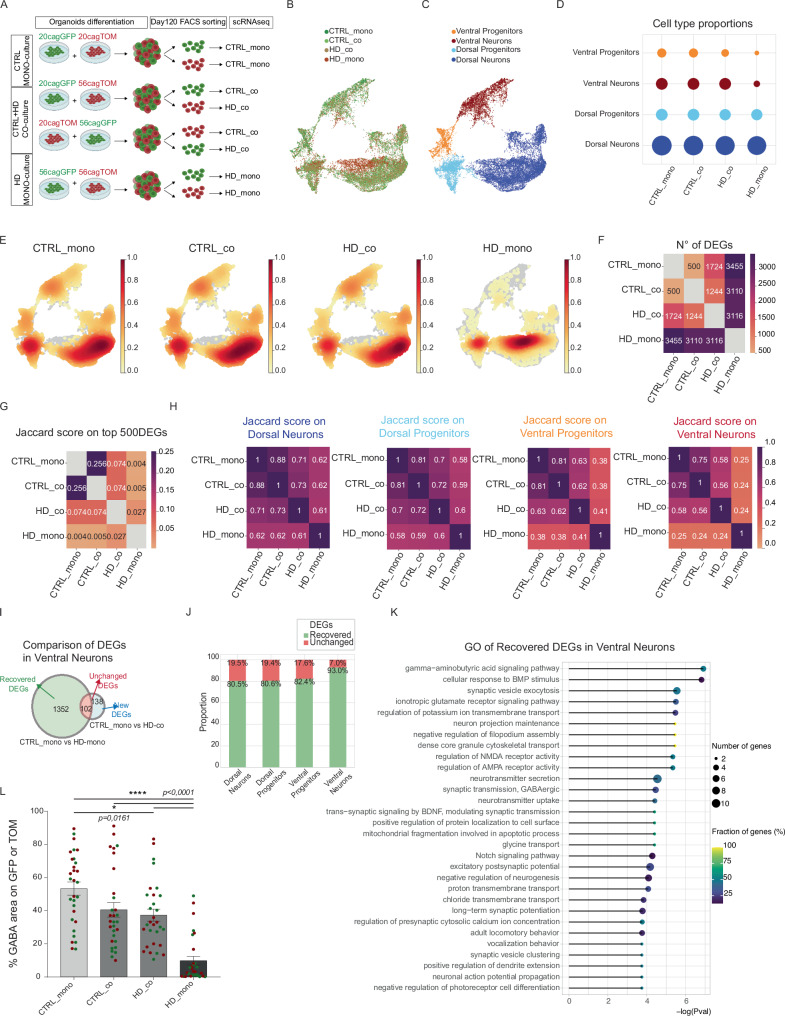
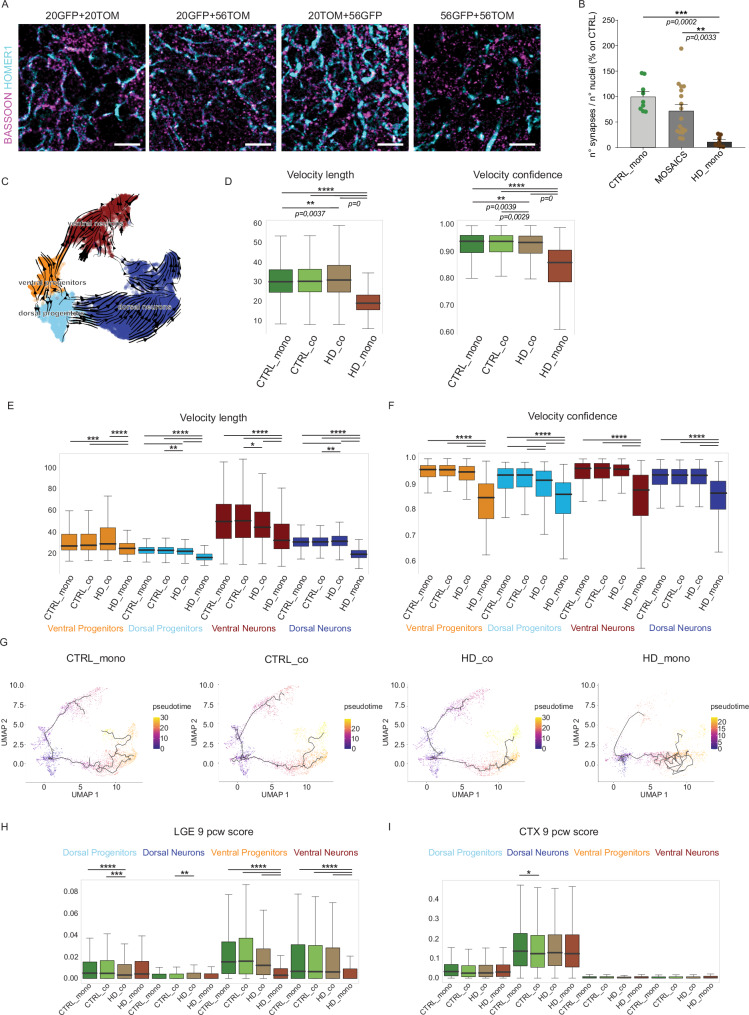
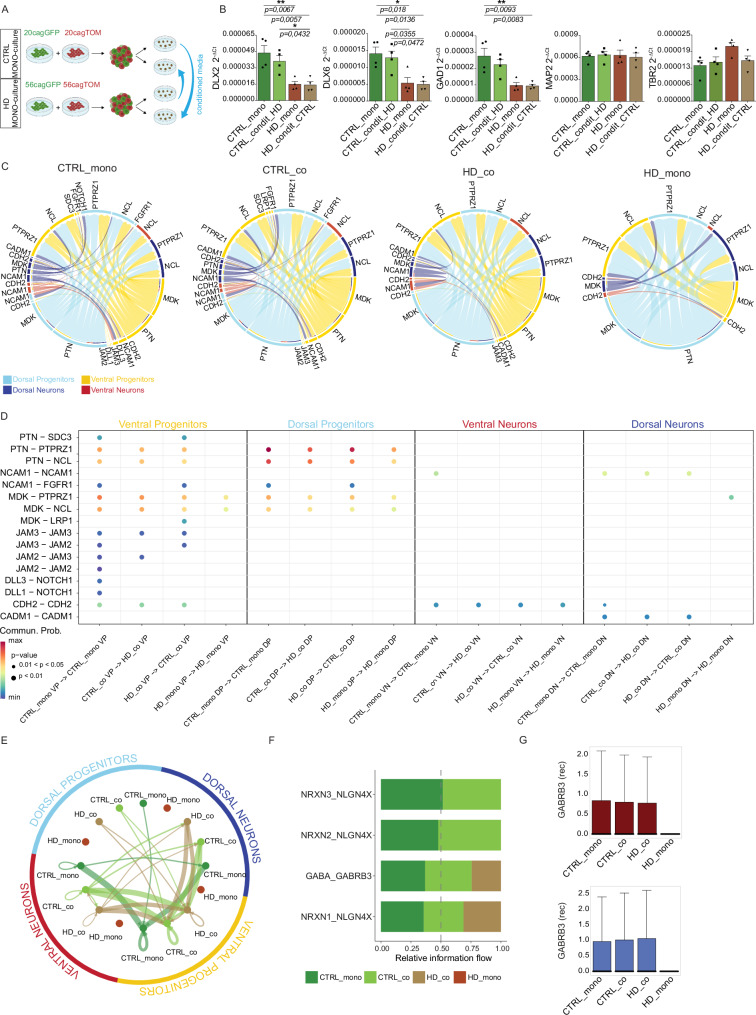
Huntington's disease (HD) causes selective degeneration of striatal and cortical neurons, resulting in cell mosaicism of coexisting still functional and dysfunctional cells. The impact of non-cell autonomous mechanisms between these cellular states is poorly understood. Here we generated telencephalic organoids with healthy or HD cells, grown separately or as mosaics of the two genotypes. Single-cell RNA sequencing revealed neurodevelopmental abnormalities in the ventral fate acquisition of HD organoids, confirmed by cytoarchitectural and transcriptional defects leading to fewer GABAergic neurons, while dorsal populations showed milder phenotypes mainly in maturation trajectory. Healthy cells in mosaic organoids restored HD cell identity, trajectories, synaptic density, and communication pathways upon cell-cell contact, while showing no significant alterations when grown with HD cells. These findings highlight cell-type-specific alterations in HD and beneficial non-cell autonomous effects of healthy cells, emphasizing the therapeutic potential of modulating cell-cell communication in disease progression and treatment.


Conflict of interest statement

The authors declare no competing interests.

Figures

Fig. 1
Fig. 1. Telencephalic organoids present ventral and dorsal identities with impaired neuronal transcriptional signatures in HD.
A Scheme of the protocol for telencephalic organoids. Created with BioRender.com. released under a Creative Commons Attribution-NonCommercial-NoDerivs 4.0 International license. Abbreviations: BF=brightfield, IHC=immunohistochemistry, qPCR=quantitative PCR, scRNAseq=single cell RNA sequencing, TEM/SEM=transmission and scanning electron microscopy. B Brightfield images during differentiation. Scale bars = 250 µm C Immunohistochemistry analyses of telencephalic organoids during differentiation. At DIV 35 for ASCL1, GSX2, ISLT1 and NKX2.1; at DIV 60 for GAD67, CTIP2, GFAP, MAP2; at DIV 120 for GABA and TBR1. Scale bars = 100 µm D UMAP plots of scRNAseq analyses on CTRL (20CAG) and HD (56CAG) organoids at DIV 45 showing genotypes and clusters of subpopulations E UMAP plots for specific markers of telencephalic development (FOXG1) with progenitors (MKI67) and ventral identity (GSX2, ASCL1, DLX2, GAD2, DLX6) or dorsal identity (NEUROD6) F UMAP plots of scRNAseq analyses on CTRL (20CAG) and HD (56CAG) organoids at DIV 120 showing the genotypes and clusters of subpopulations G UMAP plots for specific markers of telencephalic development (FOXG1) with progenitors (MKI67) and ventral identity (GSX2, ASCL1, DLX2, GAD2) or dorsal identity (EOMES, NEUROD6) H Voxhunt heatmap of similarity between individual subpopulations of our organoids and human fetal brain by mapping onto BrainSpan human transcriptomic dataset I Venn diagram of DEGs between CTRLs and HD organoids showing which are in common between DIV 45, DIV 120, and KEGG pathway associated to HD (Wilcoxon test, two-sided, p < 0.05) J, K Volcano plot of p-value adjusted (p.adj.) for DEGs at DIV 45 or DIV 120, Wilcoxon test two-sided L Heatmap showing the results of gene ontology analysis of the common DEGs where the enriched GO terms are grouped according to their semantic similarity. (Biological Replicates for scRNAseq: At DIV 45 N=3 individual organoids per genotype and at DIV 120 N=a pool of 10 organoids from 2 cell lines per genotype. See fig. S1).
Fig. 2
Fig. 2. Self-organization and ventral maturation are altered in HD organoids.
A UMAP and boxplot of score of DEGs of term “cortical cytoskeleton organization” upregulated in HD organoids at both time points. Abbreviations: AP=Apical Progenitors; BP=Basal Progenitors; IN=Inhibitory Neurons; CP=Cycling Progenitors; DP=Dorsal Progenitors; DN=Dorsal Neurons; VP=Ventral Progenitors; VN=Ventral Neurons B Scanning electron microscopy (SEM) images of CTRL and HD organoids at DIV 60. Scale bars = 5 µm C Diameter of neuronal processes (Dots shown are all the multiple processes measured in N = 6 organoids of independent biological replicates, but statistics is performed on the mean of processes per organoid. Dots coloured based on the 6 replicates). Unpaired two-tailed t-test, ****p<0,0001) D Immunohistochemistry analyses of CTRL (parental and 20CAG) and HD (48, 56 and 72 CAG) organoids at DIV 45-60 for GSX2, ASCL1, N-CADHERIN and PALS1. Scale bar 30 µm E Numbers of GSX2+ or ASCL1+ cells in each area (Manual counting. Anova One Way, Bonferroni post test, **p < 0,01, ****p < 0,0001. N ≥ 11 VZ-like structures, derived from 10 organoids of 2/3 biological replicates) F, G UMAP and boxplot of score of DEGs of terms “cerebral cortex GABAergic interneurons” and “subpallium development” downregulated in HD organoids H q-PCR for DLX2 and SP9 on CTRL and HD organoids at DIV 35, 60, and 120. (N = 5 independent biological replicates where each one is a pool of 4 organoids; error bars represent ± SEM; Anova One Way, Bonferroni post test, *p < 0,05; **p < 0,01) I Heatmap of gene expression of key dorso-ventral telencephalic markers in CTRL and HD organoids at DIV 120 J, K Immunohistochemistry analyses of CTRL and HD organoids at DIV 120 for GABA and TBR1. Scale bar 100 μm L Boxplots of the signature score of each subpopulation of organoids at DIV 120 and the bulk RNAseq from human fetal brain LGE and CTX (cortex) at 9pcw (Wilcoxon test, two-sided, Bonferroni post test, ****p<0,0001). For A, F, G, and L the box plots show the median (centre line), upper and lower quartiles (box limits), and the highest and lowest values within 1.5× the IQR of the nearest hinge (whiskers). Source data are provided as a Source Data file.
Fig. 3
Fig. 3. Mosaic organoids reveal non-cell autonomous recovery of HD ventral identities.
A Experimental scheme for the CTRL-HD mosaic organoids. Created with BioRender.com released under a Creative Commons Attribution-NonCommercial-NoDerivs 4.0 International license B, C UMAP plots of scRNAseq analyses on mosaic organoids at DIV 120 for culture conditions (CTRL-mono, CTRL_co, HD_co, and HD_mono) and clusters of subpopulations identified with the Louvain algorithm (Ventral Progenitors, Ventral Neurons, Dorsal Progenitors, Dorsal Neurons) D Bubble plot of cell type proportions per condition E Cell density plots showing how the cells are concentrated in each condition. F Heatmap of number of DEGs (Wilcoxon test, two-sided, p < 0.05) between samples in a pairwise comparison G Heatmap of Jaccard similarity score, based on the proportion of the top 500 DEGS (defined by Wilcoxon rank-sum test) specifically identifying each condition (CTRL_mono, CTRL_co, HD_co, HD_mono) that are in common between two distinct conditions H Heatmap of Jaccard similarity score divided per subpopulations (Dorsal Neurons, Dorsal Progenitors, Ventral Progenitors, Ventral Neurons). I Venn diagram of DEGs in Ventral neurons revealing recovered genes by comparing the list of DEGs between CTRL organoids (CTRL_mono) and HD organoids (HD_mono) with a second list of DEGs between CTRL_mono and HD_co: the genes missing in this second list are the Recovered ones (in green), while genes included in both lists are the Unchanged one (in red) and genes that compare in the co-culture condition are new DEGs (in light blue) J Proportion between Recovered DEGs (in green) and Unchanged DEGs (in red) in each subpopulation K Top 30 GO terms associated to the recovered DEGs in ventral neurons, resulting from GO analysis performed with R package topGO (Fisher test, one-sided). L Automatic quantification of the area positive for GABA over GFP or TOM area (N=8 organoids from 2 independent biological replicates. error bars represent ± SEM. Anova One Way, Bonferroni post test. ****p < 0.0001, *p < 0.05). Source data are provided as a Source Data file.
Fig. 4
Fig. 4. HD cells recover maturation and fate determination when grown with CTRL cells.
A Immunohistochemistry analyses of CTRL_mono (20GFP+20TOM) co-culture mosaic organoids (20GFP+56TOM and 20TOM+56GFP) and HD_mono (56GFP+56TOM) organoids at DIV 120 of differentiation for BASSOON and HOMER1. Scale bar 20 µm B Automatic quantification of numbers of synapses as BASSOON/HOMER1 co-localizing puncta in each condition. As it was not possible to quantify single GFP or TOM cells overlapping with the puncta staining, the quantification reports the total number of synapses in the co-culture mosaic condition (N = 8 organoids from 2 independent biological replicates. Data are normalized over the mean of CTRL values, error bars represent ± SEM. Anova One Way, Bonferroni post test. ***p < 0.001, **p < 0.01). C Differentiation trajectories of all mosaic organoids together, inferred with the method of RNA velocity D Length and confidence of the velocity vectors in each culture sample (Wilcoxon test, two-sided, Bonferroni post test, **p < 0,01; ****p < 0,0001) E, F Length and confidence of the velocity vectors in each individual subpopulation (Wilcoxon test, two-sided, Bonferroni post test, *p < 0,05; **p < 0,01; ***p < 0,001; ****p < 0,0001) G Pseudotime analysis in each culture sample performed using Monocle3 H, I Boxplots for the signature score (as described in methods) of comparison between our mosaic organoids over the bulk RNAseq from human fetal LGE and CTX (cortex) at 9pcw, focusing on individual subpopulation of each sample (Wilcoxon test, two-sided, Bonferroni post test, *p < 0,05; **p < 0,01; ***p < 0,001; ****p < 0,0001). For D, E, F, H, and I the box plots show the median (centre line), upper and lower quartiles (box limits), and the highest and lowest values within 1.5× the IQR of the nearest hinge (whiskers). For E, F and H, I exact p-values can be found in Supplementary Table 2 inside the Supplementary Information. Source data are provided as a Source Data file.
Fig. 5
Fig. 5. Cell-cell communications show cell type specific changes in mosaic organoids.
A Experimental scheme for conditioned medium organoids with CTRL receiving media from HD and vice-versa. Created with BioRender.com released under a Creative Commons Attribution-NonCommercial-NoDerivs 4.0 International license B q-PCR for DLX2, DLX6, GAD1, MAP2, and TBR2 on CTRL and HD canonical (mono) and organoids conditioned from HD (condit HD) or from CTRL (condit CTRL) at DIV 120. (N  = 4 pools of organoids from 2 independent biological replicates; error bars represent ± SEM; Anova One Way, Bonferroni post test, *p < 0,05; **p < 0,01) C CellChat circle plot communications between all subpopulations in each individual condition D CellChat bubble plot of gene expression for couples of ligands and receptors between cells grown together in the same organoid per each subpopulation. Abbreviations: VP=Ventral Progenitors; DP=Dorsal Progenitors; VN=Ventral Neurons; DN=Dorsal Neurons. Wilcoxon test, two-sided, Bonferroni adjustments for multiple comparisons E NeuronChat circle plot showing total communications between all subpopulations and conditions F NeuronChat stacked bar plot of gene expression for couples of ligands and receptors in each condition G Box plots of gene expression for GABRB3 receptor in ventral neurons and dorsal neurons for each condition. For G the box plots show the median (centre line), upper and lower quartiles (box limits), and the highest and lowest values within 1.5× the IQR of the nearest hinge (whiskers). Source data are provided as a Source Data file.

References

    1. Nopoulos, P. C. et al. Smaller intracranial volume in prodromal Huntington’s disease: evidence for abnormal neurodevelopment. Brain134, 137–142 (2011). - PMC - PubMed
    1. Lee, J. K. et al. Measures of growth in children at risk for Huntington disease. Neurology79, 668–674 (2012). - PMC - PubMed
    1. Molero, A. E. et al. Selective expression of mutant huntingtin during development recapitulates characteristic features of Huntington’s disease. Proc. Natl. Acad. Sci.113, 5736–5741 (2016). - PMC - PubMed
    1. Barnat, M. et al. Huntington’s Disease Alters Human Neurodevelopment. Science369, 787–793 (2020). - PMC - PubMed
    1. Hickman, R. A. et al. Developmental malformations in Huntington disease: neuropathologic evidence of focal neuronal migration defects in a subset of adult brains. Acta Neuropathol.141, 399–413 (2021). - PMC - PubMed