. 2024 Aug 2;15(1):6555.
doi: 10.1038/s41467-024-50886-w.

The 4.2 ka event is not remarkable in the context of Holocene climate variability

Affiliations

The 4.2 ka event is not remarkable in the context of Holocene climate variability

Nicholas P McKay et al. Nat Commun. .

Abstract

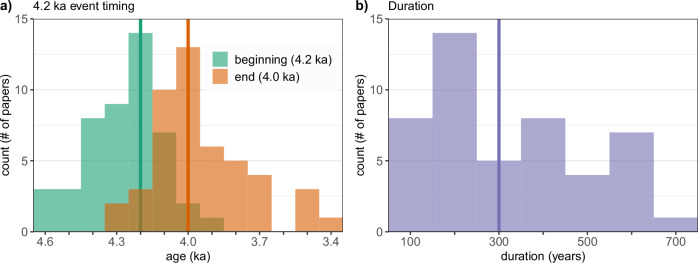
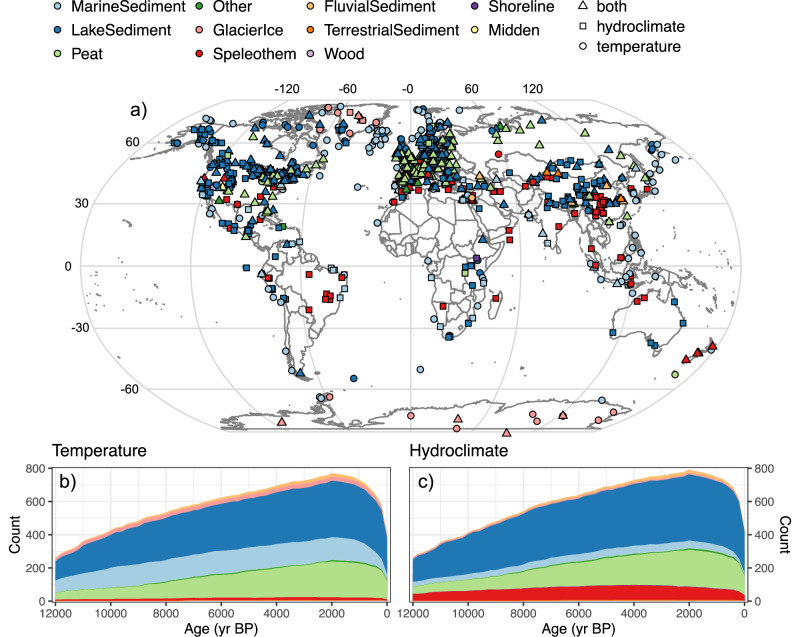
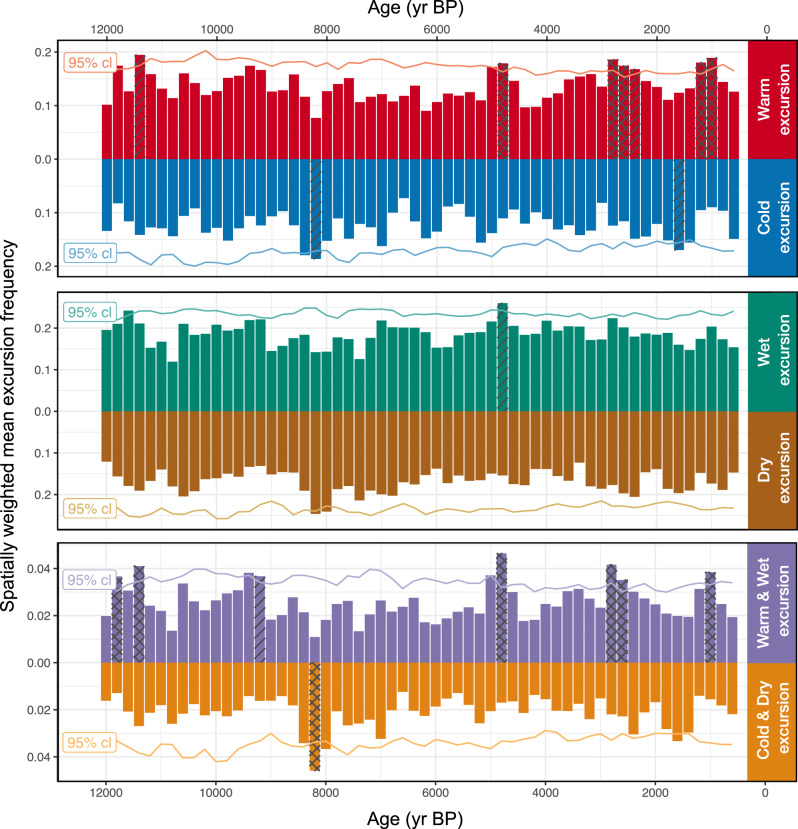
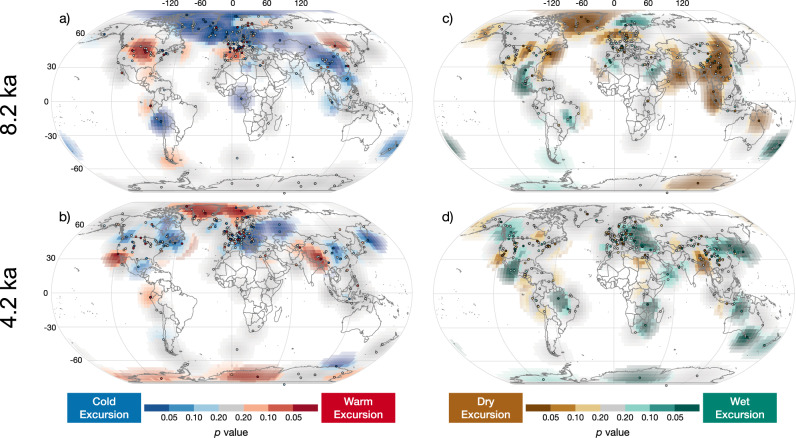
The "4.2 ka event" is a commonly described abrupt climate excursion that occurred about 4200 years ago. However, the extent to which this event is coherent across regional and larger scales is unclear. To objectively assess climate excursions in the Holocene we compile 1142 paleoclimate datasets that span all continents and oceans and include a wide variety of archive and proxy types. We analyze these data to determine the timing, significance and spatial imprint of climate excursions using an objective method that quantifies local, regional and global significance. Site-level excursions in temperature and hydroclimate are common throughout the Holocene, but significant global-scale excursions are rare. The most prominent excursion occurred 8200 years ago, when cold and dry conditions formed a large, significant excursion centered in the North Atlantic. We find additional significant excursions between 1600 and 1000 years ago, which agree with tree-ring data and annual-scale paleoclimate reconstructions, adding confidence and context to our findings. In contrast, although some datasets show significant climate excursions 4200 years ago, they do not occur in large, coherent spatial regions. Consequently, like most other periods in the Holocene, the "4.2 ka event" is not a globally significant climate excursion.


Conflict of interest statement

The authors declare no competing interests.

Figures

Fig. 1
Fig. 1. The timing and duration of the 4.2 ka event in our literature review.
Timing and duration of 47 records with clear climate excursions from our literature review (Table S1). a Age of the beginning (green) and end (tan) of the event, with overlap between the two histograms shown as dark brown, and (b) duration of the event. Median values shown as bold vertical lines.
Fig. 2
Fig. 2. Spatial and temporal coverage of analyzed paleoclimate data.
Location (a) and temporal availability of Holocene proxy records of (b) temperature and (c) hydroclimate analyzed in this study. In all panels colors correspond to archive type. Site details and references to original studies are listed in Supplementary Dataset S1.
Fig. 3
Fig. 3. Area-weighted average of site-level climate excursion frequency through the Holocene.
At each site, parametric uncertainty is considered, and the fraction of detected excursions for both directions in (a) temperature, and (b) hydroclimate range from 0 to 1. The occurrence and significance of (c) combined warm/wet and cold/dry excursions is shown as the product of wet/warm and cold/dry excursion frequency. Each bar shows the area- and uncertainty-weighted proportion of records with excursions in 400 ± 100 year windows. The axes for cold, dry, and cold/dry excursions are inverted. The excursion detection analysis is repeated in 200-year intervals across the Holocene. Colored lines show the 95% confidence interval (cl) based on null hypothesis testing. Due to test multiplicity however, we expect some apparently significant results to occur due to chance alone. Cross-hatched and single-hatched bars indicate intervals that remain significant at the 0.05 and 0.10 levels, respectively, after using a modified Holm–Bonferroni correction. See text for details.
Fig. 4
Fig. 4. Spatial expression of the 8.2 ka and 4.2 ka climate excursions.
Temperature (a, b) and moisture (c, d) excursions are shown for excursions centered at 8.2 ka (a, c) and 4.2 ka (b, d). The grid shading indicates the significance of regional net excursions. Darker red indicates more significant net temperature excursions (i.e., the number of warm excursions in a region significantly exceeds the number of cold excursions). Blue colors indicate regions where cold excursions significantly exceed the number of warm excursions. Green (wet) and brown (dry) colors express regional net excursions for hydroclimate. Transparency of grid shading increases with distance from the nearest site. Colored dots show the location of records with significant excursions at the 0.05 level, colored similarly to grid shading. White circles indicate no significant excursions at a site for the specified time period.

References

    1. Laepple, T. et al. Regional but not global temperature variability underestimated by climate models at supradecadal timescales. Nat. Geosci.16, 958–966 (2023).10.1038/s41561-023-01299-9 - DOI
    1. Alley, R. B. et al. Abrupt Climate Change. Science299, 2005–2010 (2003). - PubMed
    1. Williams, J. W., Blois, J. L. & Shuman, B. N. Extrinsic and intrinsic forcing of abrupt ecological change: case studies from the late Quaternary. J. Ecol.99, 664–677 (2011).10.1111/j.1365-2745.2011.01810.x - DOI
    1. National Research Council. Abrupt Impacts of Climate Change: Anticipating Surprises. (National Academies Press, 2013).
    1. Dansgaard, W., Oeschger, H. & Langway, C. C. Ice core indications of abrupt climatic changes. in Palaeoclimatic Research and Models (ed. Ghazi, A.) 72–73 (Springer Netherlands, Dordrecht, 1983). 10.1007/978-94-009-7236-0_9.

LinkOut - more resources