. 2024 Aug 2;14(1):17942.
doi: 10.1038/s41598-024-67976-w.

CREB-regulated transcription during glycogen synthesis in astrocytes

Affiliations

CREB-regulated transcription during glycogen synthesis in astrocytes

Wei Lee Lim et al. Sci Rep. .

Abstract

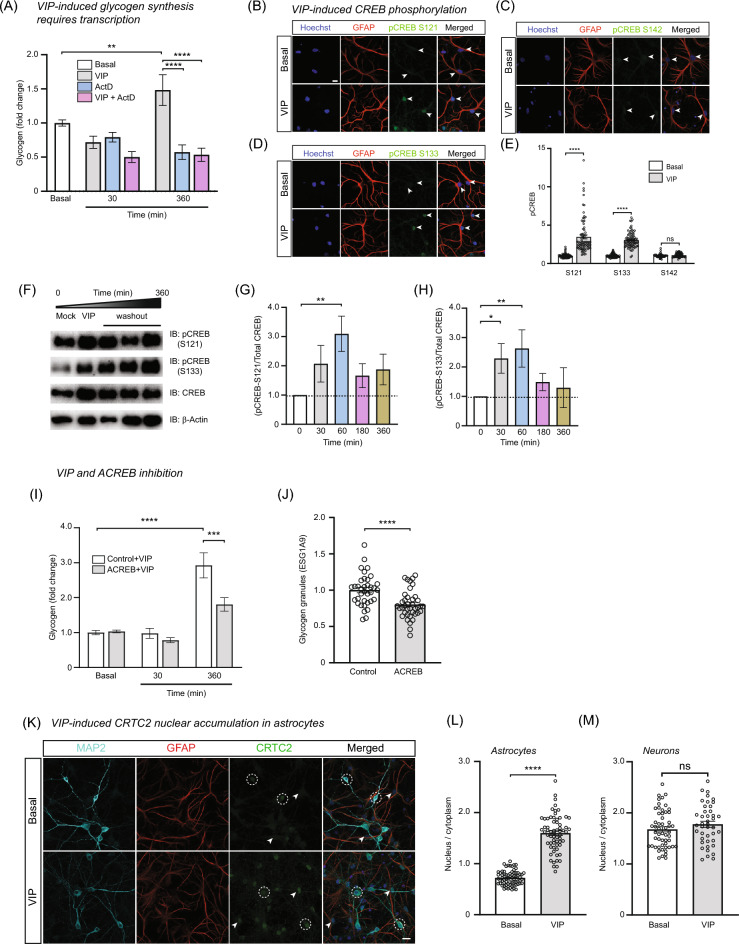
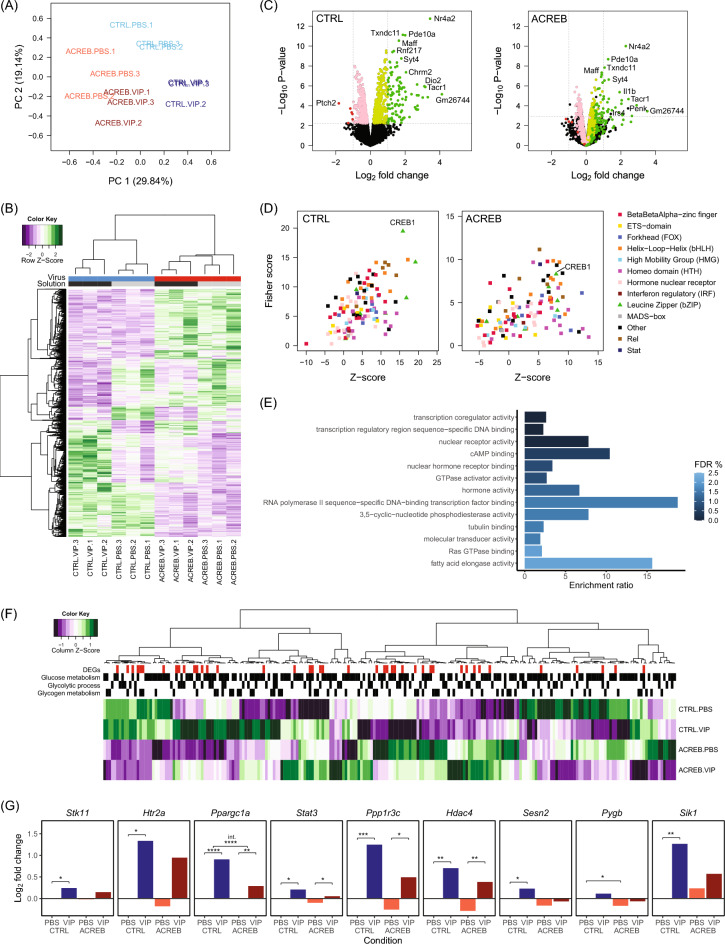
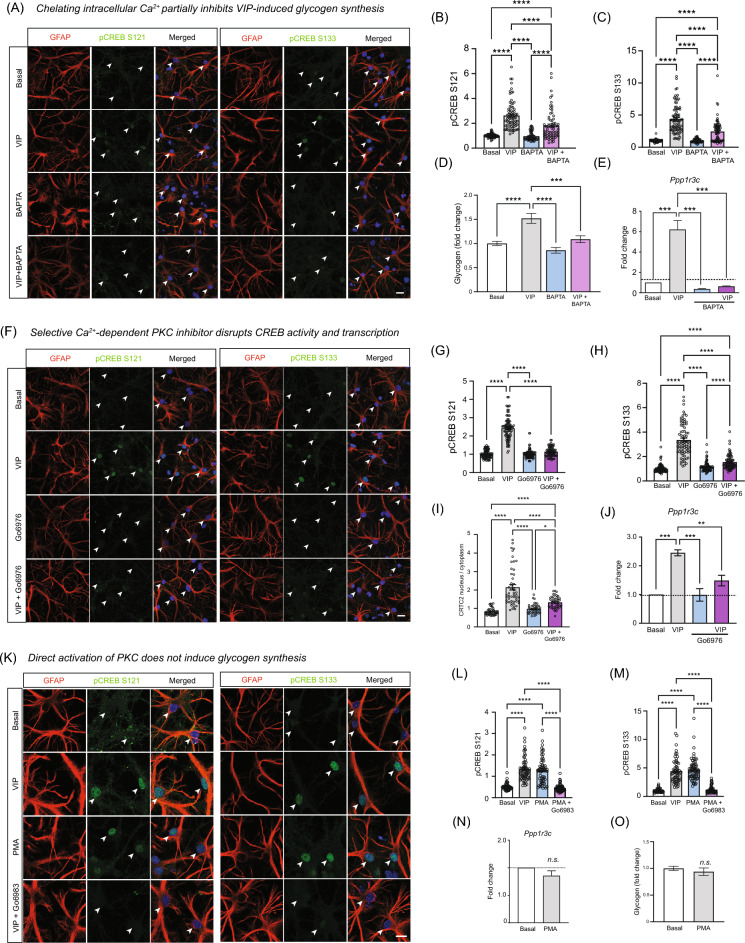
Glycogen storage, conversion and utilization in astrocytes play an important role in brain energy metabolism. The conversion of glycogen to lactate through glycolysis occurs through the coordinated activities of various enzymes and inhibition of this process can impair different brain processes including formation of long-lasting memories. To replenish depleted glycogen stores, astrocytes undergo glycogen synthesis, a cellular process that has been shown to require transcription and translation during specific stimulation paradigms. However, the detail nuclear signaling mechanisms and transcriptional regulation during glycogen synthesis in astrocytes remains to be explored. In this report, we study the molecular mechanisms of vasoactive intestinal peptide (VIP)-induced glycogen synthesis in astrocytes. VIP is a potent neuropeptide that triggers glycogenolysis followed by glycogen synthesis in astrocytes. We show evidence that VIP-induced glycogen synthesis requires CREB-mediated transcription that is calcium dependent and requires conventional Protein Kinase C but not Protein Kinase A. In parallel to CREB activation, we demonstrate that VIP also triggers nuclear accumulation of the CREB coactivator CRTC2 in astrocytic nuclei. Transcriptome profiles of VIP-induced astrocytes identified robust CREB transcription, including a subset of genes linked to glucose and glycogen metabolism. Finally, we demonstrate that VIP-induced glycogen synthesis shares similar as well as distinct molecular signatures with glucose-induced glycogen synthesis, including the requirement of CREB-mediated transcription. Overall, our data demonstrates the importance of CREB-mediated transcription in astrocytes during stimulus-driven glycogenesis.

Keywords: Astrocyte; CREB; Glycogen synthesis; Transcription; Vasoactive intestinal peptide.


Conflict of interest statement

The authors declare no competing interests.

Figures

Figure 1
Figure 1
VIP-induced glycogen synthesis requires CREB-dependent transcription. (A) Glycogen assay for cortical astrocytes stimulated with VIP in the absence or presence of ActD (1 µM; 30 min). Bar graph shows change in glycogen concentration relative to basal at 30 and 360 min across all replicates. Statistical tests: 2-way ANOVA with Tukey’s post-hoc test. (BD) Cocultures were stimulated with VIP and immunolabeled with antibodies against pCREB (S121, S133 and S142; green), GFAP (red) and Hoechst dye (blue). Arrowheads indicate GFAP-positive astrocytic nuclei. Scale bar, 10 µm. (E) Group data show normalized pCREB intensities against average basal values for each independent experiment. Unpaired t-tests were performed for each individual pCREB antibody. (F) A time-course immunoblotting of pCREB (S121 and S133) on cortical astrocyte lysates after VIP stimulation followed by washout and recovery. (G, H). Bar plot show pCREB/total CREB staining normalized against mock treated sample (t = 0) for individual experiment with 1-way ANOVA with Dunnet’s multiple comparison performed on the dataset. (I) Cortical astrocytes transduced with control or ACREB expressing lentiviral vectors and stimulated with VIP and assayed for glycogen post-stimulation. Bar graphs show glycogen concentration relative to basal between control and ACREB samples across all replicates. Statistical tests: 1-way ANOVA with Tukey’s post-hoc. (J) Cortical astrocytes transduced with control or ACREB expressing lentiviral vectors were quantified for endogenous levels of glycogen granules. Bar plots shows intensity of ESG1A9 staining in GFP-positive astrocytes. Statistical test: Unpaired students’ t-test. (K) Cocultures were stimulated with VIP and labeled with antibodies against CRTC2 (green), GFAP (red) and Hoechst dye (blue). White arrowheads and dashed circles indicate astrocyte and neuronal nuclei respectively. (L,M) The nucleus to cytoplasmic ratio of CRTC2 as shown in (K) was quantified for neurons and astrocytes across all conditions and plotted as bar graphs. Statistical test: Unpaired t-test. Unless otherwise stated, for all graphs, only statistical notations relevant to the results are shown in the graphs. Experimental replicates were performed for all datasets to obtain the pooled data and p values notations are as follows (*p  <  0.05; ** p < 0.01; ***p < 0.001; **** p < 0.0001; n.s. not significant). Detailed statistical outputs are listed in the Supplementary Table.
Figure 2
Figure 2
Transcriptome profile of VIP-stimulated astrocytes (A) Principal component analysis (PCA) of samples following normalization & batch effect correction. PC1 corresponds to the effect of virus and accounts for 29.84% of variance between samples; PC2 corresponds to the effect of VIP and accounts for 19.14% of variance. (B) Heatmap and hierarchical clustering of differentially expressed genes (DEGs) identified in an ANOVA-like test for differential expression across all conditions (N  =  2709, false discovery rate (FDR)  <  0.1). Heatmap shows counts per million (CPMs) in each sample, adjusted for unwanted variation and standardized for each gene. Hierarchical clustering of samples shows that the samples cluster by virus, and the control samples further cluster by solution. (C) Volcano plots showing log2 fold changes (LFCs) in gene expression between VIP and PBS conditions plotted against log10 p values from differential expression tests. DEGs that were up- and down-regulated in response to VIP in the control condition are highlighted in green and red respectively on both plots (FDR  <  0.1); DEGs with LFC ≥ ± 1 is highlighted in a darker shade. (D) OPOSSUM3 analysis of over-represented TFBSs in genes upregulated following VIP stimulation in control (N = 508) and ACREB (N = 122) conditions (FDR  <  0.1). Fisher scores, indicating TF target gene enrichment, are plotted against z-scores, indicating TFBS enrichment. (E) Enriched molecular functions (FDR  <  0.05) among genes upregulated in response to VIP (N = 508). (F) Heatmaps of expressed genes annotated to the GO terms glucose metabolic process (GO:0006006), glycolytic process (GO:0006096) and glycogen metabolic process (GO:0005977) or their child terms. Heatmaps show LFCs from baseline (CTRL.PBS) standardized for each gene and hierarchical clustering of genes. DEGs (FDR  <  0.1) are highlighted. (G) A subset of genes identified from analyzing the GO terms in 2F with higher expression in the VIP control relative to ACREB condition. The order of plots corresponds to gene order in the heatmap. P-values for contrasts of interest are indicated (* p  <  0.01; ** p  <  0.001; *** p  <  0.0001; **** p  <  0.00001).
Figure 3
Figure 3
VIP-induced glycogen synthesis is mediated by PKC. (A) Cocultures were preincubated with Go6983 or Rp-cAMP (RpC) prior to VIP stimulation in the presence or absence of the inhibitors. Cells immunolabeled and quantified for pCREB (S121 or S133; green), GFAP (red) and Hoechst dye (blue). Arrowheads in confocal micrograph indicate GFAP-positive nuclei. Scale bar: 10 µm. (B,C) GFAP-positive nuclei were quantified for CREB S121 and S133 intensities and all group data are normalized against basal conditions across individual replicates. (D) Glycogen assay performed on cortical astrocytes stimulated with VIP (0.5 µM; 30 min) in the absence or presence of Go6983 (20 µM) for 6 h before being assayed for glycogen content. Graphs show glycogen concentration relative to basal across all independent experiments. (E) Same experiments as described in (D), except that cells were incubated with RpC (20 µM) during VIP stimulation. (F) Experiment performed similar to (D) except that astrocytes were stimulated with NA instead of VIP in the presence of Go6983 (20 µM) for 6 h before performing glycogen assays. (G,H) qPCR for Ppp1r3c in cortical astrocytes stimulated with VIP but in the presence of either (G) Go6976 or (H) RpC. Astrocytes were harvested 3h after treatment and prepared for RT-qPCR. (I) Cocultures were pretreated with Go6983 (20 µM; 30 min) or RpC (20 µM; 30 min) before being stimulated with VIP (0.5 µM; 30 min) in the presence of inhibitors. Cells were processed for immunocytochemistry and labeled with CRTC2 (green), GFAP (red) or Hoechst dye (blue). (J) The nucleus to cytoplasmic ratio of CRTC2 as shown in (H) were quantified and plotted as a bar graph. Unless otherwise stated, for all graphs, 1-way ANOVA followed by Tukey multiple comparisons tests were performed and only statistical notations relevant to the results are shown in the graphs. Experimental replicates were performed for all datasets to obtain the pooled data and P-values notations are as follows (*p < 0.05; ** p < 0.01; ***p < 0.001; **** p < 0.0001; n.s. not significant). Detailed statistical outputs are listed in the sSupplementary Table.
Figure 4
Figure 4
VIP-induced glycogen synthesis requires activation of conventional PKC. (A) Astrocyte cocultures were pre-treated with BAPTA-AM (30 µM) prior to a brief stimulation with VIP (0.5 µM; 30 min). Cells were immunostained for pCREB (S121 and S133; green), GFAP (red) and Hoechst dye (blue). Scale bar, 10 µm. White arrowheads indicate GFAP-positive astrocyte nuclei. (B,C) Group data show normalized pCREB intensities against average basal values for each independent experiment. (D) Glycogen assay performed on cortical astrocytes stimulated with VIP (0.5 µM; 30 min) in the absence or presence of BAPTA-AM (30 µM) for 6 h. Graphs show glycogen concentration relative to basal across all independent experiments performed. (E) qPCR for Ppp1r3c in cortical astrocytes stimulated with VIP, but in the presence of BAPTA. (F) Astrocyte cocultures were pre-treated with Go6976 (1 µM; 30 min) prior to addition of VIP (0.5 µM; 30 min). Cell were then immunostained with pCREB (S121 or S133; green), GFAP (red) or Hoechst dye (blue). Scale bar, 10 µm. White arrowheads indicate astrocyte nuclei. (GH) Group data show normalized pCREB intensities against average basal values for each independent experiment. (I) Cocultures were treated and processed as described in (F), except cells were immunostained with CRTC2 and quantified. (J) qPCR for Ppp1r3c stimulated cortical astrocytes with VIP, but in the presence of Go6976. mRNA was harvested 3h post-stimulation and RT-qPCR was performed. (K) Cocultures were pretreated with Go6983 before stimulated with PMA (4 nM; 30 min) or VIP (1 µM; 30 min) and immunostained with pCREB (S121 or S133; green), GFAP (red) or Hoechst dye (blue). White arrowheads indicate astrocyte nuclei. Scale bar, 10 µm. (L,M) Group data show normalized pCREB intensities against average basal values for each independent experiment. (N) qPCR for Ppp1r3c in presence of PMA for cortical astrocytes. Unpaired t-tests with Welch’s correction performed on samples. (O) Glycogen assay performed on cortical astrocytes stimulated with PMA (4 nM; 30 min). Cells were assayed for glycogen at 6 h post-recovery. Bar graph plotted to show glycogen concentration relative to basal levels. Unpaired t-tests with Welch’s corrections performed on samples. Unless otherwise stated, all experiments were performed in at least triplicates with 1-way ANOVA followed by Tukey multiple comparisons tests were performed and only relevant statistical notations are shown in the graphs. Experimental replicates were performed for all datasets to obtain the pooled data and P-values notations are as follows (*p < 0.05; ** p < 0.01; ***p < 0.001; **** p < 0.0001; n.s. not significant). Detailed statistical outputs are listed in the Supplementary Table.
Figure 5
Figure 5
Glucose depletion, restoration and CREB-driven glycogen synthesis. (A) Cortical astrocytes incubated in media containing 6 mM (basal) before being swapped with media depleted of glucose (0 mM) for 1 h. A subset of cells was recovered in basal media for 1 h (restoration). Upon recovery, glycogen assays were done on all samples, quantified. (B) Experiment was performed similar as described in (A), except cortical astrocytes were processed for immunocytochemistry with antibodies used to detect glycogen granules (ESG1A9 green, GAPDH, red). Hoechst dye (blue) was included to label the nucleus. Scale bar, 10 µm. (C) The density of ESG1A9 puncta in astrocytes as shown in (B) were quantified and plotted as a bar graph. (D,E) Experiments were carried out as described in (A) but in addition, cells were incubated with Go6983 (20 µM) or Rp-cAMP (RpC, 20 µM) throughout refeeding period. After treatment, cells were immunolabeled to detect pCREB S121 and S133 and quantified in GFAP-positive cells. Scale bar, 20 µm. (F) Cells were treated similarly as described in (A) but immunolabeled to detect CRTC2 (green) and GFAP (red) along with Hoechst dye to label the nucleus (blue). Scale bar 20 µm. (G) Nucleus to cytoplasmic ratio for CRTC2 were quantified for GFAP-positive astrocytes. (H) Cortical astrocytes were transduced with ACREB expressing lentivirus or a control pCIG vector. Cells were incubated with media depleted for glucose (0 mM; 3 h) followed by recovery in basal media (6 mM; 2 h). After recovery, glycogen assays were performed and quantified. (IK) qPCR was performed for Ppp1r3c, C/ebp-β and Phkg1 on cortical astrocytes depleted or refed with glucose similar to that described for (A). Unless otherwise stated, for all graphs, 1-way ANOVA followed by Tukey multiple comparisons tests were performed and only relevant statistical notations are shown in the graphs. For all experiments, experimental replicates were performed to obtain the pooled data and P-values notations are as follows (*p < 0.05; ** p < 0.01; ***p < 0.001; **** p < 0.0001; n.s. not significant). Detailed statistical outputs are listed in the sSupplementary Table.

Similar articles

Cited by

References

    1. Suzuki, A. et al. Astrocyte-neuron lactate transport is required for long-term memory formation. Cell144, 810–823. 10.1016/j.cell.2011.02.018 (2011). 10.1016/j.cell.2011.02.018 - DOI - PMC - PubMed
    1. Newman, L. A., Korol, D. L. & Gold, P. E. Lactate produced by glycogenolysis in astrocytes regulates memory processing. PLoS ONE6, e28427. 10.1371/journal.pone.0028427 (2011). 10.1371/journal.pone.0028427 - DOI - PMC - PubMed
    1. O’Dowd, B. S., Gibbs, M. E., Ng, K. T., Hertz, E. & Hertz, L. Astrocytic glycogenolysis energizes memory processes in neonate chicks. Brain Res. Dev. Brain Res.78, 137–141. 10.1016/0165-3806(94)90018-3 (1994). 10.1016/0165-3806(94)90018-3 - DOI - PubMed
    1. Gibbs, M. E., Anderson, D. G. & Hertz, L. Inhibition of glycogenolysis in astrocytes interrupts memory consolidation in young chickens. Glia54, 214–222. 10.1002/glia.20377 (2006). 10.1002/glia.20377 - DOI - PubMed
    1. Pellerin, L. & Magistretti, P. J. Glutamate uptake into astrocytes stimulates aerobic glycolysis: A mechanism coupling neuronal activity to glucose utilization. Proc. Natl. Acad. Sci. U.S.A.91, 10625–10629. 10.1073/pnas.91.22.10625 (1994). 10.1073/pnas.91.22.10625 - DOI - PMC - PubMed

MeSH terms