. 2025 Feb;97(3):1127-1133.
doi: 10.1038/s41390-024-03420-z. Epub 2024 Aug 3.

Distinct mitochondrial respiration profiles in pediatric patients with febrile illness versus sepsis

Affiliations

Distinct mitochondrial respiration profiles in pediatric patients with febrile illness versus sepsis

Laura F Sartori et al. Pediatr Res. 2025 Feb.

Abstract

Objective: Mitochondrial dysfunction, linked to sepsis-related organ failure, is unknown in febrile illness.

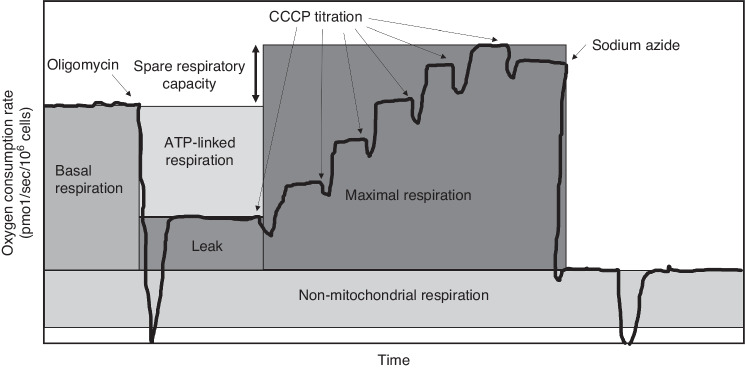
Methods: Prospective study of children in an Emergency Department (ED) with febrile illness or without infection (ED controls); secondary analysis of ICU patients with sepsis or without infection (ICU controls). Mitochondrial oxygen consumption measured in peripheral blood mononuclear cells using respirometry, with primary outcome of spare respiratory capacity (SRC). Mitochondrial content measured as citrate synthase (CS: febrile illness and ED controls) and mitochondrial to nuclear DNA ratio (mtDNA:nDNA: all groups).

Results: SRC was lower in febrile illness (6.7 ± 3.0 pmol/sec/106 cells) and sepsis (5.7 ± 4.7) than ED/PICU controls (8.5 ± 3.7; both p < 0.05), but not different between febrile illness and sepsis (p = 0.26). Low SRC was driven by increased basal respiration in febrile illness and decreased maximal uncoupled respiration in sepsis. Differences were no longer significant after adjustment for patient demographics. Febrile illness demonstrated lower CS activity than ED controls (p = 0.07) and lower mtDNA:nDNA than both ED/PICU controls and sepsis (both p < 0.05).

Conclusion: Mitochondrial SRC was reduced in both febrile illness and sepsis, but due to distinct mitochondrial profiles and impacted by demographics. Further work is needed to determine if mitochondrial profiles could differentiate febrile illness from early sepsis.

Impact statement: Mitochondrial dysfunction has been linked to organ failure in sepsis, but whether mitochondrial alterations are evident in febrile illness without sepsis is unknown. In our study, while mitochondrial spare respiratory capacity (SRC), an index of cellular bioenergetic reserve under stress, was reduced in children with both febrile illness and sepsis compared to children without infections, low SRC was driven by increased basal respiration in febrile illness compared with decreased maximal uncoupled respiration in sepsis. Additional research is needed to understand if distinct mitochondrial profiles could be used to differentiate febrile illness from early sepsis in children.


Conflict of interest statement

Competing interests: The authors declare no competing interests. Consent Statement: All participants agreed to the study under IRB-approved informed consent.

Figures

Fig. 1
Fig. 1. Schematic oxygen tracing of oxygen consumption measured in intact peripheral blood mononuclear cells.
The solid black line represents the amount of oxygen present in the chamber over time. Basal oxygen consumption is measured, then oligomycin (ATP-synthase inhibitor) is added to obtain Leak (proton leak after inhibition of ATP synthase). Carbonyl cyanide m-chlorophenylhydrazone (CCCP), an uncoupler, is serially added until no further oxygen consumption is detected to obtain maximal respiration. Non-mitochondrial respiration is obtained by adding sodium azide (electron transport system complex IV inhibitor) and subtracted from other respiration measurements. ATP-linked respiration is calculated as basal minus leak. Spare respiratory capacity (SRC, double-headed arrow) is calculated as maximal respiration minus basal respiration. Adapted from Weiss, et al..
Fig. 2
Fig. 2
Consort diagram.
Fig. 3
Fig. 3. PBMC mitochondrial respiration by group.
Bar graph of PBMC mitochondrial respiration. Basal respiration, proton leak after inhibition of ATP synthase (leak), and maximal uncoupled respiration through the electron transport system (ETSmax), were directly measured using respirometry. ATP-linked respiration was calculated by subtracting leak from basal respiration. Spare respiratory capacity (SRC) was calculated by subtracting basal respiration from ETSmax. Bars represent mean and error bars represent standard deviation. *p-value ≤ 0.05 compared to controls. +p-value ≤ 0.05 compared to sepsis. Fever exhibited higher basal and ATP-linked respiration than controls, but lower SRC. Compared to sepsis, children with fever exhibited higher basal, leak, ATP-linked, and ETSmax than sepsis, but no difference in SRC.
Fig. 4
Fig. 4. Measures of mitochondrial content by group.
a Citrate synthase activity by group. Bar graphs of citrate synthase (CS) activity, a measure of mitochondrial content, in control and fever groups. CS was higher in ED controls than fever, though not at a level of significance (p = 0.07). Bars represent mean and error bars represent standard deviation. b Mitochondrial DNA:Nuclear DNA by Group. Bar graphs of mitochondrial DNA:nuclear DNA (mtDNA:nDNA), presented as expression fold change in fever and sepsis relative to controls. Expression fold change was lower in fever than in control or sepsis. Bars represent mean and error bars represent standard deviation. *p-value ≤ 0.05 when comparing fever to control groups: +p-value ≤ 0.05 when comparing fever to sepsis groups.
Fig. 5
Fig. 5. PBMC mitochondrial respiration normalized to mitochondrial content by group.
Bar graphs of PBMC mitochondrial respiration (Basal, ATP-linked, leak, ETSmax, and Spare Respiratory Capacity) adjusted for citrate synthase activity, a marker of mitochondrial content. All measures of mitochondrial respiration except SRC were higher in children with fever compared to controls. Bars represent mean and error bars represent standard deviation. *p-value ≤ 0.05.

References

    1. McDermott KW, Stocks C, Freeman WJ. Overview of pediatric emergency department visits, 2015. In: Healthcare Cost and Utilization Project (HCUP) Statistical Briefs. Agency for Healthcare Research and Quality (US); 2006. Accessed August 4, 2022. http://www.ncbi.nlm.nih.gov/books/NBK526418/.
    1. Singer, M. et al. The third international consensus definitions for sepsis and septic shock (sepsis-3). JAMA315, 801–810 (2016). - PMC - PubMed
    1. Rudd, K. E. et al. Global, regional, and national sepsis incidence and mortality, 1990–2017: analysis for the Global Burden of Disease Study. Lancet Lond. Engl.395, 200–211 (2020). - PMC - PubMed
    1. Weiss, S. L. et al. Surviving sepsis campaign international guidelines for the management of septic shock and sepsis-associated organ dysfunction in children. Pediatr. Crit. Care Med21, e52 (2020). - PubMed
    1. Singer, M. The role of mitochondrial dysfunction in sepsis-induced multi-organ failure. Virulence5, 66–72 (2014). - PMC - PubMed