Observational Study
. 2024 Nov;30(11):3150-3162.
doi: 10.1038/s41591-024-03146-9. Epub 2024 Aug 2.

Safety and reactogenicity of a controlled human infection model of sand fly-transmitted cutaneous leishmaniasis

Affiliations
Observational Study

Safety and reactogenicity of a controlled human infection model of sand fly-transmitted cutaneous leishmaniasis

Vivak Parkash et al. Nat Med. 2024 Nov.

Abstract

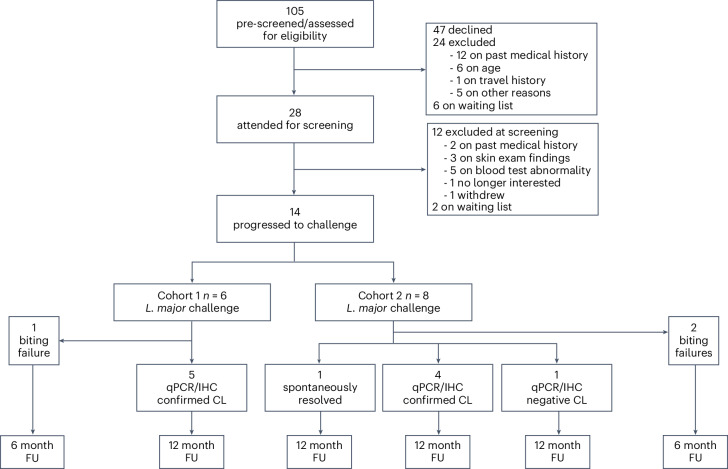
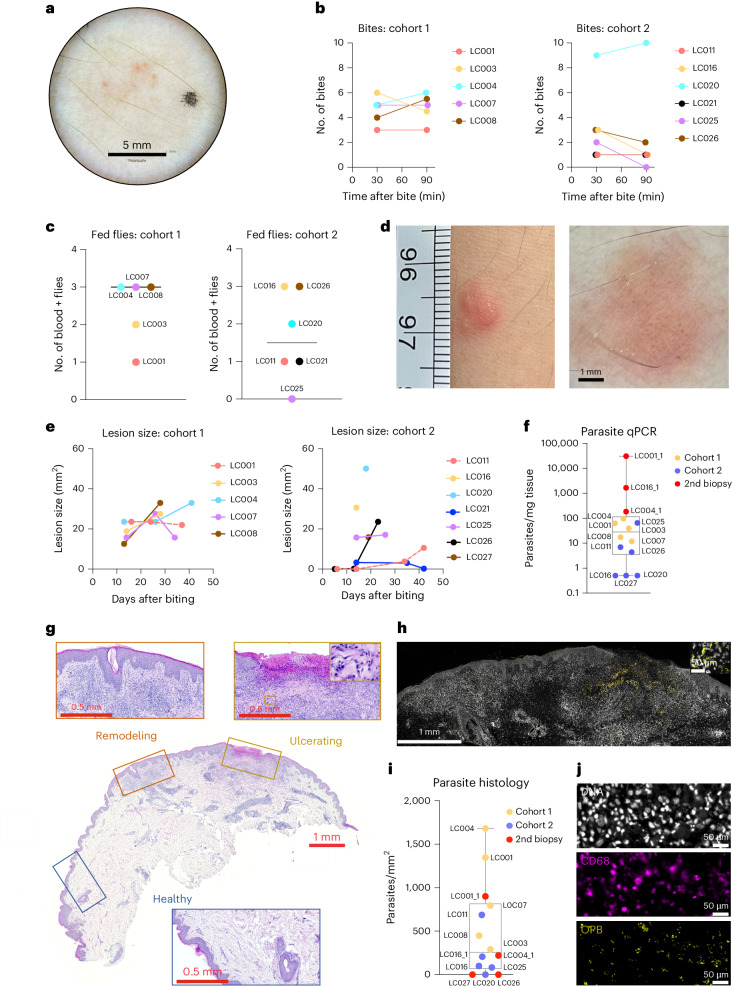
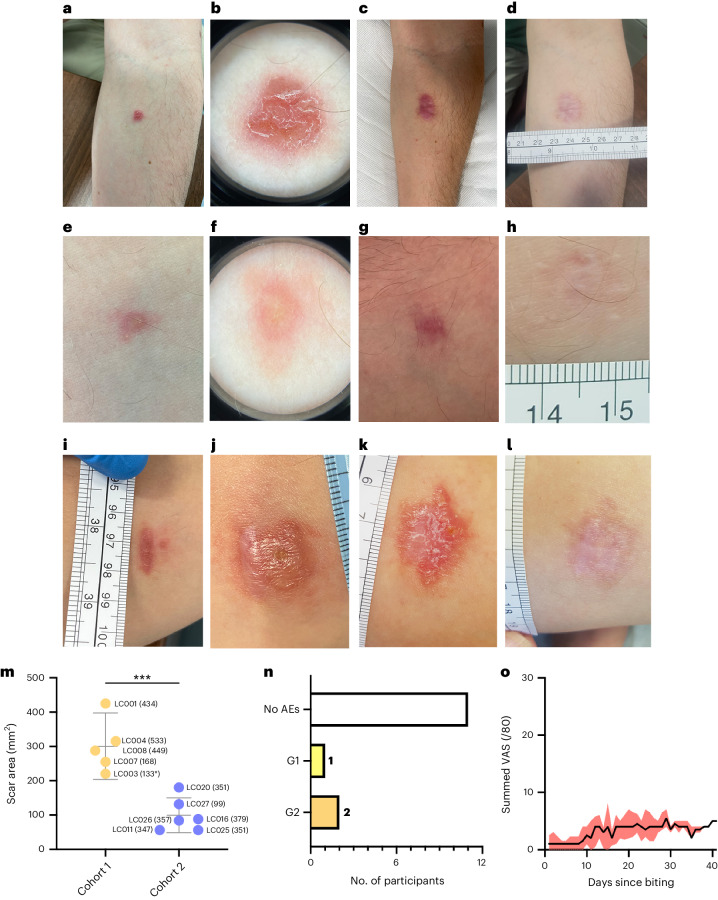
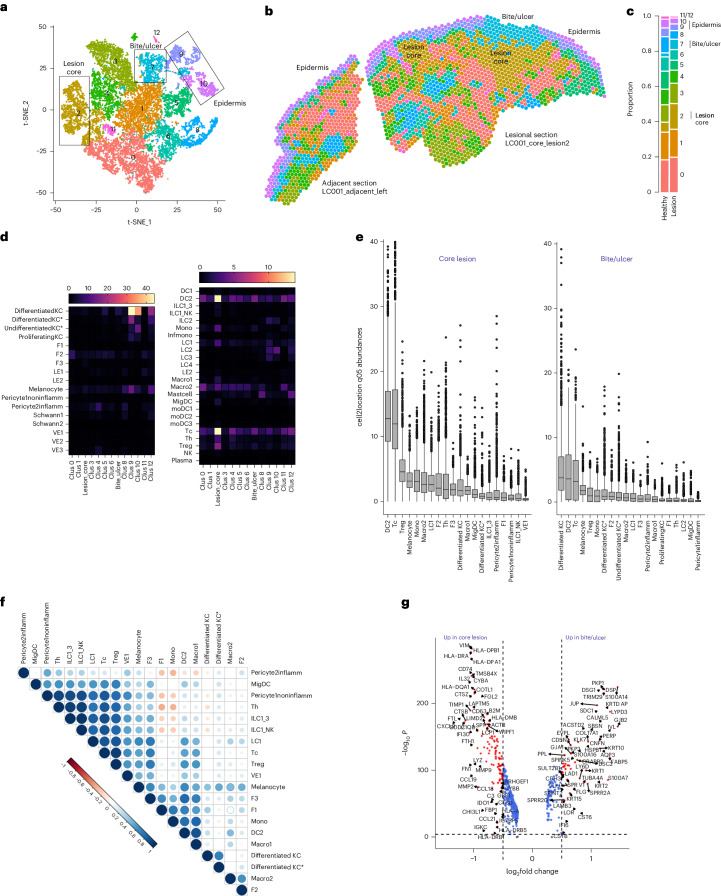
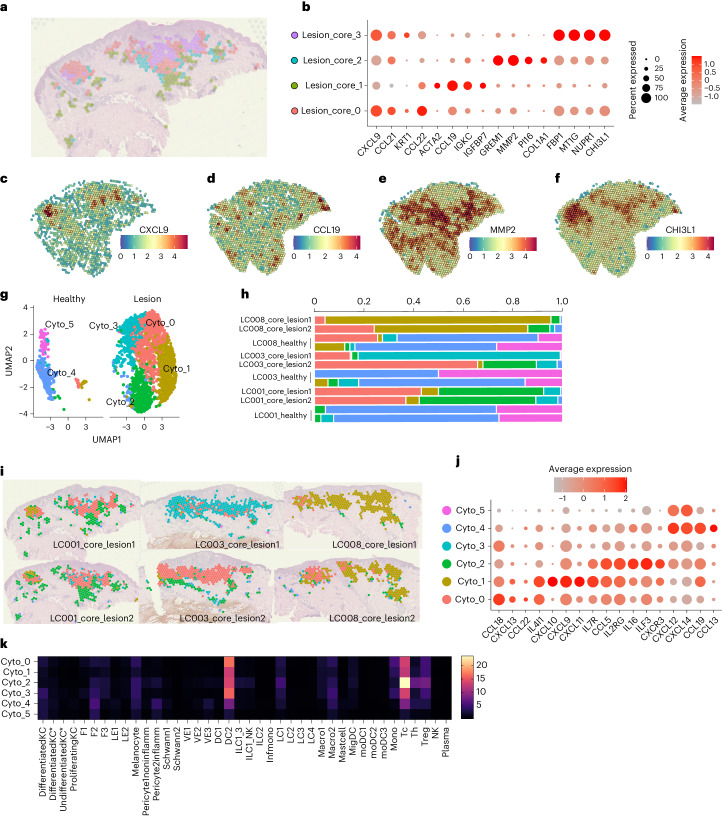
The leishmaniases are globally important parasitic diseases for which no human vaccines are currently available. To facilitate vaccine development, we conducted an open-label observational study to establish a controlled human infection model (CHIM) of sand fly-transmitted cutaneous leishmaniasis (CL) caused by Leishmania major. Between 24 January and 12 August 2022, we exposed 14 participants to L. major-infected Phlebotomus duboscqi. The primary objective was to demonstrate effectiveness of lesion development (take rate) and safety (absence of CL lesion at 12 months). Secondary and exploratory objectives included rate of lesion development, parasite load and analysis of local immune responses by immunohistology and spatial transcriptomics. Lesion development was terminated by therapeutic biopsy (between days 14 and 42 after bite) in ten participants with clinically compatible lesions, one of which was not confirmed by parasite detection. We estimated an overall take rate for CL development of 64% (9/14). Two of ten participants had one and one of ten participants had two lesion recurrences 4-8 months after biopsy that were treated successfully with cryotherapy. No severe or serious adverse events were recorded, but as expected, scarring due to a combination of CL and the biopsy procedure was evident. All participants were lesion free at >12-month follow-up. We provide the first comprehensive map of immune cell distribution and cytokine/chemokine expression in human CL lesions, revealing discrete immune niches. This CHIM offers opportunities for vaccine candidate selection based on human efficacy data and for a greater understanding of immune-mediated pathology. ClinicalTrials.gov identifier: NCT04512742 .


Conflict of interest statement

Competing interests P.M.K. and C.J.N.L. are co-authors of a patent protecting the gene insert used in Leishmania candidate vaccine ChAd63-KH (Europe 10719953.1; India 315101). The other authors declare no competing interests.

Figures

Fig. 1
Fig. 1. CONSORT diagram summarizing the LEISH_Challenge study.
A CONSORT checklist is included in Supplementary Information. Details of participant demographics are provied in Supplementary Table 1. Study protocol and the participant information sheet are provied in Supplementary Information. FU, follow-up.
Fig. 2
Fig. 2. Parasitological outcomes in the LEISH_Challenge study.
a, Representative dermoscopy image showing bite sites. b, Number of recorded bites per participant per cohort at 30 min and 90 min. No significant differences were noted between cohorts at either 30 min (P = 0.104) or 90 min (P = 0.08) (two-sided Mann–Whitney test). n = 5 (cohort 1) and n = 6 (cohort 2). c, Number of partially and/or fully blood-fed sand flies after biting per participant per cohort (P = 0.36; two-sided Mann–Whitney test). n = 5 (cohort 1) and n = 6 (cohort 2). Bar represents the median. d, CL lesion development and associated dermoscopy image (LC004, 13 d p.b.). e, Lesion areas (mm2) at varying times after bite per participant per cohort. f, Parasite load per milligram of biopsy tissue. Individual symbols reflect a single participant/biopsy (n = 14); box and whisker plot with median and maximum/minimum values. g, H&E-stained biopsy tissue from LC001, highlighting histologically normal tissue, a potential bite site with epidermal remodeling and an ulcer. Box in the upper right image indicates higher magnification view of area of parasitism. Representative H&E-stained sections from all other participants are shown in Extended Data Fig. 1. Scale bar, as indicated. At least two independent sections from each participant were studied. h, IHC for Leishmania OPB (yellow) counterstained for nuclei (YOYO-1; white). Area shown represents remodeling and ulcerated regions from serial section to that shown in g. Box shows higher magnification of area of parasitism. i, Parasites per mm2 of tissue was determined by quantitative morphometry. Symbols show each participant and respective cohort (n = 14); box and whisker plot with median and maximum/minimum values. j, IHC for OPB (yellow) and CD68 (purple) to show intracellular parasitism. Parasites are also evident by nuclear staining (YOYO1; white) with characteristic nucleus/kinetoplast. Scale bar, 50 μm. p.b., post-bite.
Fig. 3
Fig. 3. Clinical features of the LEISH_Challenge study.
ad, Participant LC008 images taken 28 d post-bite (p.b.) and before excision biopsy (a,b) and 223 d (c) and 476 d (d) p.b. eh, Participant LC011 images taken 42 d p.b. and before 4-mm punch biopsy (a,b) and 140 d (c) and 350 d (d) p.b. Dermoscopy images are shown in b and f. il, Participant LC001 had a primary lesion (excised 37 d p.b), followed by a secondary lesion (4-mm punch biopsy and cryotherapy at 255 d p.b.). Images showing secondary lesion adjacent to healing primary lesion at 161 d (a) 251 d (b), 309 d (c) and 470 d (d) p.b. m, Quantitation of scar area at final measured follow-up. Data are presented as individual data points (labeled by participant ID and time in days from initial biopsy) with mean and 95% CI. n = 5 (cohort 1) and n = 6 (cohort 2). ***P = 0.0005 (two-sided Student’s t-test). Further details are provided in Supplementary Table 1. n, Number of adverse events by grade (G) assigned as definitely, probably or possibly related to the study. Further details are provided in Supplementary Table 1. o, Summed participant-recorded VAS across eight parameters (itch, pain, erythema, swelling, malaise, myalgia, fever and nausea). Maximum score available = 80. Data are shown as median and interquartile range (IQR) for all participants. Individual participant scores and summed scores for each parameter are provided in Extended Data Fig. 2. AE, adverse event.
Fig. 4
Fig. 4. Inflammatory response after L. major challenge.
a, Immuno-histological detection (yellow) of lesion expression of CD4, CD8, CD68, CD14, CD20, CD66b and parasites (OPB), shown for a single participant (LC001). Sections were counterstained for nuclei (YOYO1, white). Scale bars, 1 mm (left images) and 0.5 mm (white box; right images). Higher magnification images for white boxes shown in the right panel are provided in Extended Data Fig. 1, and pairwise staining combinations on serial sections are shown in bd. b, Representative images of CD4 (yellow), CD8 (red), DNA (white) and merged image. CD4+CD8+ cells are indicated by arrowheads. c, Representative images of CD68 (blue), CD14 (purple), DNA (white) and merged image. Infected CD14+CD68+ cells are indicated by arrowheads. d, Representative images of CD68 (blue) and CD66b (green), DNA (white) and merged image. Uninfected CD66b+ cells are seen adjacent to heavily parasitized CD68+ cells. e, Quantitation of cellular infiltrate across all participants based on IHC. Second biopsies are denoted by participant number followed by _1. Data are shown in stacked bar format with time of biopsy (days post-bite) shown in parentheses above the bar. Data were derived from whole sections. f, Correlation between time after biopsy and CD8:CD4 ratio. Data were analyzed using Spearmanʼs two-tailed test. g, Proportion of total parasites found in CD14+, CD68+, CD14+CD68+ or other cell types. Total number of parasites counted ranged from 327 to 38,693, except for LC025 where only 14 parasites were detected. Data are shown in stacked bar format.
Fig. 5
Fig. 5. Transcriptomic landscape of early L. major lesions.
FFPE sections from LC001, LC003 and LC008 were processed for Visium spatial transcriptomics with cell deconvolution performed using cell2location based on skin cell types identified by Reynolds et al.. a,b, Clustering of spots reveals 13 clusters in UMAP space (a) and with discrete spatial locations (b). Cluster locations are mapped to lesion and adjacent sections from LC001. Mapping to LC003 and LC008 and additional sections from LC001 are shown in Extended Data Fig. 4. c, Proportion of spots attributed to each cluster in healthy and lesion tissue. Data are pooled across all participants/sections. d, Heatmap representation of cellular abundances by cluster as determined by cell2location using the Reynolds et al. reference dataset. Scale represents predicted 5% quantile abundances (q05 = 5% quantile values of the posterior distribution). e, Box and whisker plots representing cellular abundances/spot as in d for lesion core (cluster 2) and ulcer (cluster 7). Data are shown for the top 20 most abundant cell types. n = 20,241 spots derived from four sections from each of three participants. Box bounds show interquartile range (IQR) from the 25th to the 75th percentile; whiskers show the smallest and largest values within 1.5× the IQR from the lower and upper quartiles; and outliers are shown as data points outside the whiskers. f, Pairwise Pearson’s correlations are represented as a correlation plot between cell types to infer spatial co-localization. g, Volcano plot of differentially expressed genes (log2FC > 1.5 and FDR = 0.05) comparing lesion core with ulcer. Statistical analysis was performed using two-sided Wilcoxon rank-sum test with Bonferroni correction for multiple comparisons.
Fig. 6
Fig. 6. Discrete spatial niches in the lesion core.
a, Subdivision of the lesion core cluster (Fig. 5a,b) into four subclusters. b, Bubble plot showing top genes associated with lesion core subclusters. cf, CXCL9 (c), CCL19 (d), MMP2 (e) and CHI3L1 (f) mRNA abundance mapped to LC001 for visualization. g,h, Re-clustered lesion core (Lesion_core_0/1/2/3 as in a,b) based on chemokine and cytokine family genes visualized in UMAP space as Cyto_0/1/2/3/4/5 and shown separately for healthy versus lesional tissue (g). h, Proportion of spots in healthy and lesion tissue shown individually for each section/participant. i, Cyto_0/1/2/3 clusters mapped to each participant for visualization. j, Bubble plot showing key genes associated with each cytokine/chemokine-based cluster. Scale bar shows average expression. k, Predicted cell abundances for Cyto_0–5 clusters, based on data from all sections (n = 6) and participants (n = 3).
Extended Data Fig. 1
Extended Data Fig. 1. H&E-stained FFPE sections from each biopsy.
a-n. H&E stained FFPE sections from all biopsied participants. A single section is shown per participant, representative of at least three examined. Boxed areas are shown at higher magnification. All scale bars represent 1mm.
Extended Data Fig. 2
Extended Data Fig. 2. Visual Analogue Scores by feature and participant.
a-h. VAS scores out of 10 for itch, pain, erythema, swelling, malaise, myalgia, fever and nausea. Data shown as mean and range for all participants with positive bite (n=11). i-r. Summed VAS scores for each participant. Data shown as total score out of 80.
Extended Data Fig. 3
Extended Data Fig. 3. IHC staining for immune cells populations.
a-g. IHC (yellow) for CD4 (a), CD8 (b), CD68 (c), CD14 (d), CD20 (e), CD66b (f) and Leishmania OPB (g). Left and right images correspond to boxed areas of images shown in Fig. 4a right. Images are for a single participant (LC001) and pair wise staining was performed on serial sections. Scale bar in all images represents 0.2 mm.
Extended Data Fig. 4
Extended Data Fig. 4. Visium spatial maps of CL lesions.
a, heat map representation of top 5 genes representing clusters 0–12 in Fig. 5a and 5b. b, tSNE representation of clusters by lesion vs adjacent tissue. c, tSNE representation showing overlays for all samples studied. d-f, spatial mapping of clusters for all sections studied for participant LC003 (d), LC001 (e) and LC008 (f).
Extended Data Fig. 5
Extended Data Fig. 5. Localisation of select mRNA and predicted cell types.
a, feature maps showing location of mRNA LOR, KRT5, LYZ, S100A2, TNF, IFNG, IL10 and IL1B. b, Feature maps showing cell2location-predicted cells types by abundance for monocytes (Mono), myeloid dendritic cells 2 (DC2), macrophages 2 (Macro2), fibroblasts 1 (F1), cytotoxic T cells (Tc), helper T cells (Th) and regulatory T cells (Treg).

References

    1. Mann, S. et al. A review of leishmaniasis: current knowledge and future directions. Curr. Trop. Med. Rep.8, 121–132 (2021). - PMC - PubMed
    1. Okwor, I. & Uzonna, J. Social and economic burden of human leishmaniasis. Am. J. Trop. Med. Hyg.94, 489–493 (2016). - PMC - PubMed
    1. World Health Organization. Global leishmaniasis surveillance: 2019–2020, a baseline for the 2030 roadmap https://www.who.int/publications/i/item/who-wer9635-401-419 (2021).
    1. Bailey, F. et al. Cutaneous leishmaniasis and co-morbid major depressive disorder: a systematic review with burden estimates. PLoS Negl. Trop. Dis.13, e0007092 (2019). - PMC - PubMed
    1. Bilgic-Temel, A., Murrell, D. F. & Uzun, S. Cutaneous leishmaniasis: a neglected disfiguring disease for women. Int. J. Womens Dermatol.5, 158–165 (2019). - PMC - PubMed

Publication types

Associated data