. 2024 Nov;30(11):3163-3172.
doi: 10.1038/s41591-024-03183-4. Epub 2024 Aug 2.

Antifungal heteroresistance causes prophylaxis failure and facilitates breakthrough Candida parapsilosis infections

Affiliations

Antifungal heteroresistance causes prophylaxis failure and facilitates breakthrough Candida parapsilosis infections

Bing Zhai et al. Nat Med. 2024 Nov.

Abstract

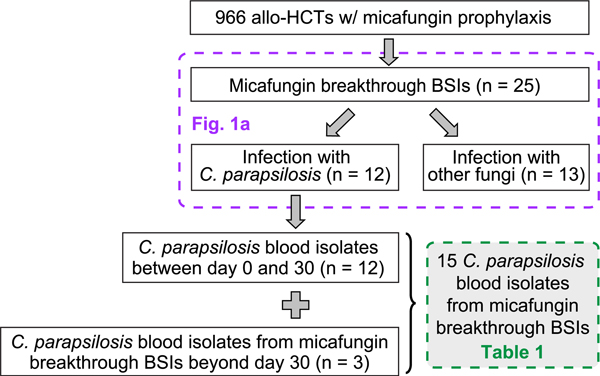
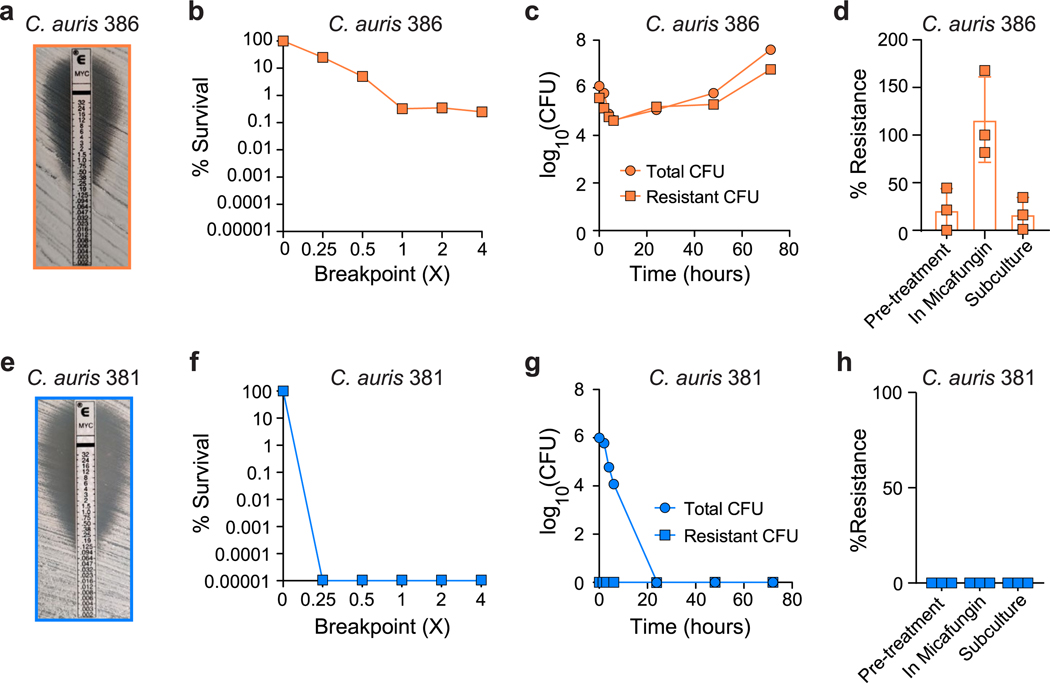
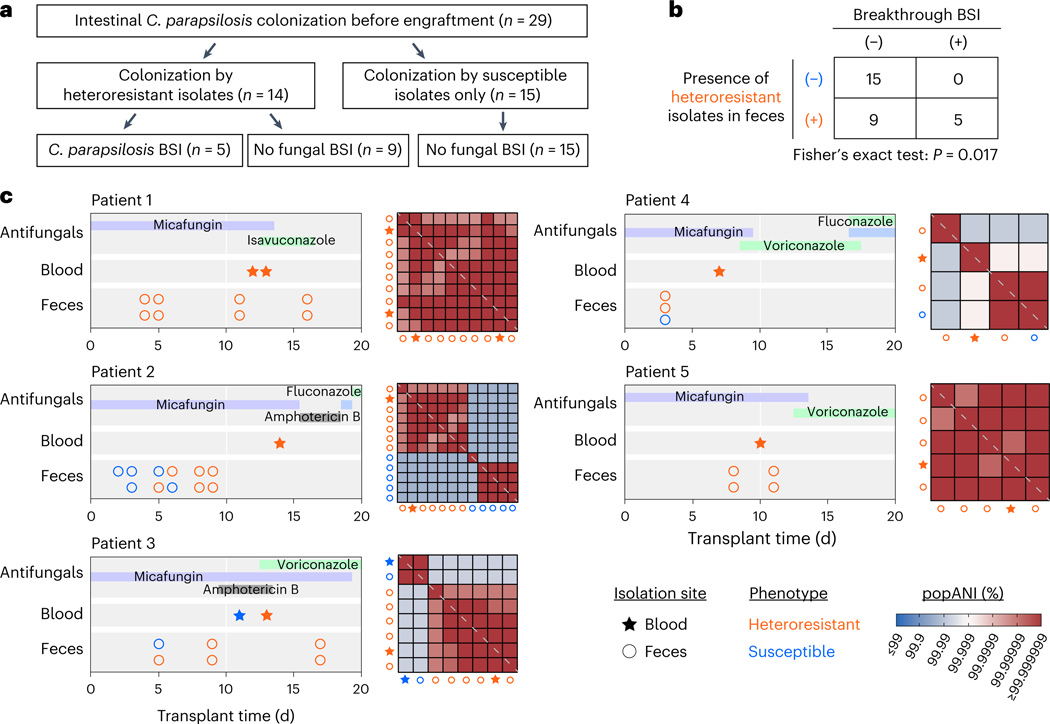
Breakthrough fungal infections in patients on antimicrobial prophylaxis during allogeneic hematopoietic cell transplantation (allo-HCT) represent a major and often unexplained cause of morbidity and mortality. Candida parapsilosis is a common cause of invasive candidiasis and has been classified as a high-priority fungal pathogen by the World Health Organization. In high-risk allo-HCT recipients on micafungin prophylaxis, we show that heteroresistance (the presence of a phenotypically unstable, low-frequency subpopulation of resistant cells (~1 in 10,000)) underlies breakthrough bloodstream infections by C. parapsilosis. By analyzing 219 clinical isolates from North America, Europe and Asia, we demonstrate widespread micafungin heteroresistance in C. parapsilosis. Standard antimicrobial susceptibility tests, such as broth microdilution or gradient diffusion assays, which guide drug selection for invasive infections, fail to detect micafungin heteroresistance in C. parapsilosis. To facilitate rapid detection of micafungin heteroresistance in C. parapsilosis, we constructed a predictive machine learning framework that classifies isolates as heteroresistant or susceptible using a maximum of ten genomic features. These results connect heteroresistance to unexplained antifungal prophylaxis failure in allo-HCT recipients and demonstrate a proof-of-principle diagnostic approach with the potential to guide clinical decisions and improve patient care.


Conflict of interest statement

Competing interests T.R. is a current employee of BioNTech. All other authors have no competing interests.

Figures

Extended Data Fig. 1 |
Extended Data Fig. 1 |. Micafungin breakthrough infections in allo-HCT recipients in MSKCC from Jan. 2016 to Dec. 2020.
The dashed-line boxes indicate the patients or fungal isolates analyzed in respective figure panels or tables.
Extended Data Fig. 2 |
Extended Data Fig. 2 |. Antifungal susceptibility of C. parapsilosis blood isolates to echinocandin drugs.
(a, b) Reproducibility of the PAP method in determining micafungin heteroresistance: a, three repeats of PAP assays of the 15 C. parapsilosis blood isolates in Table 1. b, micafungin susceptibility phenotypes (susceptible or heteroresistant) classified by the PAP curves in panel a. (c, d) Antifungal susceptibility of C. parapsilosis isolates to (c) caspofungin and (d) anidulafungin. Isolates MSK65, MSK794, MSK795, and MSK2384 are heteroresistant to micafungin (colored in orange), while the isolates MSK804, MSK811, and MSK2386 are susceptible to micafungin (colored in blue). Among these isolates, the phenotypes of caspofungin and anidulafungin heteroresistance were generally consistent with their micafungin heteroresistance phenotype, with exceptions of MSK795 (heteroresistant to micafungin and caspofungin, susceptible to anidulafungin) and MSK804 (susceptible to micafungin and anidulafungin, heteroresistant to caspofungin). (e) Etest results of four additional C. parapsilosis blood isolates. MSK67 and MSK795 are micafungin-heteroresistant (orange font), MSK811 and MSK1191 are micafungin susceptible (blue font). Notably, both heteroresistant isolate (MSK795) and susceptible isolate (MSK811) could have clean inhibition zone around the Etest strip. Again, these observations showed the challenge of using Etest to differentiate micafungin-heteroresistant and micafungin-susceptible isolates.
Extended Data Fig. 3 |
Extended Data Fig. 3 |. Micafungin heteroresistance in Candida auris clinical isolates.
Candida auris isolate (a – d) 386 and (e – h) 381 were obtained from CDC and FDA AR Isolate Bank. (a, e) Micafungin E-test results for C. auris isolates (a) 386 and (e) 381. (b, f) Micafungin population analysis profiles for C. auris isolates (b) 386 and (f) 381. Percent survival was calculated compared to growth on drug-free agar. (c, g) CFU dynamics of total and resistant subpopulations of C. auris isolates (c) 386 and (g) 381 under micafungin pressure (0.5 μg/mL). Cultures were plated at indicated time points for enumeration of total (circles) and resistant (squares) cells. (d, h), Frequency of micafungin-resistant subpopulation of C. auris isolates (d) 386 and (h) 381 during continuous passage. The frequency was calculated after a 24-hour growth period in YPD broth (Pre-treatment), followed by a 48-hour passage in YPD broth with 0.5 μg/mL micafungin (In micafungin), and subsequently, a passage in YPD broth without micafungin for 24 hours (Subculture). Bar height: mean; error bars: standard deviation of technical replicates, n = 3.
Extended Data Fig. 4 |
Extended Data Fig. 4 |. Tracking the stability of micafungin susceptibility phenotypes of identical C. parapsilosis fecal isolates within patients.
Each filled circle represents a fecal isolate and all isolates shown in each row are identical. To simplify presentation, identical isolates collected on the same day have been consolidated into a single, filled circle. The susceptible and heteroresistant isolates obtained from Patient 2 were displayed at two separate rows.
Extended Data Fig. 5 |
Extended Data Fig. 5 |. Twelve C. parapsilosis isolates with aneuploidy.
The mean copy number of consecutive fixed-size 5 kb windows over the entire genome were plotted for the isolates with aneuploidy. The mean copy number was computed as the mean read depth across each 5 kb window divided by that averaged over normal diploid chromosomes. Chr: chromosome, S: susceptible, HR: heteroresistant.
Extended Data Fig. 6 |
Extended Data Fig. 6 |. Different types of copy number variations (CNVs).
To illustrate our approach for characterizing CNVs, we have provided five examples of open reading frames (ORFs) with distinct CNV types. In each panel, the light gray curve represents distribution of read depth of each position within an ORF. The solid red line fits a Gaussian kernel to this distribution. The vertical dashed red line indicates the peak center of the fitted distribution. The percentage contribution of each peak to the entire distribution is provided in the panel. The feature values of these ORFs used in following analyses (for example, statistical association, machine learning) are shown in the table at the bottom right. Each ORF is described by a categorical feature (CNV_cat) and a quantitative feature (CNV_quant). CNV_cat specifies the CNV types (normal diploid ORF, partial amplification, full amplification, full deletion, partial deletion), while CNV_quant specifies the copy number of the amplified or deleted regions (the value of CNV_quant is 2 in the absence of amplification and deletion).
Extended Data Fig. 7 |
Extended Data Fig. 7 |. Distributions of Feature 100 (a) and 4470 (b) across the phylogenetic tree.
Both features are single nucleotide variants. The biological functions of the open reading frames to which they belong are shown. Saccharomyces cerevisiae, S.c. GSC2 is the paralog of FKS1 in S. cerevisiae genome.
Extended Data Fig. 8 |
Extended Data Fig. 8 |. Hierarchical clustering of pairwise popANI (population average nucleotide identity) values across all 219 C. parapsilosis isolates.
Each row or column represents an individual isolate. A gray box indicates a popANI value of at least 99.999% between the respective row and column isolates, while a white box indicates a value below this cutoff. Using the cutoff, we identified 91 clusters of varying sizes (inset, red circle; see Methods). For each cluster that contains at least two isolates, any pair of isolates within this cluster has a popANI value of at least 99.999%, indicating that these isolates are all identical to each other. The inset curve also shows the impact of the popANI threshold on the number of identified clusters. The exact pairwise popANI values are available in Source Data.
Extended Data Fig. 9 |
Extended Data Fig. 9 |. Schematic diagram of machine learning framework in predicting micafungin susceptibility phenotype.
The framework implemented a nested cross-validation procedure that involves an outer cross-validation loop for evaluating model performance and an inner cross-validation loop for feature selection and hyperparameter tuning. LASSO: Least Absolute Shrinkage and Selection Operator; ENNS: Ensemble Neural Network Selection; XGBoost: Extreme Gradient Boosting.
Extended Data Fig. 10 |
Extended Data Fig. 10 |. Performance of machine learning models.
(a) Precision, recall, and accuracy scores of machine learning models constructed with different combinations of feature selection algorithms (LOGIT, LASSO, ENNS) and classifiers (RF, XGBoost). In all boxplots, each dot represents a single train-test split, which was randomly repeated 50 times. The models were ranked based on their median scores in the ascending order. LOGIT+XGBoost always achieved the highest median score. LOGIT, Logistic regression; LASSO, Least Absolute Shrinkage and Selection Operator; ENNS, Ensemble Neural Network Selection; RF, Random Forest; XGBoost, Extreme Gradient Boosting. (b) Impact of training data resampling on machine learning model performance. The distributions of precision, recall, accuracy, and F1 score were generated across 50 train-test splits. For this analysis, LOGIT was used as the feature selector and XGBoost was used as the classifier. Under-sampling randomly selected existing samples from the susceptible class, while over-sampling used SMOTE (Synthetic Minority Over-sampling TEchnique) to generate synthetic samples of the heteroresistant class. No RS: No resampling; US: Under-sampling; OS: Over-sampling. (c) Distribution of feature importance scores across 50 train-test splits. Features were selected by the combination of LOGIT and XGBoost. The number in the parenthesis of each feature indicates its rank in statistical association analysis of micafungin heteroresistance using the entire dataset. (d) Misclassification (both false-positive and negative predictions) percentage for all isolates misclassified at least once among 50 random train-test splits. The number within parenthesis following each isolate identifier indicates how many times the isolate was included in the test set.
Fig. 1 |
Fig. 1 |. Micafungin heteroresistance in C. parapsilosis blood isolates.
a, Micafungin breakthrough BSIs in allo-HCT recipients at the MSKCC between days 0 and 30 after transplantation (between January 2016 and December 2020). The ‘others’ category includes four episodes of breakthrough BSI by Candida kefyr, Trichosporon asahii, Capronia munkii and S. cerevisiae. b, Micafungin Etest results of two representative C. parapsilosis isolates, MSK65 (heteroresistant) and MSK804 (susceptible). ch, Population-level responses of MSK65 and MSK804 to micafungin. c,f, Micafungin PAPs of isolates MSK65 (c) and MSK804 (f). Percent survival was calculated compared to growth on drug-free agar. d,g, Colony-forming unit (CFU) dynamics of total and resistant subpopulations of MSK65 (d) and MSK804 (g) in YPD broth containing 2 μg ml−1 micafungin. Cultures were plated at the indicated time points for enumeration of total (circles) and resistant (squares) cells. e,h, Frequency of the micafungin-resistant subpopulation of isolates MSK65 (e) and MSK804 (h) during continuous passage. The frequency was calculated after a 24-h culture in drug-free YPD broth (pretreatment), followed by passaging in YPD broth with 2 μg ml–1 micafungin (in micafungin) for 48 h, and a second passage in drug-free YPD broth for 72 h (subculture). Bar height, mean; error bar, s.d. of technical replicates, n = 3. i, Graphical illustration of the dynamics of the resistant subpopulation in a micafungin-heteroresistant isolate in the presence or absence of micafungin. Blue cells are susceptible, orange cells are resistant (unstable), and gray cells are those killed by micafungin.
Fig. 2 |
Fig. 2 |. Micafungin heteroresistance and risk of breakthrough C. parapsilosis BSIs in allo-HCT recipients.
a, Flow chart showing the number of allo-HCT recipients at the MSKCC (2016–2020) with C. parapsilosis intestinal colonization, the number colonized with one or more micafungin-heteroresistant isolates, the number colonized only with susceptible isolates (no heteroresistant isolate identified) and the number of breakthrough BSIs in each group. b, Fisher’s exact test (two-sided) on patients with micafungin-heteroresistant C. parapsilosis intestinal colonization and breakthrough BSI. c, Comparative genomic analysis between fecal and blood C. parapsilosis isolates. Longitudinal medical data are shown to the left for five allo-HCT recipients with C. parapsilosis breakthrough BSIs, including antifungal drug administration (first row), the time and drug susceptibility of blood isolate(s) (second row) and the time of fecal sample collection and the drug susceptibility of the corresponding fecal isolate (third row). Pairwise popANI values between blood (star) and fecal (circle) C. parapsilosis isolates are shown in a heatmap to the right of the medical data. At a cutoff of 99.999%, red colors indicate ‘identical’ isolates, and blue colors indicate ‘distinct’ isolates. The gray dashed line on the diagonal indicates self-comparisons between the same isolates (that is, popANI = 100%). Patient 1 and patient 2 in this figure were patient 2 and patient 3, respectively, in a previous study.
Fig. 3 |
Fig. 3 |. Phylogenetic tree of 219 C. parapsilosis isolates collected from three continents.
The outer circle indicates the micafungin susceptibility phenotype of each isolate.
Fig. 4 |
Fig. 4 |. Top C. parapsilosis genomic features associated with micafungin heteroresistance.
a, Volcano plot of 6,806 C. parapsilosis genomic features. P values were obtained using the two-sided Wald test followed by Bonferroni multiple correction. b, Top two features positively and negatively associated with micafungin heteroresistance and annotations of the ORFs that contain the four features. Distribution of the features were plotted in alignment with the phylogenetic tree. Chromosome locations: feature 4376, chromosome 2; feature 2154, chromosome 6; feature 3654, chromosome 8; feature 2520, chromosome 1. GPI, glycosylphosphatidylinositol.
Fig. 5 |
Fig. 5 |. Evaluation of machine learning model performance in predicting the micafungin heteroresistance phenotype.
F1 score is an evaluation metric that combines precision and recall. Unless specified otherwise, all models selected features from a combined pool of SNV, indel and CNV features. In all box plots, each dot represents a single train–test split, which was randomly repeated 50 times. P values were obtained using the two-sided paired-sample t-test. a, Machine learning models constructed by choosing among three feature-selection algorithms (logistic regression (LOGIT), LASSO, ENNS) and two classifiers (RF, XGBoost). Exact P values for the comparison between the best combination (logistic regression and XGBoost) and all other combinations: ENNS and XGBoost (0.006), LASSO and RF (0.002), LASSO and XGBoost (0.006), ENNS and RF (0.367), LOGIT and RF (0.544). b, Comparison of the best-performing combination (LOGIT and XGBoost) with alternative models. R1, R2 and R3 represent three repeats of retrained LOGIT–XGBoost models using randomly shuffled heteroresistance data. Exact P values for the comparison between LOGIT–XGBoost and the alternative models R1, R2 and R3 are 3.6 × 10⁻¹⁸, 3.5 × 10⁻²⁰ and 3.7 × 10⁻²¹, respectively. The average nucleotide identity (ANI)-based model quantifies genomic similarity between isolates by popANI and assigns a test isolate the same heteroresistance label as its genomically closest isolate in the training set. The phylogeny-based model places test isolates into a reconstructed phylogeny of training isolates and then performs hidden state prediction. Two-sided paired-sample t-test: exact P values are provided.

References

    1. Antimicrobial Resistance Collaborators. Global burden of bacterial antimicrobial resistance in 2019: a systematic analysis. Lancet 399, 629–655 (2022). - PMC - PubMed
    1. Berman J. & Krysan DJ Drug resistance and tolerance in fungi. Nat. Rev. Microbiol 18, 319–331 (2020). - PMC - PubMed
    1. Andersson DI, Nicoloff H. & Hjort K. Mechanisms and clinical relevance of bacterial heteroresistance. Nat. Rev. Microbiol 17, 479–496 (2019). - PubMed
    1. El-Halfawy OM & Valvano MA Antimicrobial heteroresistance: an emerging field in need of clarity. Clin. Microbiol. Rev 28, 191–207 (2015). - PMC - PubMed
    1. Band VI & Weiss DS Heteroresistance: a cause of unexplained antibiotic treatment failure? PLoS Pathog. 15, e1007726 (2019). - PMC - PubMed

MeSH terms

LinkOut - more resources