. 2024 Aug 2;7(1):932.
doi: 10.1038/s42003-024-06606-7.

Glucosylceramide synthase modulation ameliorates murine renal pathologies and promotes macrophage effector function in vitro

Affiliations

Glucosylceramide synthase modulation ameliorates murine renal pathologies and promotes macrophage effector function in vitro

Agnes Cheong et al. Commun Biol. .

Abstract

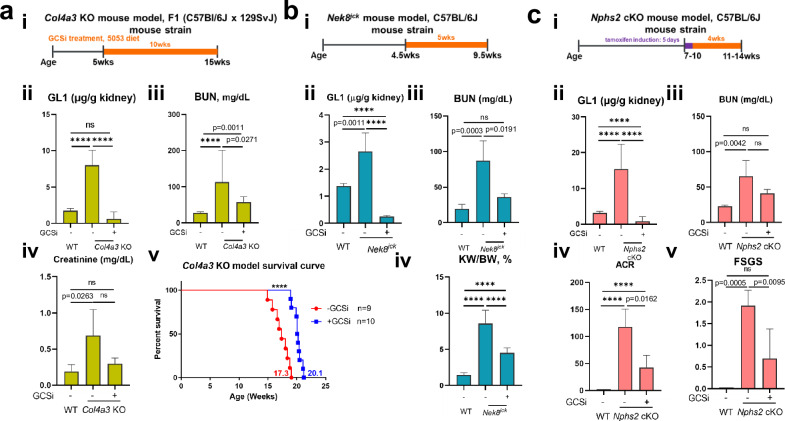
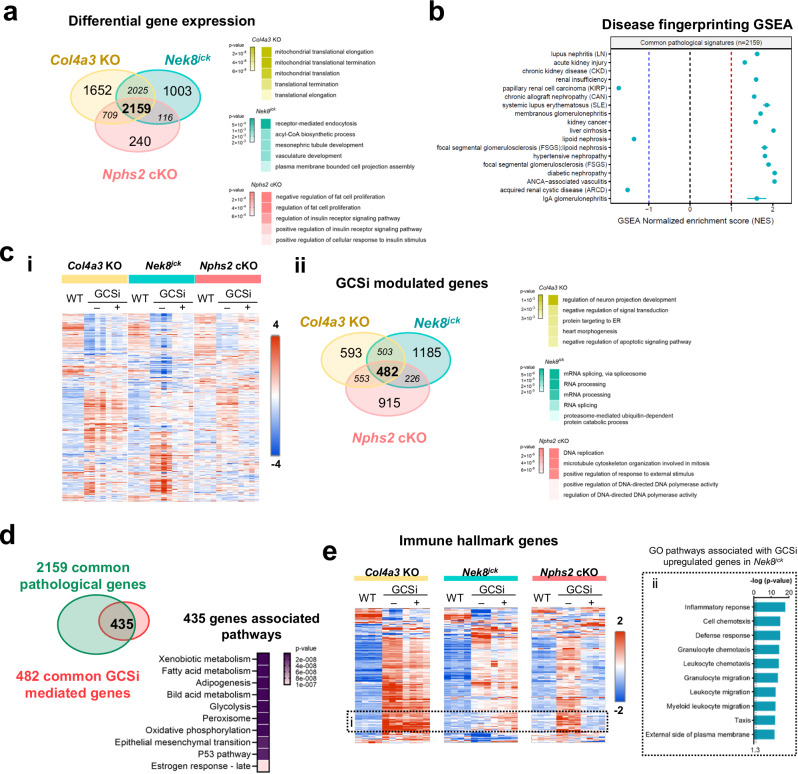
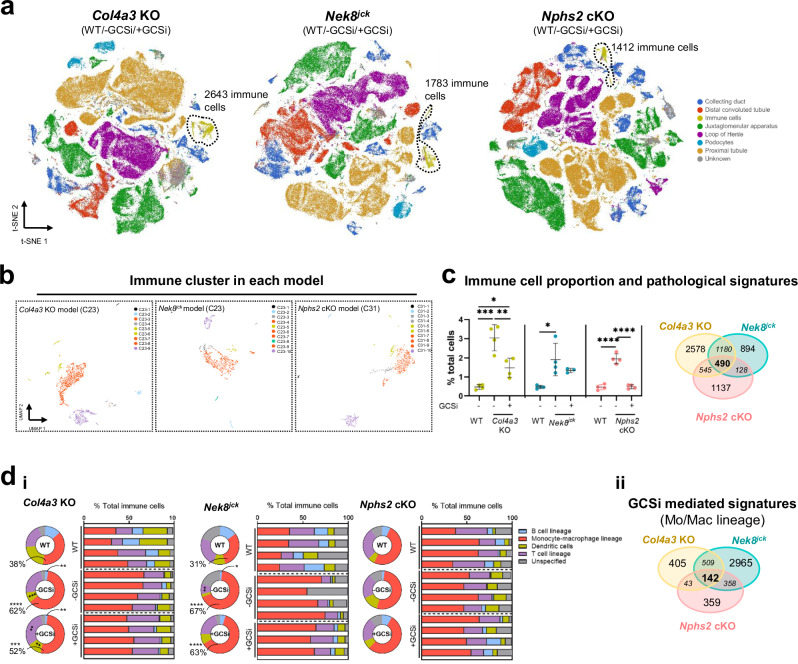
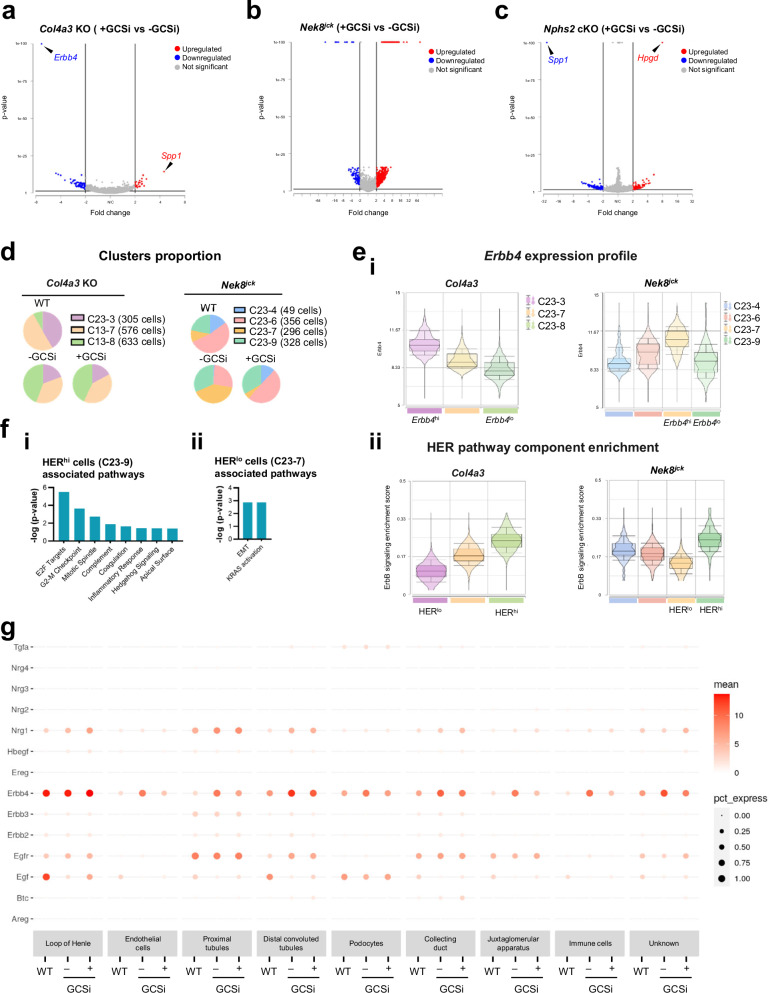
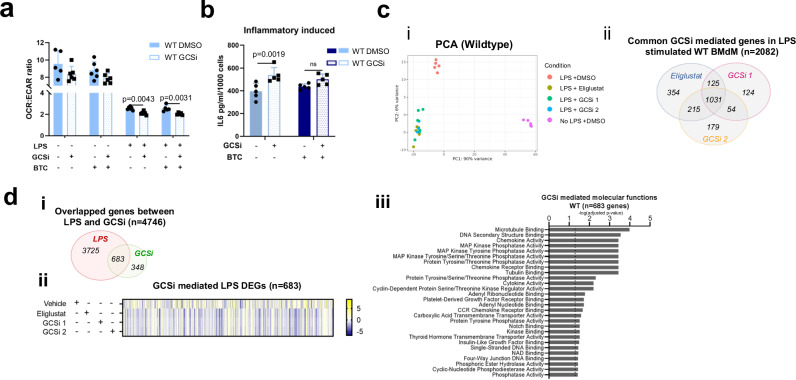
While significant advances have been made in understanding renal pathophysiology, less is known about the role of glycosphingolipid (GSL) metabolism in driving organ dysfunction. Here, we used a small molecule inhibitor of glucosylceramide synthase to modulate GSL levels in three mouse models of distinct renal pathologies: Alport syndrome (Col4a3 KO), polycystic kidney disease (Nek8jck), and steroid-resistant nephrotic syndrome (Nphs2 cKO). At the tissue level, we identified a core immune-enriched transcriptional signature that was shared across models and enriched in human polycystic kidney disease. Single nuclei analysis identified robust transcriptional changes across multiple kidney cell types, including epithelial and immune lineages. To further explore the role of GSL modulation in macrophage biology, we performed in vitro studies with homeostatic and inflammatory bone marrow-derived macrophages. Cumulatively, this study provides a comprehensive overview of renal dysfunction and the effect of GSL modulation on kidney-derived cells in the setting of renal dysfunction.


Conflict of interest statement

A.C., F.C., H.H, J.E., L.G., M.G., L.A.S., J.B., S.L., M.Z., A.S.B., W. Q., A.M., T.I, C.C., S.K., and D.O. are employees of Sanofi. J.G. is a former employee of Sanofi and is currently employed by Cellarity. N.K. is a former employee of Sanofi and is currently employed by Keros Therapeutics. S.M. is a former employee of Sanofi and is currently employed by MiMedx. J.S. is a former employee of Sanofi and is currently employed by Takeda Pharmaceuticals. Y.C.C. is a former employee of Sanofi and is currently employed by Laronde. T.A.N. is a former employee of Sanofi and is currently employed by Dyne Therapeutics. O.I.B. is a former employee of Sanofi and is currently employed by Dyne Therapeutics. J.D.P. is a former employee of Sanofi and is currently employed by Neurocrine Biosciences.

Figures

Fig. 1
Fig. 1. GL1 reduction preserves renal function parameters in the disease models.
ac (i) Schematic of the study design. The age at which the GCSi treatment was administered and the treatment length of the Col4a3 KO, Nek8jck, and Nphs2 cKO models are indicated. “wks” denotes weeks. (ii) GL1 level and (iii) serum blood urea nitrogen (BUN) levels measured in wildtype group, disease group (−GCSi), and GCSi treated (+GCSi) group across all models. GL1 levels are reflected as microgram (μg) of GL1 per gram (g) of kidney tissues. a, iv Serum creatinine levels at wk 14 and (a, v) survival curve of Col4a3 KO model. b, iv Total kidney to body weight ratio measured in Nek8jck model. c, iv Albumin to creatinine ratio (ACR) in urine and (c, v) focal segmental glomerulosclerosis (FSGS) scoring from Nphs2 cKO model. Data are expressed as mean ± standard deviation. Statistical significance was analyzed using one-way ANOVA (Tukey’s test), Welch one-way ANOVA (b, iv), or (a, v) Log-rank (Mantel–Cox) test. **** denotes p < 0.0001. Data on additional cohorts and corresponding dot plots are shown in Fig. S1.
Fig. 2
Fig. 2. GCSi treatment modulates the global transcriptomic level of each kidney disease models.
a Venn diagram depicting the overlap of pathological gene signatures (fold change ≥ ± 1.5, p < 0.05). b Gene-set enrichment analysis (GSEA) of murine common pathological signatures in human disease datasets. c, i Heatmap from bulk RNA-sequencing analysis showing distinct transcriptomic profiles of the Col4a3 KO, Nek8jck, and Nphs2 cKO models (n = 4 per model). Color key corresponds to z score. c, ii Common genes that are mediated by GCSi treatment across all the models and pathways associated with model-specific signatures. d Venn diagram depicting the overlap of common pathological gene signatures (green) and GCSi responsive genes (red) and the hallmark pathways associated with the overlap signatures. e Heatmap of the immune hallmark genes in each disease model (see supplementary data 5 for complete gene list). Two animals were identified as outliers, see Methods for details (n = 4 animals for each conditions in all models except n = 3 animals in Col4a3 KO disease group and n = 3 animals in Nek8jck disease group). Color key corresponds to z score. e, i The distinct GCSi-mediated upregulated genes (n = 23) in the Nek8jck model are highlighted in the enclosed dotted box, and (ii) the associated top 10 GO pathways.
Fig. 3
Fig. 3. GCSi treatment modulates the immune cell populations in the disease models.
a tSNE plot of the Col4a3 KO, Nek8jck, and Nphs2 cKO models. Clusters are depicted by colors, refer to Fig. S2 for cluster distribution across the genotypes. Immune clusters are highlighted in the enclosed dotted line circle. b Sub-clustering of the immune cluster in each model. Col4a3 KO (2643 cells): stellate-like cells: C23-1; B cells: C23-2; monocyte-macrophage lineage: C23-3, 7, 8; dendritic cells: C23-5, 6; T cells: C23-9; Unspecified: C23-4. Nek8jck (1783 cells): stellate-like cells C23-1; B cells: C23-2; monocyte-macrophage lineage: C23-4, 6, 7, 9; dendritic cells: C23-5; T cells: C23-10; Unspecified: C23-3. Nek8jck C13-8 was excluded from monocyte-macrophage lineage analysis as this cluster was only identified from one animal. Nphs2 cKO (1412 cells): stellate cells: C31-1; B cells: C31-2; monocyte-macrophage lineage: C31-7, 8, 9; dendritic cells: C31-5, 6; T cells: C31-10; Unspecified: C31-3, 4. Ugcg expression within each subtype can be found in Fig. S5. c Immune cell population inferred by single nuclei RNA seq data across the three different disease models, and Venn diagram of the differentially expressed genes within the immune cluster in each model (|fold change| = 1.2, p value < 0.05). d, i Immune cell composition in each model. Refer to supplementary data 6 for the percentages of immune cell type composition. d, ii Venn diagram depicting the GCSi mediated signatures in mo/mac lineage of each model (|fold change|= 1.2, p-value < 0.05). Asterisk (*) denotes the statistical significance between the disease or GCSi-treated group and its corresponding wildtype control. Statistical significance was analyzed using (b, c) one-way ANOVA (Tukey’s test) and d two-way ANOVA (Tukey’s test). b, d * denotes p < 0.05; ** denotes p < 0.005; *** denotes p < 0.0005; and **** denotes p < 0.0001. Only myeloid, lymphoid, and tissue-resident phagocytic cells are included in the immune cell cluster.
Fig. 4
Fig. 4. GCSi treatment impacts HER signaling cascade in kidney macrophages.
ac Differentially expressed genes following GCSi treatment in the monocyte-macrophage population of (a) Col4a3 KO, (b) Nek8jck, and (c) Nphs2 cKO models. Down-regulated genes are highlighted in blue, and Upregulated genes are highlighted in red. Top 50 up- and downregulated genes are listed in supplementary data 7. d Proportion of cell clusters within the monocyte-macrophage lineage in Nek8jck and Col4a3 KO models. e, i Erbb4 expression profile and (e, ii) enrichment score analysis of HER signaling within this lineage. The box plots denote median, maximum, and minimum. Ranking of HER enrichment score is displayed as high (hi) and low (lo). f MSigDB hallmark pathways that are associated with (i) HERhi and (ii) HERlo monocyte-macrophage lineage clusters in Nek8jck model. g The expression levels of HER signaling-related genes in each kidney cell type identified in the Nek8jck model. HER receptors: Egfr, Erbb2, Erbb3, and Erbb4. HER ligands: Areg, Btc, Egf, Ereg, HbEgf, Nrg1, Nrg2, Nrg3, Nrg4, and Tgfα. Areg Amphiregulin, Btc Betacellulin, Egf Epidermal growth factor, Ereg epiregulin, HbEgf Heparin-binding EGF-like growth factor, Nrg Neuregulin and Tgfα Transforming growth factor alpha. EMT epithelial to mesenchymal transition. pct_express percent expressing.
Fig. 5
Fig. 5. GCSi treatment has a divergent effect on metabolic reliance in non-inflammatory and inflammatory-induced BM macrophages.
a The ratio of OCR to ECAR was determined in wild-type BM macrophages in vitro under different conditions (n ≥ 3). b IL6 secretion in LPS-induced wildtype BM macrophages following GCSi treatment and subsequent BTC stimulation (n = 5). Results are from at least 3 independent experiments. c PCA plot of the WT BM macrophages sequencing data. Depicted are replicates of each condition: GCSi treated groups under LPS stimulated condition and GCSi treated groups under basal condition. Common genes mediated by LPS in wild-type BM macrophages that are shared across all the groups (each group has at least 3 independent biological replicates). d, i Venn diagram of the differentially expressed genes mediated by Eliglustat, GCSi 1 or GCSi 2 in LPS stimulated WT BM macrophages and (ii) the heatmap representing the overlap gene signatures between the LPS DEGs (LPS-stimulated vehicle group vs unstimulated vehicle group) and GCSi mediated signatures (log2 fold-change: 0.585; adjusted p value < 0.05). d, iii Cellular functions regulated by Eliglustat, GCSi 1, and GCSi 2 in LPS-stimulated WT BM macrophages. Data are expressed as mean ± standard deviation. a, b Two-way ANOVA was performed for statistical analysis.

References

    1. Romagnani, P. Chronic kidney disease. Nat. Rev.3, 17088 (2017). - PubMed
    1. Zhang, T., de Waard, A. A., Wuhrer, M. & Spaapen, R. M. The role of glycosphingolipids in immune cell functions. Front. Immunol.10, 90 (2019). 10.3389/fimmu.2019.00090 - DOI - PMC - PubMed
    1. D'Angelo, G., Capasso, S., Sticco, L. & Russo, D. Glycosphingolipids: synthesis and functions. FEBS J.280, 6338–6353 (2013). 10.1111/febs.12559 - DOI - PubMed
    1. Zhu, Y. et al. Lowering glycosphingolipid levels in CD4+ T cells attenuates T cell receptor signaling, cytokine production, and differentiation to the Th17 lineage. J. Biol. Chem.286, 14787–14794 (2011). 10.1074/jbc.M111.218610 - DOI - PMC - PubMed
    1. Tsai, B., Gilbert, J. M., Stehle, T. & Lencer, W. Gangliosides are receptors for murine polyoma virus and SV40. EMBO J.22, 4346–4355 (2003). 10.1093/emboj/cdg439 - DOI - PMC - PubMed

Publication types

Substances

LinkOut - more resources