. 2024 Aug 2;21(1):191.
doi: 10.1186/s12974-024-03154-z.

Targeting the immunoproteasome in hypothalamic neurons as a novel therapeutic strategy for high-fat diet-induced obesity and metabolic dysregulation

Affiliations

Targeting the immunoproteasome in hypothalamic neurons as a novel therapeutic strategy for high-fat diet-induced obesity and metabolic dysregulation

Nicolás Albornoz et al. J Neuroinflammation. .

Abstract

Objective: Obesity represents a significant global health challenge characterized by chronic low-grade inflammation and metabolic dysregulation. The hypothalamus, a key regulator of energy homeostasis, is particularly susceptible to obesity's deleterious effects. This study investigated the role of the immunoproteasome, a specialized proteasomal complex implicated in inflammation and cellular homeostasis, during metabolic diseases.

Methods: The levels of the immunoproteasome β5i subunit were analyzed by immunostaining, western blotting, and proteasome activity assay in mice fed with either a high-fat diet (HFD) or a regular diet (CHOW). We also characterized the impact of autophagy inhibition on the levels of the immunoproteasome β5i subunit and the activation of the AKT pathway. Finally, through confocal microscopy, we analyzed the contribution of β5i subunit inhibition on mitochondrial function by flow cytometry and mitophagy assay.

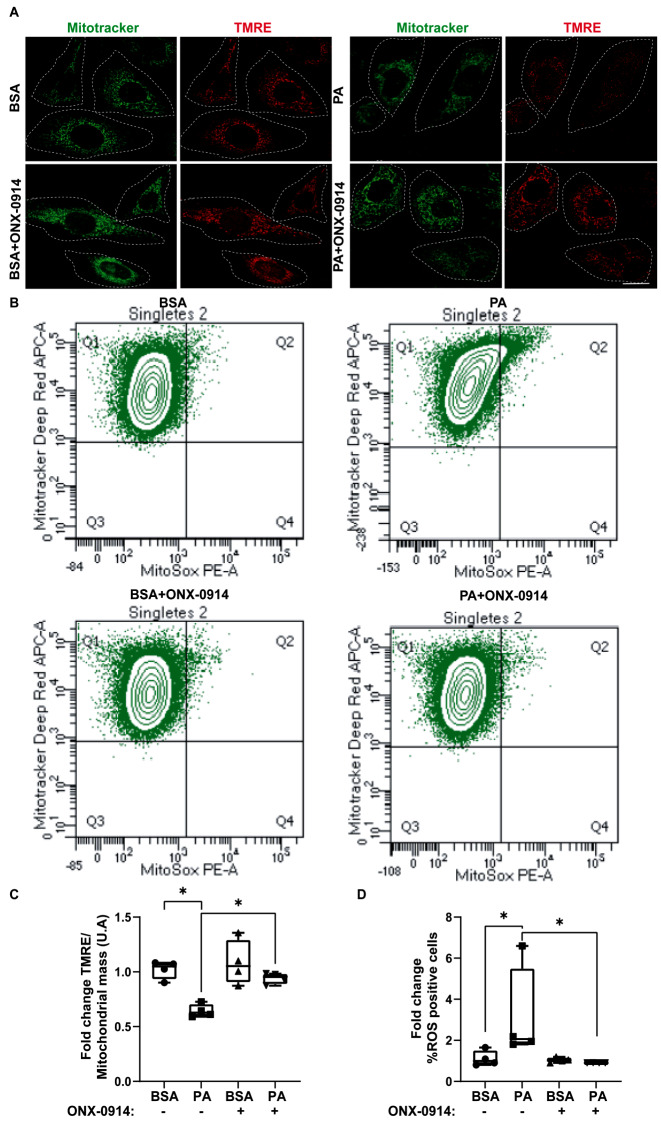
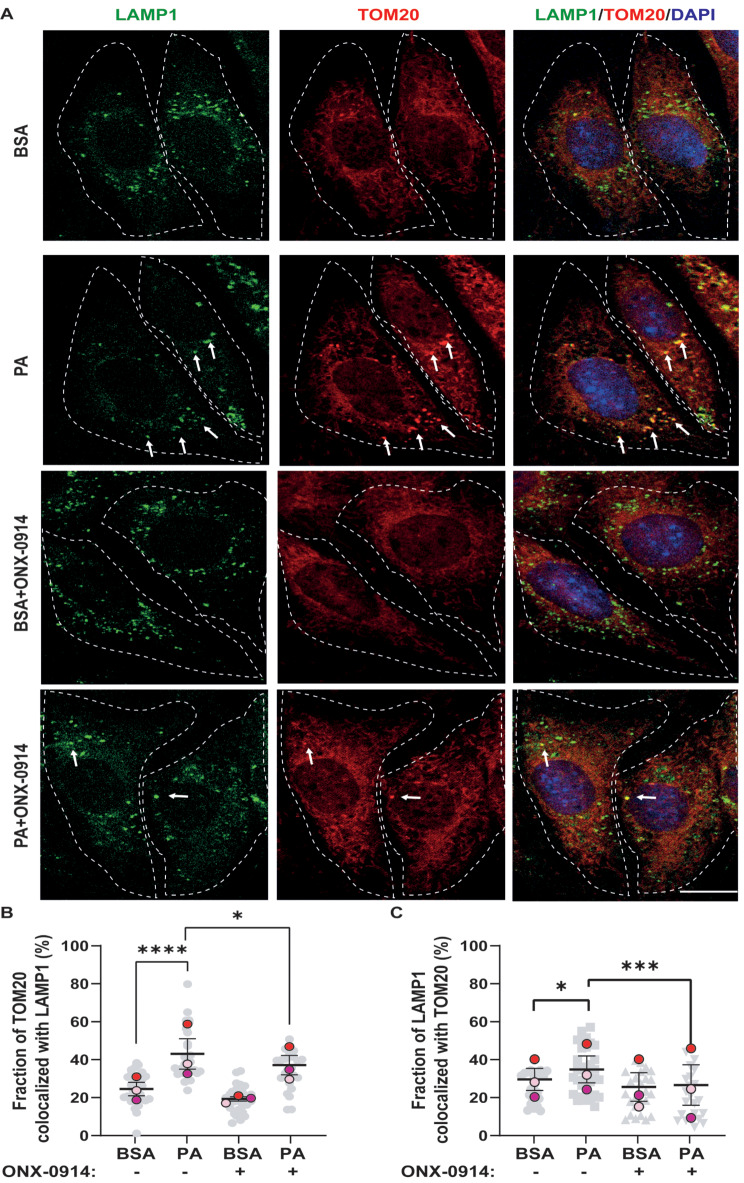
Results: Using an HFD-fed obese mouse model, we found increased immunoproteasome levels in hypothalamic POMC neurons. Furthermore, we observed that palmitic acid (PA), a major component of saturated fats found in HFD, increased the levels of the β5i subunit of the immunoproteasome in hypothalamic neuronal cells. Notably, the increase in immunoproteasome expression was associated with decreased autophagy, a critical cellular process in maintaining homeostasis and suppressing inflammation. Functionally, PA disrupted the insulin-glucose axis, leading to reduced AKT phosphorylation and increased intracellular glucose levels in response to insulin due to the upregulation of the immunoproteasome. Mechanistically, we identified that the protein PTEN, a key regulator of insulin signaling, was reduced in an immunoproteasome-dependent manner. To further investigate the potential therapeutic implications of these findings, we used ONX-0914, a specific immunoproteasome inhibitor. We demonstrated that this inhibitor prevents PA-induced insulin-glucose axis imbalance. Given the interplay between mitochondrial dysfunction and metabolic disturbances, we explored the impact of ONX-0914 on mitochondrial function. Notably, ONX-0914 preserved mitochondrial membrane potential and attenuated mitochondrial ROS production in the presence of PA. Moreover, we found that ONX-0914 reduced mitophagy in the presence of PA.

Conclusions: Our findings strongly support the pathogenic involvement of the immunoproteasome in hypothalamic neurons in the context of HFD-induced obesity and metabolic disturbances. Targeting the immunoproteasome highlights a promising therapeutic strategy to mitigate the detrimental effects of obesity on the insulin-glucose axis and cellular homeostasis. This study provides valuable insights into the mechanisms driving obesity-related metabolic diseases and offers potential avenues for developing novel therapeutic interventions.

Keywords: Autophagy; Hypothalamus; Immunoproteasome; Insulin-glucose axis; Metabolic disturbances; Mitochondrial function; Neurons; Obesity; Redox biology.


Conflict of interest statement

The authors declare no competing interests.

Figures

Fig. 1
Fig. 1
Consumption of an HFD increases the levels of immunoproteasome in hypothalamic astrocytes and POMC neurons (A) Protein extracts from hypothalamic lysates of male mice fed with chow or HFD for 16 weeks were analyzed by western blot to evaluate the total levels of β5i and β5 subunits. β-actin was used as internal control. Quantification of β5i (B) and β5 (C) levels normalized to β-actin. (D) Representative native western blot showing the subunits RPN-11 and β5i levels incorporated into the 20 S, 26 S, and 30 S of the immunoproteasome. The RPN11 subunit of the 19 S regulatory particle (green) and β5i subunit of the 20 S complex (red) were analyzed from hypothalamic lysates of male mice fed either with chow or HFD for 16 weeks. Quantification of the β5i levels incorporated to the 20 S (E), 26 S (F), and 30 S (G) complexes is shown. (H) Activity of the β5i subunit incorporated into the 26–30 S complex was measured in native gels using the fluorescent substrate Ac-ANW-AMC in hypothalamic lysates from male mice fed either with chow or HFD diet for 16 weeks. Quantification of the activity of the 26 S and 30 S complexes is shown in (I) and (J), respectively. Data are represented as mean ± SEM. Analysis: Mann-Whitney test. *p < 0.05, n = 4
Fig. 2
Fig. 2
HFD feeding increases the levels and activity of the immunoproteasome in the hypothalamus (A) Schematic representation of a coronal section of the brain showing the location of the arcuate nucleus, where the confocal images of mice fed with chow or HFD were obtained. (B) Immunofluorescence using anti-β5i antibodies (red) and DAPI as a nuclei marker (blue). (C) Quantification of total fluorescence of the β5i subunit in all parenchyma of the hypothalamus. (D) Co-immunostaining using anti-β5i antibodies (red, left panel), anti-GFAP (green, middle panel), and merge image (right panel), including nuclear staining with DAPI (blue). (E) Quantification of total fluorescence of the β5i subunit in segmented GFAP-positive astrocytes. (F) Immunostaining using anti-β5i (red, left panel), POMC-GFP (green, middle panel), and composite image (right panel), including nuclear staining with DAPI (blue) Scale bar: 50 μm. (G) Quantification of percentage of POMC neurons segmented to B5i neurons. (A, C, E) shows a 4X magnification of the area indicated in the white dashed-line box projected in the lower-right inset. Scale bar: 15 μm. Data are represented as mean fluorescence intensity/cell ± SEM. Analysis: U-Mann-Whitney test. *p < 0.05, **p < 0.01, ***p < 0.001, ****p < 0.0001. n = 4
Fig. 3
Fig. 3
Inhibition of autophagy increases the β5i subunit of the immunoproteasome in CLU177 hypothalamic neuronal cells (A) CLU177 cells were incubated with vehicle (BSA) or PA (100 µM) for 24 h. Protein extracts were analyzed by western blot to assess the levels of the β5i subunit of the immunoproteasome, β5 subunit of the proteasome, and p62/SQSTM1. (B) Quantification of β5i subunit levels normalized to the internal control β-actin. (C) Quantification of β5 subunit levels normalized to the internal control β-actin. (D) CLU177 cells were transfected for 72 h with liposomes containing specific siRNA sequences targeting Beclin1 and FIP200, including a siControl sequence. Extracts were analyzed by western blot to assess the levels of the β5i subunit of the immunoproteasome and the silenced proteins FIP200 and Beclin1. (E) Quantification of β5i subunit levels in CLU177 relative to the internal control β-actin with the indicated treatments. Data are represented as mean ± SEM. Analysis: U-Mann-Whitney test. *p < 0.05. B and D (n = 5) and C (n = 3)
Fig. 4
Fig. 4
ONX-0914 attenuates the PA-induced reduction in PTEN levels and insulin sensitivity in CLU177 (A) CLU177 cells were incubated with vehicle (BSA) or PA (100 µM) for 24 h in the presence or absence of 100 nM ONX-0914. Protein extracts were analyzed by western blot to evaluate the levels of p-AKT(Ser-473) and total AKT. (B) Quantification of the P-AKT/AKT(S-473) ratio normalized to the internal control β-actin. (C) Intracellular glucose levels measured by AmpliRed Glucose/Glucose Oxidase assay in CLU177 cells treated with vehicle (BSA) or PA (100 µM) for 24 h in the presence or absence of ONX-0914, followed by stimulation with 10 nM insulin or PBS 1X (vehicle) for 5 or 15-min. (D) Protein extracts were analyzed by western blot to assess the levels of the β5i subunit of the immunoproteasome, PTEN, and p62/SQSTM1. (E) Quantification of PTEN levels normalized to the internal control β-actin. Data are represented as mean ± SEM. Analysis: U-Mann-Whitney test. *p < 0.05. (B and E) n = 5 and (C) n = 3.
Fig. 5
Fig. 5
ONX-0914 reverses the decrease in mitochondrial membrane potential and increase in ROS induced by PA (A) Representative image of mitochondrial membrane potential labeled with TMRE probe (red) and mitochondria labeled with Mitotracker probe (green) in CLU177 cells treated with BSA or PA (100 µM) in the presence or absence of ONX-0914 for 24 h. (B) Flow cytometry to detect changes in Mitosox-Red for ROS measurement together with Mitotracker-Deep Red for mitochondrial mass measurement. (C) Quantification of TMRE fluorescence intensity normalized to the amount of Mitotracker via flow cytometry. (D) Quantification of Mitosox fluorescence intensity (ROS) via flow cytometry. Data are represented as mean ± SEM. Scale bar = 10 μm. Analysis: U-Mann-Whitney test. *p < 0.05. n = 4
Fig. 6
Fig. 6
ONX-0914 reduces the co-localization of TOM20 with LAMP1 increased by PA treatment (A) Representative confocal image of CLU177 cells treated with BSA or PA (100 µM) in the presence or absence of ONX-0914 for 24 h and co-stained with anti-TOM20 antibodies (Red, left panel), anti-LAMP1 antibodies (Green, middle panel), and composite image with DAPI (Blue, right panel). (B) % co-localization between TOM20 and LAMP1 according to Manders’ coefficient analysis. (C) % co-localization between LAMP1 and TOM20 according to Manders’ coefficient analysis. Scale bar = 10 μm. Data are represented as mean ± SEM. Analysis: ONE-WAY ANOVA test. *p < 0.05, ***p < 0.001, ****p < 0.0001. n = 3
Fig. 7
Fig. 7
ONX-0914 Reverses Mitophagy Induced by PA treatment (A) Representative confocal images of CLU177 cells treated with BSA or PA in the presence or absence of ONX-0914 for 24 h and transfected with mt-Keima were excited by the 440 and 586 nm laser. (B) Quantification of the number of acid puncta per cell (C) Schematic depiction of the ratiometric mitophagy reporter mt-Keima. Scale bar = 10 μm. Data are represented as mean ± SEM. Analysis: ONE-WAY ANOVA test. *p < 0.05, ***p < 0.001, ****p < 0.0001. n = 3

References

    1. Qiu T, et al. Obesity-induced elevated palmitic acid promotes inflammation and glucose metabolism disorders through GPRs/NF-κB/KLF7 pathway. Nutr Diabetes. Apr. 2022;12(1):23. 10.1038/s41387-022-00202-6. - PMC - PubMed
    1. von Frankenberg AD, Marina A, Song X, Callahan HS, Kratz M, Utzschneider KM. A high-fat, high-saturated fat diet decreases insulin sensitivity without changing intra-abdominal fat in weight-stable overweight and obese adults. Eur J Nutr. Feb. 2017;56(1):431–43. 10.1007/s00394-015-1108-6. - PMC - PubMed
    1. Gupte AA et al. Aug., High-fat feeding-induced hyperinsulinemia increases cardiac glucose uptake and mitochondrial function despite peripheral insulin resistance. Endocrinology. 2013;54(8):2650–2662, , 10.1210/en.2012-2272. - PMC - PubMed
    1. Rodriguez-Navas C, Morselli E, Clegg DJ. Sexually dimorphic brain fatty acid composition in low and high fat diet-fed mice. Mol. Metab. Aug 2016;5(8):680–689. 10.1016/j.molmet.2016.06.014. - PMC - PubMed
    1. Meng Q, Cai D. Defective hypothalamic autophagy directs the central pathogenesis of obesity via the IkappaB kinase beta (IKKbeta)/NF-kappaB pathway. J Biol Chem. Sep, 2011;286(7):32324–32332. 10.1074/jbc.M111.254417. - PMC - PubMed