. 2024 Aug 2;23(1):155.
doi: 10.1186/s12943-024-02068-x.

Genome-wide CRISPR screening identifies tyrosylprotein sulfotransferase-2 as a target for augmenting anti-PD1 efficacy

Affiliations

Genome-wide CRISPR screening identifies tyrosylprotein sulfotransferase-2 as a target for augmenting anti-PD1 efficacy

Yumi Oh et al. Mol Cancer. .

Abstract

Background: Immune checkpoint therapy (ICT) provides durable responses in select cancer patients, yet resistance remains a significant challenge, prompting the exploration of underlying molecular mechanisms. Tyrosylprotein sulfotransferase-2 (TPST2), known for its role in protein tyrosine O-sulfation, has been suggested to modulate the extracellular protein-protein interactions, but its specific role in cancer immunity remains largely unexplored.

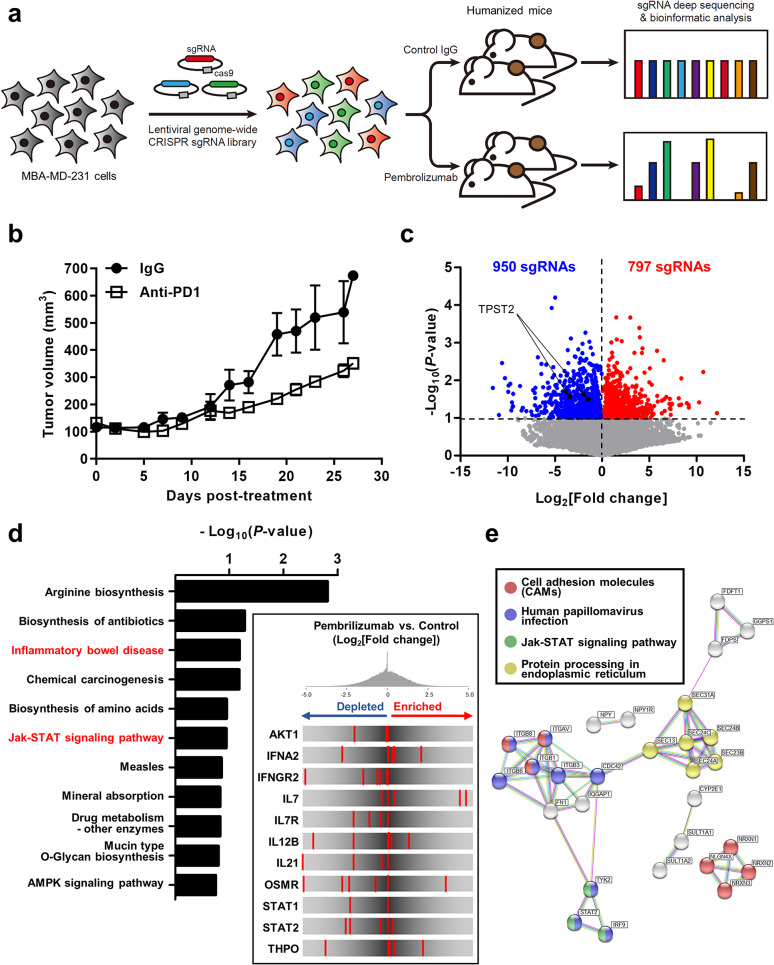
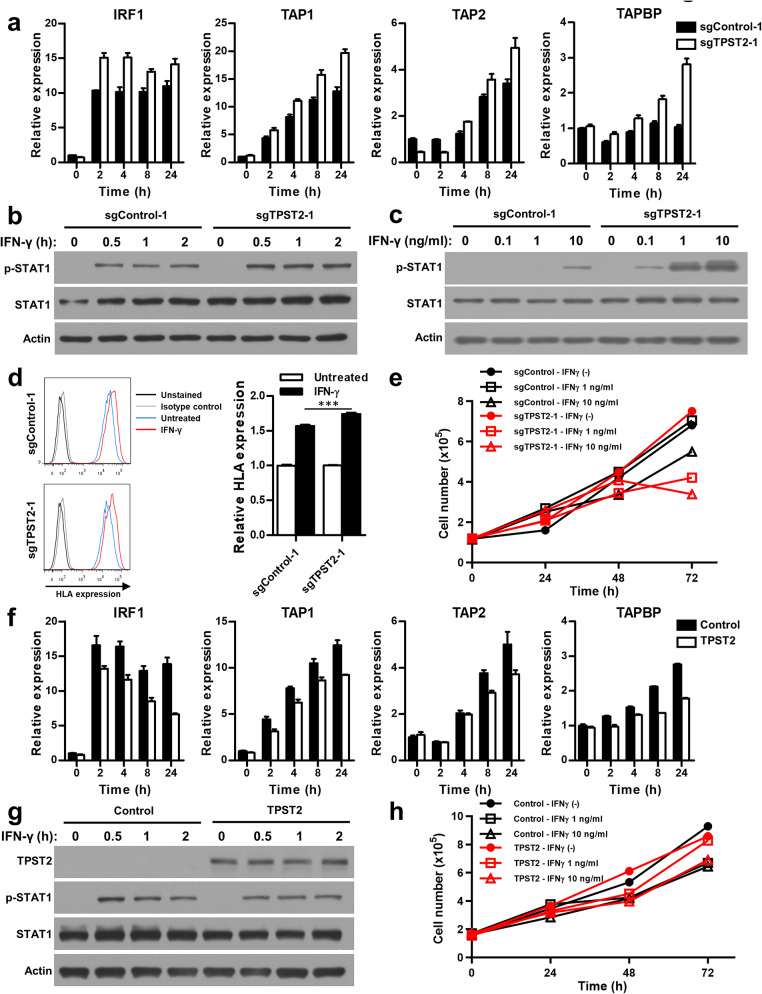
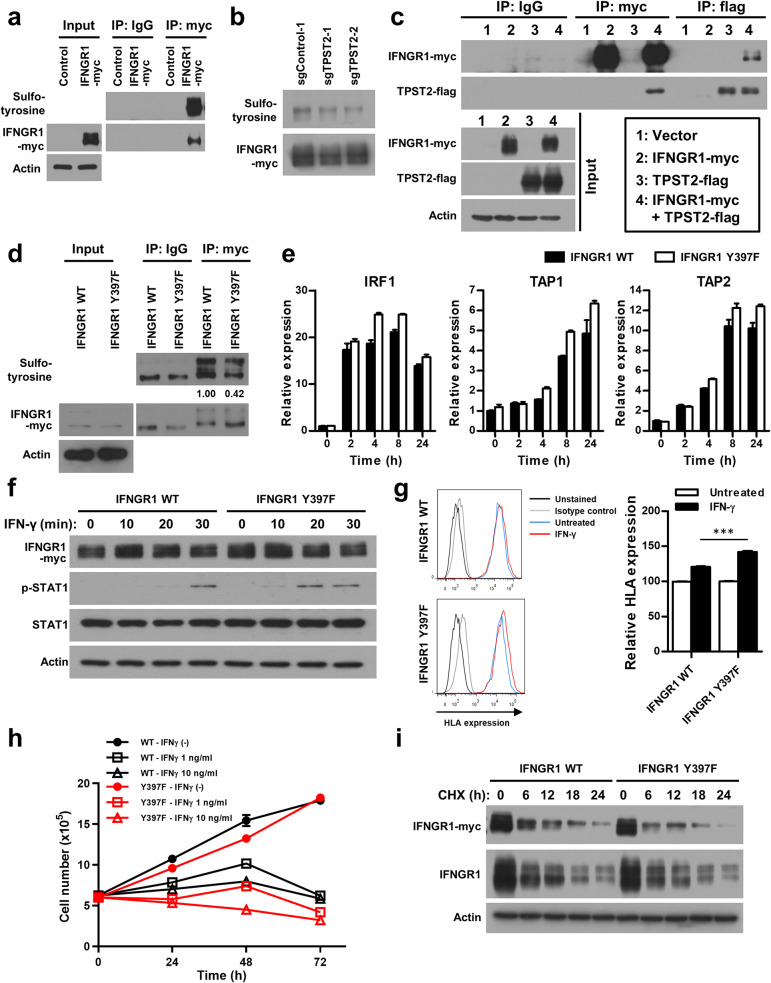
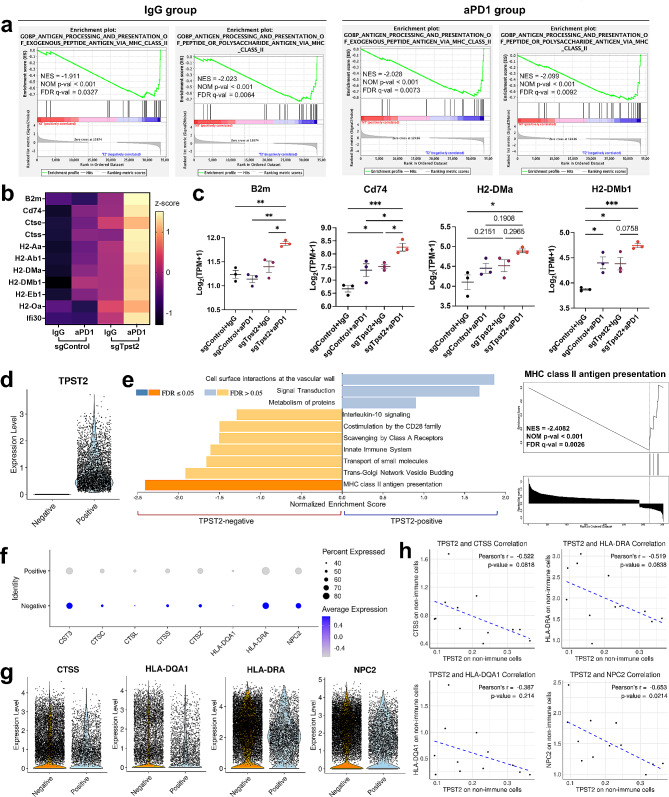
Methods: To explore tumor cell-intrinsic factors influencing anti-PD1 responsiveness, we conducted a pooled loss-of-function genetic screen in humanized mice engrafted with human immune cells. The responsiveness of cancer cells to interferon-γ (IFNγ) was estimated by evaluating IFNγ-mediated induction of target genes, STAT1 phosphorylation, HLA expression, and cell growth suppression. The sulfotyrosine-modified target gene of TPST2 was identified by co-immunoprecipitation and mass spectrometry. The in vivo effects of TPST2 inhibition were evaluated using mouse syngeneic tumor models and corroborated by bulk and single-cell RNA sequencing analyses.

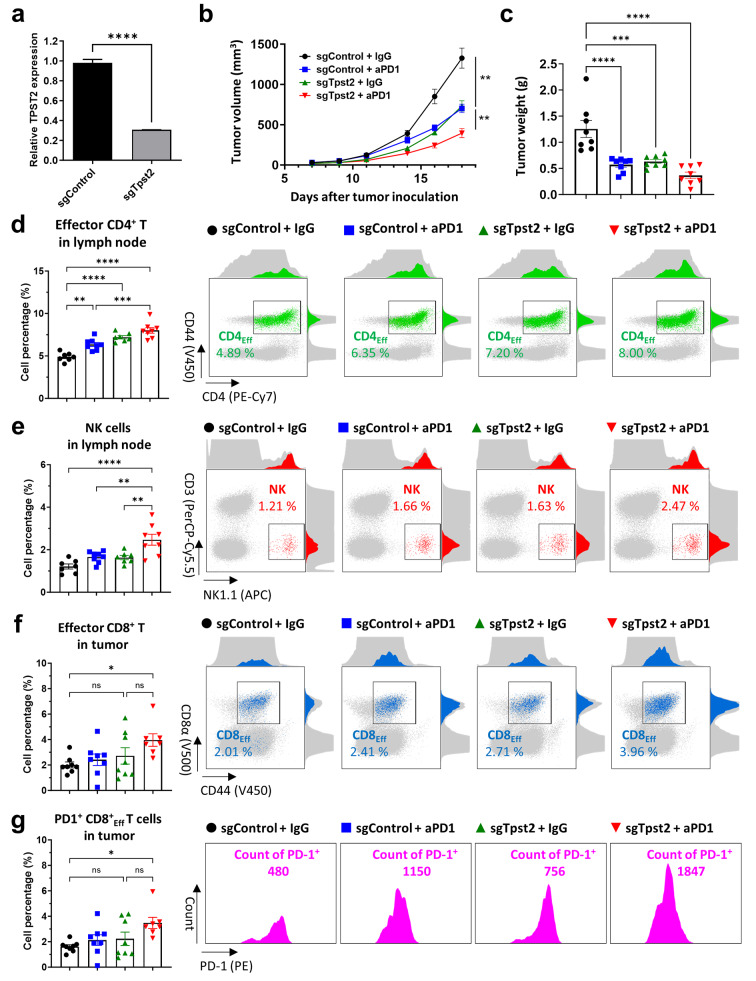
Results: Through in vivo genome-wide CRISPR screening, TPST2 loss-of-function emerged as a potential enhancer of anti-PD1 treatment efficacy. TPST2 suppressed IFNγ signaling by sulfating IFNγ receptor 1 at Y397 residue, while its downregulation boosted IFNγ-mediated signaling and antigen presentation. Depletion of TPST2 in cancer cells augmented anti-PD1 antibody efficacy in syngeneic mouse tumor models by enhancing tumor-infiltrating lymphocytes. RNA sequencing data revealed TPST2's inverse correlation with antigen presentation, and increased TPST2 expression is associated with poor prognosis and altered cancer immunity across cancer types.

Conclusions: We propose TPST2's novel role as a suppressor of cancer immunity and advocate for its consideration as a therapeutic target in ICT-based treatments.

Keywords: Antigen presentation; CRISPR screening; Immune checkpoint therapy; Interferon-γ; Tyrosylprotein sulfotransferase-2.


Conflict of interest statement

The authors declare no competing interests.

Figures

Fig. 1
Fig. 1
In vivo genome-wide CRISPR/Cas9 knockout screening for anti-PD1 responsiveness. a, Schematic of the in vivo genome-wide CRISPR/Cas9 knockout screens to identify genes associated with anti-PD1 responsiveness. MDA-MB-231 cells were infected with the lentivirus with human GeCKO v2 sgRNA library, injected into humanized NOD/SCID/IL-2γ-receptor null (NSG) mice, and treated with control IgG or pembrolizumab. The abundance of each sgRNA in each residual tumor was determined by next-generation sequencing. b, The in vivo efficacy of pembrolizumab in humanized NSG mice with xenografts of MDA-MB-231 cells. The mice were treated with control IgG or pembrolizumab (n = 2, 5 mg/kg, every 5 days) for 27 days, and average tumor sizes for each group are plotted. c, Volcano plot illustrating the relative enrichment of sgRNAs in the genome-wide CRISPR/Cas9 knockout screen for anti-PD1 responsiveness. The combined results of two biological replicates from the screening are represented. Total 950 sgRNAs and 797 sgRNAs were depleted and enriched in anti-PD1-treated tumors (P < 0.1), respectively. d, KEGG pathway analysis of 918 genes, sgRNAs of which were depleted in anti-PD1-treated tumors. The KEGG pathways that were significantly enriched in the 918 genes (P < 0.2) are shown. The inlet represents the rank distribution diagram of sgRNAs targeting genes associated with Jak-STAT signaling pathway from 918 genes. e, STRING network analysis with 22 genes with multiple depleted sgRNAs in anti-PD1-treated mice. Genes involved in each pathway are marked with the corresponding color
Fig. 2
Fig. 2
TPST2-mediated suppression of IFNγ signaling pathway in breast cancer cells. a, Enhanced expression of IFNγ-responsive genes in TPST2-depleted breast cancer cells. TPST2 was knocked down using CRISPR/Cas9 in MDA-MB-231 cells. After serum starvation for 24 h, cells were treated with 10 ng/ml IFNγ and the expression levels of IFNγ-responsive genes were estimated by real-time PCR at indicated time points. b, c, Enhanced phosphorylation of STAT1 in TPST2-depleted breast cancer cells. After serum starvation for 24 h, cells were treated with IFNγ for indicated time (b) and with indicated concentration (c). The phosphorylation levels of STAT1 were evaluated by western blotting. d, Enhanced expression of human leukocyte antigen (HLA) by IFNγ treatment in TPST2-depleted breast cancer cells. After serum starvation for 24 h, cells were treated with 10 ng/ml IFNγ for 24 h and the expression levels of IFNγ-responsive HLA were estimated by flow cytometry. e, Enhanced suppression of cell proliferation by IFNγ treatment in TPST2-depleted breast cancer cells. After serum starvation for 24 h, cells were treated with 1 or 10 ng/ml IFNγ for indicated time points and the cell numbers were estimated by trypan blue staining assay. f, Reduced expression of IFNγ-responsive genes in TPST2-overexpressed breast cancer cells. TPST2 was overexpressed in MDA-MB-231 cells for 24 h. After serum starvation for 24 h, cells were treated with 10 ng/ml IFNγ and the expression levels of IFNγ-responsive genes were estimated by real-time PCR at indicated time points. g, Reduced phosphorylation of STAT1 in TPST2-overexpressed breast cancer cells. After serum starvation for 24 h, cells were treated with 1 ng/ml IFNγ for indicated time. The phosphorylation levels of STAT1 were evaluated by western blotting. h, Reduced suppression of cell proliferation by IFNγ treatment in TPST2-overexpressed breast cancer cells. After serum starvation for 24 h, cells were treated with 1 or 10 ng/ml IFNγ for indicated time points and the cell numbers were estimated by trypan blue staining assay
Fig. 3
Fig. 3
Modulation of IFNγ signaling via TPST2-mediated tyrosine sulfation of IFNγ receptor 1 (IFNGR1) in breast cancer cells. a, Detection of IFNGR1 tyrosine sulfation in MBA-MD-231 breast cancer cells. Myc-tagged IFNGR1 was overexpressed in MBA-MD-231 cells. IFNGR1 was immunoprecipitated by Myc antibody and tyrosine sulfation of IFNGR1 was detected by antibody for sulfotyrosine. b, Reduced sulfotyrosine levels of IFNGR1 in TPST2 knock-down cells. Myc-tagged IFNGR1 was overexpressed in control and TPST2 knock-down MBA-MD-231 cells. IFNGR1 was immunoprecioitated by Myc antibody and tyrosine sulfation of IFNGR1 was detected by antibody for sulfotyrosine. c, Protein-protein interaction between TPST2 and IFNGR1. Flag-tagged TPST2 and/or myc-tagged IFNGR1 was overexpressed in MBA-MD-231 cells. Complex formation of TPST2 and IFNGR1 was evaluated by co-immunoprecipitation of flag-tagged TPST2 and myc-tagged IFNGR1, which was detected by reciprocal immunoprecipitation and western blotting. d, Reduced tyrosine sulfation of mutant IFNGR1. Myc-tagged wild-type and Y397F mutant IFNGR1 was overexpressed in MBA-MD-231 cells. IFNGR1 was immunoprecioitated by Myc antibody and tyrosine sulfation of IFNGR1 was detected by antibody for sulfotyrosine. The relative sulfotyrosine western band intensity was evaluated by image J software and depicted under the sulfotyrosine western data. e, Enhanced expression of IFNγ-responsive genes in mutant IFNGR1-overexpressed breast cancer cells. Wild-type and mutant (Y397F) IFNGR1 were overexpressed in MDA-MB-231 cells for 24 h. After serum starvation for 24 h, cells were treated with 10 ng/ml IFNγ and the expression levels of IFNγ-responsive genes were estimated by real-time PCR at indicated time points. f, Enhanced phosphorylation of STAT1 in mutant IFNGR1-overexpressed breast cancer cells. Wild-type and mutant (Y397F) IFNGR1 were overexpressed in MDA-MB-231 cells for 24 h. After serum starvation for 24 h, cells were treated with IFNγ for indicated time. The phosphorylation levels of STAT1 were evaluated by western blotting. g, Enhanced expression of human leukocyte antigen (HLA) by IFNγ treatment in mutant IFNGR1-overexpressed breast cancer cells. Wild-type and mutant (Y397F) IFNGR1 were overexpressed in MDA-MB-231 cells for 24 h. After serum starvation for 24 h, cells were treated with 10 ng/ml IFNγ for 24 h and the expression levels of IFNγ-responsive HLA were estimated by flow cytometry. h, Enhanced suppression of cell proliferation by IFNγ treatment in mutant IFNGR1-overexpressed breast cancer cells. Wild-type and mutant (Y397F) IFNGR1 were overexpressed in MDA-MB-231 cells for 24 h. After serum starvation for 24 h, cells were treated with 1 or 10 ng/ml IFNγ for indicated time points and the cell numbers were estimated by trypan blue staining assay. i, Protein stability of mutant IFNGR1. Wild-type and mutant (Y397F) IFNGR1 were overexpressed in MDA-MB-231 cells for 24 h. After treatment of cycloheximide (100 µg/ml) to inhibit protein translation, IFNGR1 protein levels of were evaluated by western blotting at indicated time points
Fig. 4
Fig. 4
TPST2 knock-down enhances anti-PD1 efficacy via activating T cell immunity. a, Relative mouse Tpst2 gene expression in control (sgControl) and Tpst2 knock-down MC38 cells (sgTpst2) estimated by RT-PCR. b, Representative control MC38 or Tpst2 knock-down MC38 tumor growth curves with or without anti-PD1; n = 8 mice per group. c, Tumor weight at 18 days after tumor injection in syngeneic mouse model; n = 8 mice per group. d, Percentage of effector CD4+ T cell in tumor-draining lymph nodes by flow cytometry analysis from control MC38 or Tpst2 knock-down MC38-bearing mice with or without anti-PD1; n = 8 mice per group (left). The dot-plot represents population of effector CD4+ T cell through CD4 and CD44 expression in each group (right). Gray background represents total immune cells in tumor-draining lymph node and green dot represents effector CD4+ T cell. The above-attached and right-attached histograms represent CD4 expression and CD44 expression of each group, respectively. e, Percentage of NK cell in tumor-draining lymph nodes by flow cytometry analysis from control MC38 or Tpst2 knock-down MC38-bearing mice with or without anti-PD1; n = 8 mice per group (left). The dot-plot represents population of NK cell through CD3 and NK1.1 expression in each group (right). Gray background represents total immune cells in tumor-draining lymph nodes and red dot represents NK cell (CD3- NK1.1+). The above-attached and right-attached histograms represent NK1.1 expression and CD3 expression of each group, respectively. f, Percentage of effector CD8+ T cell in tumor tissues by flow cytometry analysis from control MC38 or Tpst2 knock-down MC38-bearing mice with or without anti-PD1; n = 8 mice per group (left). The dot-plot represents population of effector CD8+ T cell through CD8 and CD44 expression in each group (right). Gray background represents total immune cells and blue dot represents effector CD8+ T cell. The above-attached and right-attached histograms represent CD8 expression and CD44 expression of each group, respectively. g, Percentage of PD1+ effector CD8+ T cell in tumor tissues by flow cytometry analysis from control MC38 or Tpst2 knock-down MC38-bearing mice with or without anti-PD1; n = 8 mice per group (left). The histogram represents PD1 expression in effector CD8+ T cell in each group (right)
Fig. 5
Fig. 5
Tumor RNA sequencing in a syngeneic mouse model and single-cell RNA sequencing of human tumor tissues. a, Gene Set Enrichment Analysis (GSEA) of Tpst2 knock-down tumors from a syngeneic mouse model. Utilizing RNA sequencing data from mouse tumor tissues, this analysis compares the genetic profiles of Tpst2 knock-down tumors to control tumors. Tumor samples were collected from the syngeneic mouse model depicted in Fig. 4b. The comparison was made between the control + IgG group and the Tpst2 knock-down + IgG group, as well as the control + anti-PD1 group and the Tpst2 knock-down + anti-PD1 group, to highlight the distinctions between control and Tpst2 knock-down effects; n = 3 per group. b, Heatmap displays the expression levels of 11 genes related to the antigen processing and presentation process, as commonly identified in the GSEA results from (a). Each gene’s expression level is normalized to z-scores for comparative visualization. c, Dot plots showing key genes in antigen processing and presentation. Data are presented as mean ± SEM, with significance determined through one-way ANOVA. Asterisks indicate significant differences between the samples (*: P < 0.05; **: P < 0.01; ***: P < 0.001). d, Single-cell violin plot for comparing TPST2 expression between TPST2-positive and TPST2-negative non-immune cells. Conducting single-cell RNA sequencing analysis using public lung adenocarcinoma datasets (12 patients), we distinguished 74,888 cells into immune and non-immune categories based on the annotation results, and further focused on non-immune cells, identifying TPST2-positive and TPST2-negative populations. e, GSEA of TPST2-associated genomic alterations. GSEA, conducted with the WebGestalt tool, identifies significant pathways among 63 upregulated and 297 downregulated genes in TPST2-negative non-immune cells compared to TPST2-positive non-immune cells (left panel). A specific GSEA plot highlights the enrichment of MHC class II antigen presentation pathway in TPST2-negative cells (right panel). f, Comparative gene expression related to MHC class II antigen presentation. This analysis compares the expression of genes, as identified in the right panel of (e), between TPST2-positive and TPST2-negative non-immune cells. Dot size represents the percentage of cells expressing each gene, while dot color indicates the average expression levels. g, Single-cell violin plots for MHC class II antigen presentation-related genes. Violin plots compare the expression of genes, as identified in the right panel of (e), between TPST2-positive and TPST2-negative non-immune cells. Each dot within the plots represents an individual cell. h, Correlation analysis between TPST2 expression and MHC class II antigen presentation-related genes. Plots depict the correlation between TPST2 levels and the expression of representative genes in non-immune cells, with each dot representing the average expression per patient. Significance is determined using Pearson’s correlation test
Fig. 6
Fig. 6
Effect of TPST2 expression on cancer immunity and prognosis in transcriptomic analysis of cancer patient samples. a, The proportion of patients with copy number alterations of TPST2 gene in tumor samples across the cancer types. Data were extracted from putative GISTIC copy number variation (CNV) of The Cancer Genome Atlas (TCGA) PanCancer Atlas studies in cBioPortal (https://www.cbioportal.org/). b, The mRNA expressions of TPST2 in normal and cancer tissues across the cancer types. Data were extracted from normalized gene expression (Log2[normalized count + 1]) of TCGA PanCancer Atlas studies in USCS Xena (https://xena.ucsc.edu/). Asterisks indicate significant differences between normal and cancer tissues (*: P < 0.05; **: p < 0.01; ***: p < 0.001). c, Survival analysis according to TPST2 expression across the cancer types. Kaplan-Meier plots for overall survival of patients with high and low TPST2 mRNA expressions were demonstrated. Red and black lines represent samples with high and low TPST2 expressions, respectively. Each hazard ratio (HR) of high TPST2 expression and P-value, determined by log rank test, is shown. d, Hallmark gene set analysis of genes with positive expression correlation with TPST2 in breast cancer. Hallmark gene set analysis was performed using 482 genes, of which expressions were positively correlated with TPST2 expression (Spearman’s correlation coefficient ρ ≥ 0.3), and enriched gene sets are demonstrated (Q < 0.001). e, Gene set enrichment analysis (GSEA) for breast cancer tissue microarray data according to the TPST2 expression. Microarray data of 238 triple-negative breast cancer patients (GSE103091) were downloaded from the Gene Expression Omnibus (GEO) database (https://www.ncbi.nlm.nih.gov/geo). GSEA was performed between 20 samples with highest expression levels of TPST2 (TPST2_H) and 20 samples with lowest expression levels of TPST2 (TPST2_L). The significantly enriched gene sets in TPST2_H (Q < 0.001) were listed. ES: enrichment score, NES: normalized enrichment score, NOM p-val: nominal P-value, FDR q-val: false discovery rate Q-value. f, Enrichment plots of representative gene sets that were significantly enriched in TPST2_H group. On the x-axis, genes are ranked from the most upregulated to the most downregulated between TPST2_H (left end) and TPST2_L (right end) groups. The y-axis shows a running enrichment score for TPST2 expression

References

    1. Sharma P, Allison JP. Dissecting the mechanisms of immune checkpoint therapy. Nat Rev Immunol. 2020;20(2):75–6. 10.1038/s41577-020-0275-8 - DOI - PubMed
    1. Sharma P, Hu-Lieskovan S, Wargo JA, Ribas A. Primary, adaptive, and acquired resistance to cancer immunotherapy. Cell. 2017;168(4):707–23. 10.1016/j.cell.2017.01.017 - DOI - PMC - PubMed
    1. Ott PA, Hodi FS, Kaufman HL, Wigginton JM, Wolchok JD. Combination immunotherapy: a road map. J Immunother Cancer. 2017;5:16. 10.1186/s40425-017-0218-5 - DOI - PMC - PubMed
    1. Moore KL. Protein tyrosine sulfation: a critical posttranslation modification in plants and animals. Proc Natl Acad Sci U S A. 2009;106(35):14741–2. 10.1073/pnas.0908376106 - DOI - PMC - PubMed
    1. Teramoto T, Fujikawa Y, Kawaguchi Y, Kurogi K, Soejima M, Adachi R, Nakanishi Y, Mishiro-Sato E, Liu MC, Sakakibara Y, et al. Crystal structure of human tyrosylprotein sulfotransferase-2 reveals the mechanism of protein tyrosine sulfation reaction. Nat Commun. 2013;4:1572. 10.1038/ncomms2593 - DOI - PMC - PubMed

MeSH terms

LinkOut - more resources