. 2024 Aug 3;21(1):193.
doi: 10.1186/s12974-024-03186-5.

Lactate promotes microglial scar formation and facilitates locomotor function recovery by enhancing histone H4 lysine 12 lactylation after spinal cord injury

Affiliations

Lactate promotes microglial scar formation and facilitates locomotor function recovery by enhancing histone H4 lysine 12 lactylation after spinal cord injury

Xuyang Hu et al. J Neuroinflammation. .

Abstract

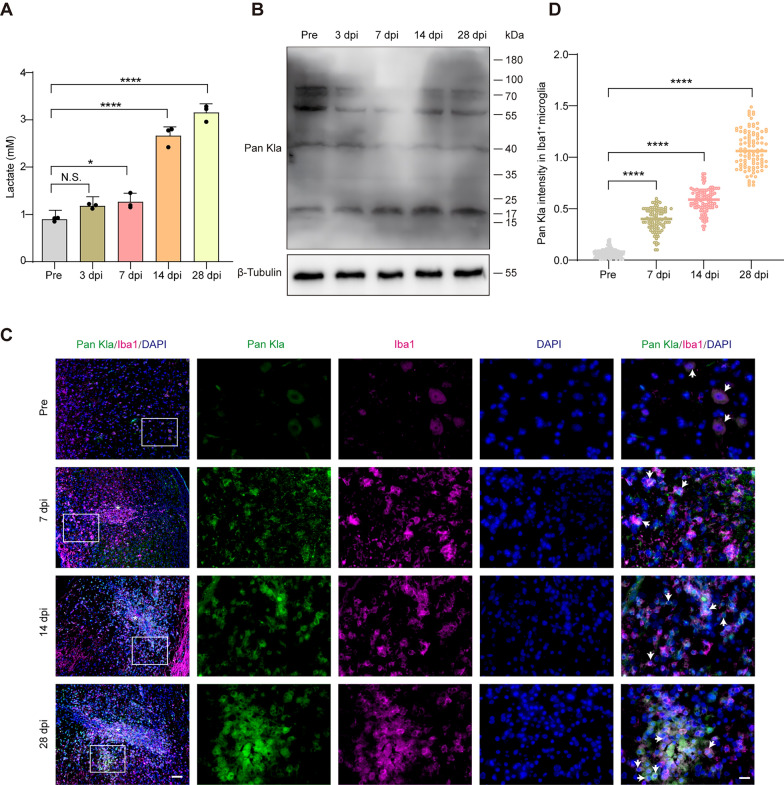
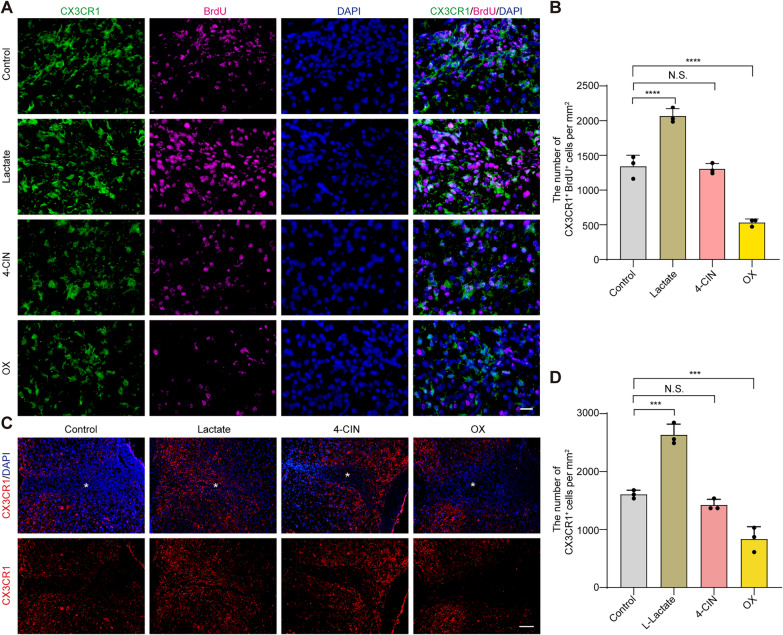
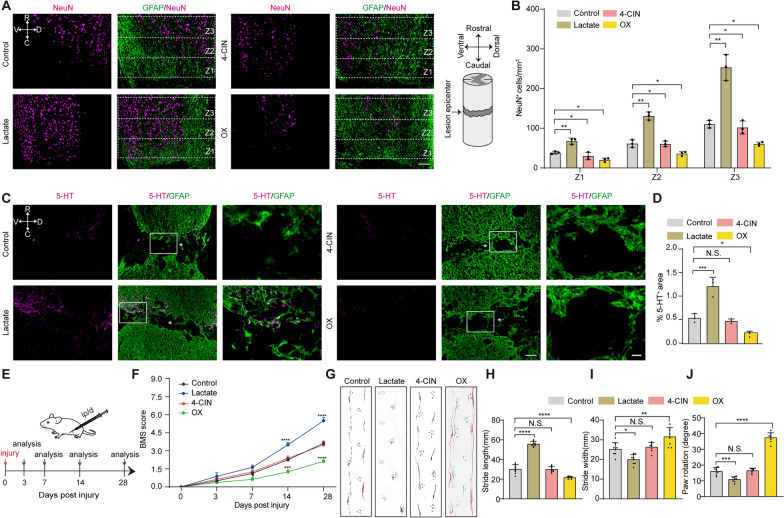
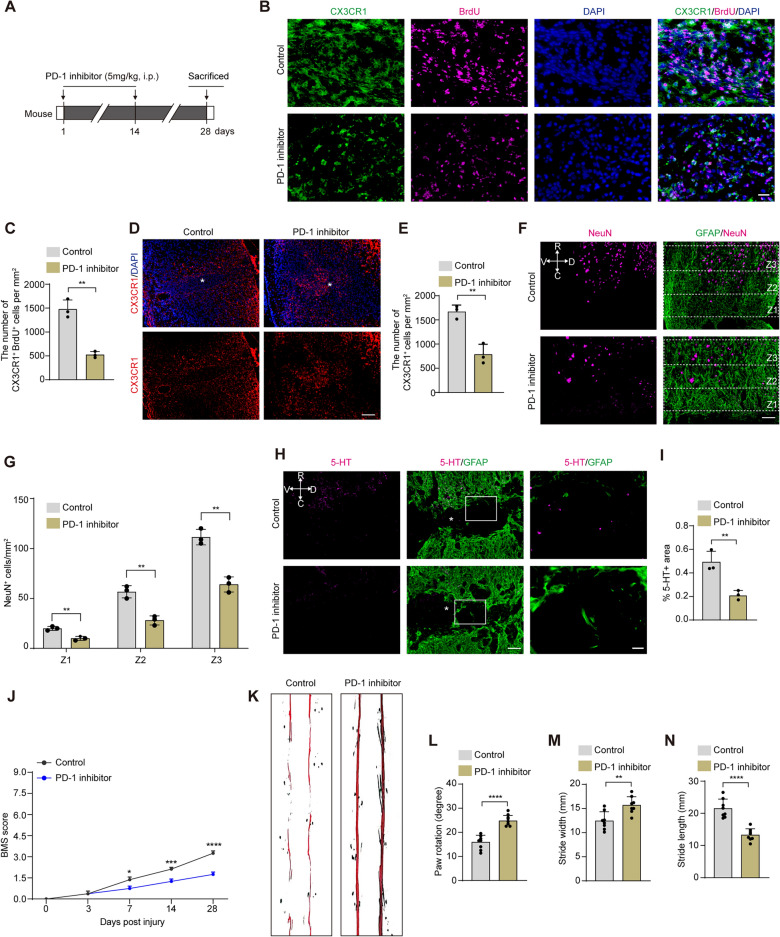
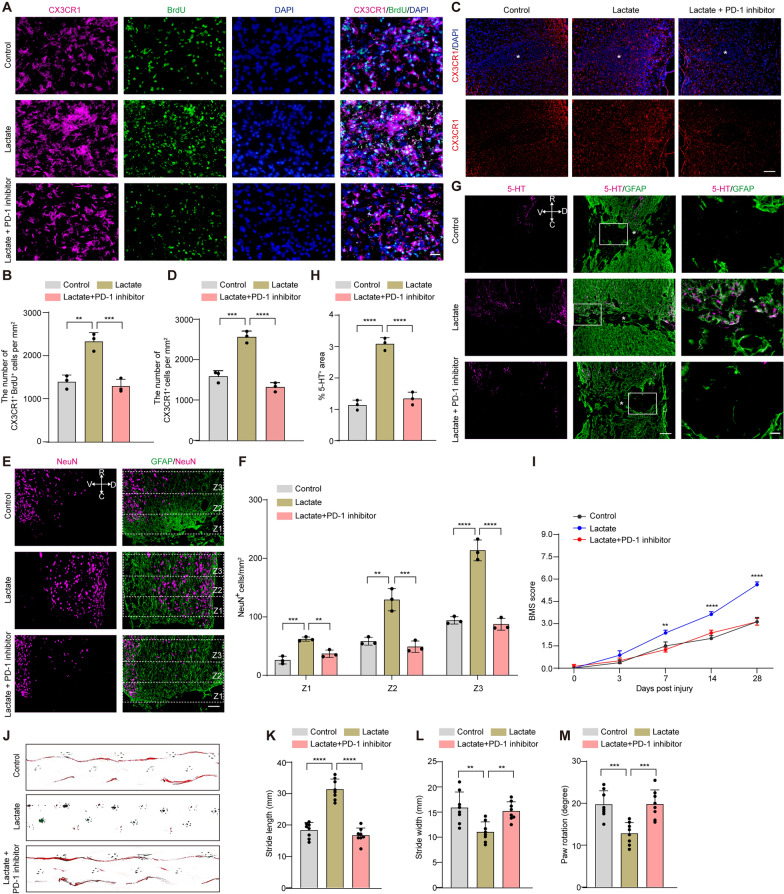
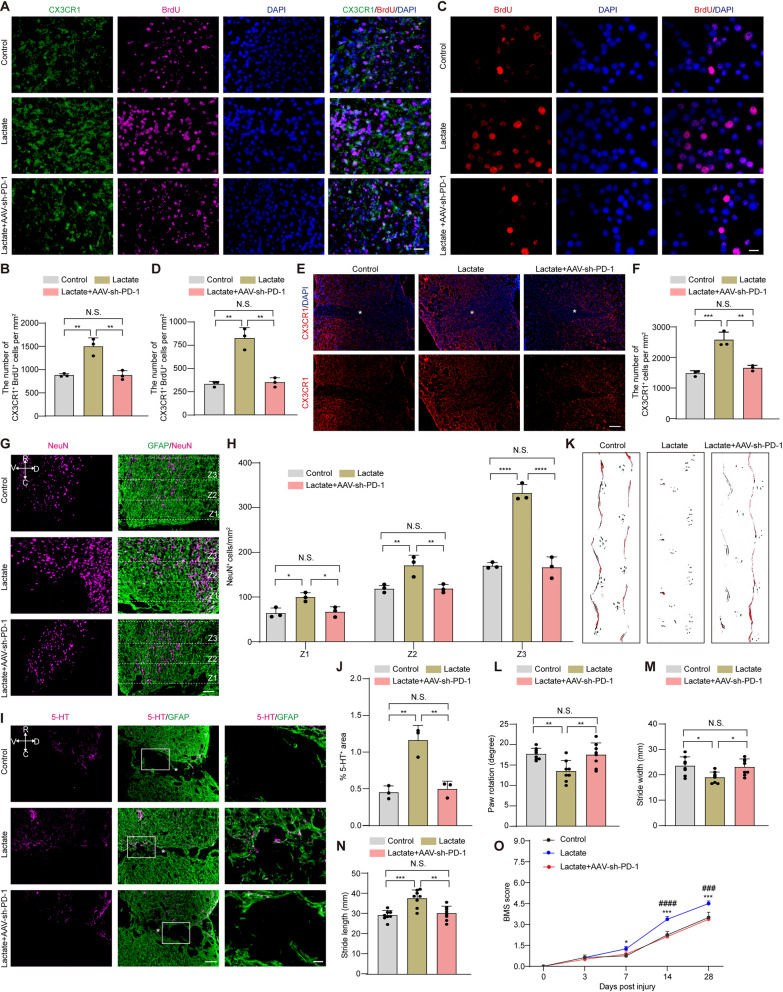
Lactate-derived histone lactylation is involved in multiple pathological processes through transcriptional regulation. The role of lactate-derived histone lactylation in the repair of spinal cord injury (SCI) remains unclear. Here we report that overall lactate levels and lactylation are upregulated in the spinal cord after SCI. Notably, H4K12la was significantly elevated in the microglia of the injured spinal cord, whereas exogenous lactate treatment further elevated H4K12la in microglia after SCI. Functionally, lactate treatment promoted microglial proliferation, scar formation, axon regeneration, and locomotor function recovery after SCI. Mechanically, lactate-mediated H4K12la elevation promoted PD-1 transcription in microglia, thereby facilitating SCI repair. Furthermore, a series of rescue experiments confirmed that a PD-1 inhibitor or microglia-specific AAV-sh-PD-1 significantly reversed the therapeutic effects of lactate following SCI. This study illustrates the function and mechanism of lactate/H4K12la/PD-1 signaling in microglia-mediated tissue repair and provides a novel target for SCI therapy.

Keywords: H4K12la; Lactate; Microglia; PD-1; Spinal cord injury.


Conflict of interest statement

The authors declare that no competing interests exists.

Figures

Fig. 1
Fig. 1
Changes in lactate and lactylation modification levels after SCI in vivo. A Lactate levels of the spinal cord at Pre, and 3, 7, 14, 28 dpi in vivo. n = 3 mice per group, *p < 0.05; ****p < 0.0001; N.S., not significant. B Western blot analysis of the Pan histone lactylation levels in the spinal cord at Pre, and 3, 7, 14, and 28 dpi. C Representative images of Pan Kla (green) co-stained with microglia (Iba1, magenta) at Pre, and 7, 14, and 28 dpi in vivo. White arrowheads indicate the colocalization of Pan Kla and microglia. Asterisks indicate the lesion site. Scale bars: low magnification, 100 μm; high magnification, 20 μm. D Quantification of Pan Kla intensity in Iba1+ microglia in (C). All data were presented as the mean ± SEM, n > 100 cells per group, ****p < 0.0001
Fig. 2
Fig. 2
The changes of site-specific histones lactylation after SCI in vivo. AJ Western blotting analysis of site-specific histones lactylation in spinal cord in vivo at Pre, and 3, 7, 14, and 28 dpi with quantification of protein levels. All data were presented as the mean ± SEM, n = 3 mice per group, *p < 0.05; **p < 0.01; ***p < 0.001; ****p < 0.0001; N.S., not significant. KM Representative immunofluorescence images for expression of H4K12la (green) and CX3CR1 (microglia, magenta) (K), H4K12la and PDGFRβ (pericyte, magenta) (L), or H4K12la and GFAP (astrocyte, magenta) (M) in injured spinal cords at 7 dpi in vivo. White arrowheads indicated the colocalization of H4K12la and CX3CR1. Asterisks indicate the lesion site, scale bars: low magnification, 100 μm; higher magnification, 20 μm. N Quantitative analysis of the percentage of H4K12la+CX3CR1+, H4K12la+PDGFRβ+ and H4K12la+GFAP+ cells in total H4K12la+ cells in injured spinal cords. All data are mean ± SEM, n = 3 mice per group, ****p < 0.0001 (H4K12la+PDGFRβ+ or H4K12la+GFAP+ vs. H4K12la+ CX3CR1+). O Representative images of H4K12la (green) co-stained with microglia (CX3CR1, magenta) at Pre, and 7, 14, and 28 dpi in vivo. White arrowheads indicated the colocalization of H4K12la and CX3CR1. Asterisks indicate the lesion site, scale bars: low magnification, 100 μm; high magnification, 20 μm. P Quantification of H4K12la intensity in (O). All data were presented as the mean ± SEM, n > 100 cells per group, ****p < 0.0001. Q Representative images of H4K12la (green) co-stained with microglia (Iba1, magenta) at Pre, and 7, 14, and 28 dpi in vivo. White arrowheads indicated the colocalization of H4K12la and Iba1. Asterisks indicate the lesion site, scale bars: low magnification, 100 μm; high magnification, 20 μm. R Quantification of H4K12la intensity in (Q). All data were presented as the mean ± SEM, n > 100 cells per group, ****p < 0.0001
Fig. 3
Fig. 3
Exogenous lactate treatment upregulates H4K12la level in microglia after SCI in vivo. A Schedule described that mice were injected intraperitoneally (i. p.) with lactate, 4-CIN, or OX daily until 28 dpi. B Lactate levels of the spinal cord at 14 and 28 dpi in PBS (control), lactate, 4-CIN and OX groups in vivo. All data were presented as the mean ± SEM, n = 3 mice per group, ****p < 0.0001; N.S., not significant. C Western blotting analysis detected H4K12la expression levels of the spinal cord at 14 and 28 dpi in lactate group in vivo. D Quantification of H4K12la expression levels in (C). All data were presented as the mean ± SEM, n = 3 mice per group, **p < 0.01; ***p < 0.001. E Western blotting analysis detected the H4K12la expression levels of the spinal cord at 14 and 28 dpi in 4-CIN group in vivo. F Quantification of H4K12la expression levels in (E). All data were presented as the mean ± SEM, n = 3 mice per group, N.S. meant control compared with 4-CIN, not significant. G Western blotting analysis detected H4K12la expression levels of the spinal cord at 14 and 28 dpi in OX group in vivo. H Quantification of H4K12la expression levels in (G). All data were presented as the mean ± SEM, n = 3 mice per group, *p < 0.05; ***p < 0.001. I Representative images of H4K12la (green) co-stained with microglia (Iba1, magenta) at 14 and 28 dpi in lactate, 4-CIN, and OX groups in vivo. White arrowheads indicated the colocalization of H4K12la and microglia. Asterisks indicate the lesion site, scale bars: low magnification, 100 μm; high magnification, 20 μm. J Quantification of H4K12la intensity in (I). All data were presented as the mean ± SEM, n > 100 cells per group, ****p < 0.0001; N.S., not significant
Fig. 4
Fig. 4
Lactate treatment promotes microglia proliferation and scar formation after SCI in vivo. A Representative immunofluorescence images of microglia proliferation by double-staining BrdU (magenta) and CX3CR1 (green) in control, lactate, 4-CIN, and OX groups at 7 dpi in vivo. Scale bar: 20 μm. B Quantification of the density of BrdU+CX3CR1+ cells in (A). All data were presented as the mean ± SEM, n = 3 mice per group, ****p < 0.0001; N.S., not significant. C Immunofluorescence staining of CX3CR1 (red) in control, lactate, 4-CIN, and OX groups at 28 dpi in vivo. Asterisks indicate the lesion site, scale bar: 100 μm. D Quantification of the density of CX3CR1+ cells in (C). All data were presented as the mean ± SEM, n = 3 mice per group, ***p < 0.001; N.S., not significant
Fig. 5
Fig. 5
Lactate treatment promotes axon regeneration and locomotor function recovery after SCI in vivo. A Images of astrocytes (GFAP, green) stained with neurons (NeuN, magenta) in Zone1-Zone3 (Z1_Z3) at 28 dpi in control, lactate, 4-CIN, and OX groups in vivo. Z1 (0–250 μm) was in the lesion site, Z2 (250–500 μm) was started immediately adjacent to Z1, and Z3 (500–750 μm) was adjacent to Z2. Scale bars: magnification, 100 μm. Compass: D, dorsal; V, ventral; R, rostral; C, caudal. B Quantification of NeuN+ neurons in three zones (Z1_Z3) in control, lactate, 4-CIN, and OX groups. All data were presented as the mean ± SEM, n = 3 mice per group, *p < 0.05; **p < 0.01. C Images of GFAP (green) co-stained with axons (5-HT, magenta) at 28 dpi in control, lactate, 4-CIN, and OX groups in vivo, and the boxed region indicated the lesion center magnified in right panels. Asterisks indicate the lesion site, scale bars: low magnification, 100 μm; high magnification, 20 μm. C Quantification of the percentage of 5-HT+ area in the area of the spinal cord segment penetrating into the lesion core at 28 dpi in vivo. All data are presented as the mean ± SEM, n = 3 mice per group, *p < 0.05; ***p < 0.001; N.S., not significant. D Schedule of locomotor function analysis and the intraperitoneal injection with lactate, 4-CIN or OX daily until 28 dpi. E Locomotor function was evaluated by BMS at the indicated time points. All data are presented as the mean ± SEM, n = 8 mice per group, *p < 0.05; ***p < 0.001; ****p < 0.0001. F Representative images of footprint analysis in control, lactate, 4-CIN, and OX groups at 28 dpi. HJ Quantification of the stride length and width and paw rotation at 28 dpi. All data are presented as the mean ± SEM, n = 8 mice per group; *p < 0.05; **p < 0.01; ***p < 0.001; ****p < 0.0001; N.S., not significant
Fig. 6
Fig. 6
H4K12la activates PD-1 transcription in the injured spinal cord in vivo and microglia in vitro. A The binding density of H4K12la was visualized by deep Tools: the heatmap presents the CUT&Tag tag counted on the H4K12la binding peaks in the spinal cord at Pre and 14 dpi in vivo, ordered by signal strength. B Genome-wide distribution of H4K12la-binding peaks in the spinal cord at Pre and 14 dpi in vivo. C Genome browser tracks of CUT&Tag signal at the PD-1 loci. D ChIP analysis of the indicated promoters was performed using antibodies against H4K12la in the spinal cord at Pre and 14 dpi in vivo. All data are presented as the mean ± SEM, n = 3 mice per group, ****p < 0.0001. E qPCR assays monitoring PD-1 expression in the spinal cord at Pre and 14 dpi in vivo. All data are presented as the mean ± SEM, n = 3 mice per group, **p < 0.01. F ChIP analysis of the indicated promoters was performed using antibodies against H4K12la in primary microglia treated with PBS (control) and lactate in vitro. All data are presented as the mean ± SEM, n = 3 per group, ***p < 0.001. G qPCR assays monitoring expression of the PD-1 in primary microglia treated with PBS (control) and lactate in vitro. All data are presented as the mean ± SEM, n = 3 per group, **p < 0.01
Fig. 7
Fig. 7
Intraperitoneal injection of PD-1 inhibitor suppresses microglial proliferation and scar formation, hinders axon regeneration, and prevents locomotor function recovery after SCI in vivo. A The schedule described that the mice were treated with PD-1 inhibitor at 1 and 14 dpi via intraperitoneal (i. p.) injection and were sacrificed at 28 dpi. B Immunofluorescence staining of BrdU (magenta), CX3CR1 (green) in sagittal sections of the PBS (control) and PD-1 inhibitor groups at 7 dpi in vivo. Scale bar: 20 μm. C Quantification of the density of BrdU+CX3CR1+ cells in (B). All data are presented as the mean ± SEM, n = 3 mice per group, **p < 0.01. D Immunofluorescence staining of CX3CR1 (red) in control and PD-1 inhibitor groups at 28 dpi in vivo. Scale bar: 100 μm. E Quantification of the density of CX3CR1+ cells in (D). All data are presented as the mean ± SEM, n = 3 mice per group, **p < 0.01. F Images of astrocytes (GFAP+, green) stained with neurons (NeuN+, magenta) in Zone1-Zone3 (Z1_Z3) at 28 dpi in PD-1 inhibitor and control groups in vivo. Scale bar: 100 μm. G Quantification of NeuN+ neurons in three zones (Z1_Z3) in (F). All data are presented as the mean ± SEM, n = 3 mice per group, **p < 0.01. H Images of GFAP (green) co-stained with axons (5-HT, magenta) at 28 dpi in PD-1 inhibitor and control groups in vivo. Asterisks indicate the lesion site, scale bars: low magnification, 100 μm; high magnification, 20 μm. I Quantification of the percentage of 5-HT+ area in the area of the spinal cord segment penetrating into the lesion core at 28 dpi in (H). All data are presented as the mean ± SEM, n = 3 mice per group, **p < 0.01. J Locomotor function was evaluated by BMS at the indicated time points in PD-1 inhibitor and control groups. All data are presented as the mean ± SEM, n = 8 mice per group, *p < 0.05; ***p < 0.001; ****p < 0.0001. K Representative images of footprint analysis in PD-1 inhibitor and control groups at 28 dpi. L, N Quantification of the paw rotation, stride width and stride length at 28 dpi. All data are presented as the mean ± SEM, n = 8 mice per group, **p < 0.01; ****p < 0.0001
Fig. 8
Fig. 8
PD-1 inhibitor reverses the advantageous effects of lactate on SCI repair in vivo. A Immunofluorescence staining of BrdU (green) and CX3CR1 (magenta) in sagittal sections of the PBS (control), lactate, and lactate + PD-1 inhibitor groups at 7 dpi in vivo. Scale bar: 20 μm. B Quantification of the density of BrdU+CX3CR1+ cells in (A). All data are presented as the mean ± SEM, n = 3 mice per group, **p < 0.01; ***p < 0.001. C Immunofluorescence staining of CX3CR1 (red) in sagittal sections of the control, lactate, and lactate + PD-1 inhibitor groups at 28 dpi in vivo. Scale bar: 100 μm. D Quantification of the density of CX3CR1+ cells in (C). All data are presented as the mean ± SEM, n = 3 mice per group, ***p < 0.001; ****p < 0.0001. E Images of astrocytes (GFAP, green) stained with neurons (NeuN, magenta) in Z1_Z3 at 28 dpi in control, lactate, and lactate + PD-1 inhibitor groups in vivo. Scale bar: 100 μm. F Quantification of NeuN+ neurons in Z1_Z3 in (E). All data are presented as the mean ± SEM, n = 3 mice per group, **p < 0.01; ***p < 0.001; ****p < 0.0001. G Images of GFAP (green) co-stained with axons (5-HT, magenta) at 28 dpi in control, lactate, and lactate + PD-1 inhibitor groups in vivo. Asterisks indicate the lesion site, scale bars: low magnification, 100 μm; high magnification, 20 μm. H Quantification of the percentage of 5-HT+ area in the area of the spinal cord segment penetrating into the lesion core at 28 dpi in (G). All data are presented as the mean ± SEM, n = 3 mice per group, ****p < 0.0001. I The locomotor function was evaluated by BMS at the indicated time points. All data are presented as the mean ± SEM, n = 8 mice per group, **p < 0.01; ****p < 0.0001. J Representative images of footprint analysis in mice in control, lactate, and lactate + PD-1 inhibitor groups at 28 dpi. KM Quantification of the stride length and width and paw rotation at 28 dpi. All data are presented as the mean ± SEM, n = 8 mice per group, **p < 0.01; ***p < 0.001; ****p < 0.0001
Fig. 9
Fig. 9
PD-1 suppression in microglia hinders axon regeneration and inhibits functional recovery after SCI in vivo. A Images of GFAP (green) co-stained with axons (5-HT, magenta) in AAV-Con and AAV-sh-PD-1 groups at 28 dpi in vivo. Asterisks indicate the lesion site, scale bars: low magnification, 100 μm; high magnification, 20 μm. B Quantification of the percentage of 5-HT+ area in the area of the spinal cord segment spanning the lesion site in (A). All data are presented as the mean ± SEM, n = 3 mice per group, **p < 0.01. C Representative immunofluorescence images of GFAP (green) and NeuN (magenta) neurons in Z1-Z3 zones adjacent to central lesion site in AAV-Con and AAV-sh-PD-1 mice at 28 dpi in vivo. Scale bar: magnification, 100 μm. D Quantification of NeuN+ neurons in Z1_Z3 zones adjacent to lesion site in AAV-Con and AAV-sh-PD-1 groups in (C). All data are presented as the mean ± SEM, n = 3 mice per group, **p < 0.01; ***p < 0.001; ****p < 0.0001. E Representative images of footprint analysis in mice treated with AAV-Con or AAV-sh-PD-1 at 28 dpi in vivo. FH Quantification of the stride length and width and paw rotation. All data are presented as the mean ± SEM, n = 8 mice per group, **p < 0.01; ***p < 0.001. I Locomotor function was evaluated by BMS at the indicated time points in mice treated with AAV-Con or AAV-sh-PD-1. All data were presented as the mean ± SEM, n = 8 mice per group, *p < 0.05; **p < 0.01; ****p < 0.0001
Fig. 10
Fig. 10
Inhibition of PD-1 expression in microglia rescues the beneficial effects of lactate on microglial proliferation, scar formation, axon regeneration, and locomotor function recovery after SCI in vivo. A Immunofluorescence staining of BrdU (magenta) and CX3CR1 (green) in sagittal sections of the control, lactate, and lactate + AAV-sh-PD-1 groups at 7 dpi in vivo. Scale bar: 20 μm. B Quantification of the density of BrdU+CX3CR1+ cells in (A). All data are presented as the mean ± SEM, n = 3 mice per group, **p < 0.01; N.S., not significant. C Immunofluorescence staining of BrdU (red) in microglia treated with PBS (control), lactate, and lactate + AAV-sh-PD-1 in vitro. Scale bar: 20 μm. D Quantification of the density of BrdU+CX3CR1+ cells in (C). n = 3 per group, **p < 0.01; N.S., not significant. E Immunofluorescence staining of CX3CR1 (red) in sagittal sections from control, lactate, and lactate + AAV-sh-PD-1 groups at 28 dpi in vivo. Scale bar: 100 μm. F Quantification of the density of CX3CR1+ cells in (E). All data are presented as the mean ± SEM, n = 3 mice per group, **p < 0.01; ***p < 0.001; N.S., not significant. G Representative immunofluorescence images of GFAP (green) NeuN (magenta) neurons in Z1_Z3 zones adjacent to central lesion core in the control, lactate, and lactate + AAV-sh-PD-1 groups at 28 dpi in vivo. Scale bar: 100 μm. H Quantification of NeuN+ neurons in Z1_Z3 in (G). All data were presented as the mean ± SEM, n = 3 mice per group, *p < 0.05; **p < 0.01; ****p < 0.0001; N.S., not significant. I Images of GFAP (green) co-stained with axons (5-HT, magenta) at 28 dpi in control, lactate, and lactate + AAV-sh-PD-1 groups in vivo. Asterisks indicate the lesion site, scale bars: low magnification, 100 μm; high magnification, 20 μm. J Quantification of the percentage of 5-HT+ area in the area of the spinal cord segment spanning the lesion core at 28 dpi in (I). All data are presented as the mean ± SEM, n = 3 mice per group, **p < 0.01; N.S., not significant. K Representative images of footprint analysis in control, lactate, and lactate + AAV-sh-PD-1 groups at 28 dpi. (LN Quantification of the stride length and width and paw rotation at 28 dpi. All data are presented as the mean ± SEM, n = 8 mice per group, *p < 0.05; **p < 0.01; ***p < 0.001; N.S., not significant. O BMS scores during 28 days of recovery after SCI demonstrate better functional recovery in control, lactate and lactate + AAV-sh-PD-1 groups. All data are presented as the mean ± SEM, n = 8 mice per group, ###meant lactate compared to lactate + AAV-sh-PD-1, ###P < 0.001; ####meant lactate compared to lactate + AAV-sh-PD-1, ####p < 0.0001; ***meant lactate compared to the control, *p < 0.05; ***p < 0.001

References

    1. Nakamura M, Okano H. Cell transplantation therapies for spinal cord injury focusing on induced pluripotent stem cells. Cell Res. 2013;23:70–80. 10.1038/cr.2012.171 - DOI - PMC - PubMed
    1. Mothe A, Tator C. Advances in stem cell therapy for spinal cord injury. J Clin Investig. 2012;122:3824–34. 10.1172/JCI64124 - DOI - PMC - PubMed
    1. Tran A, Warren P, Silver J. The biology of regeneration failure and success after spinal cord injury. Physiol Rev. 2018;98:881–917. 10.1152/physrev.00017.2017 - DOI - PMC - PubMed
    1. Dias D, Kim H, Holl D, Werne Solnestam B, Lundeberg J, Carlén M, et al. Reducing pericyte-derived scarring promotes recovery after spinal cord injury. Cell. 2018;173:153-65.e22. 10.1016/j.cell.2018.02.004 - DOI - PMC - PubMed
    1. Bellver-Landete V, Bretheau F, Mailhot B, Vallières N, Lessard M, Janelle M, et al. Microglia are an essential component of the neuroprotective scar that forms after spinal cord injury. Nat Commun. 2019;10:518. 10.1038/s41467-019-08446-0 - DOI - PMC - PubMed

MeSH terms

LinkOut - more resources