. 2024 Aug 2;23(1):157.
doi: 10.1186/s12943-024-02062-3.

Single-cell tumor heterogeneity landscape of hepatocellular carcinoma: unraveling the pro-metastatic subtype and its interaction loop with fibroblasts

Affiliations

Single-cell tumor heterogeneity landscape of hepatocellular carcinoma: unraveling the pro-metastatic subtype and its interaction loop with fibroblasts

De-Zhen Guo et al. Mol Cancer. .

Abstract

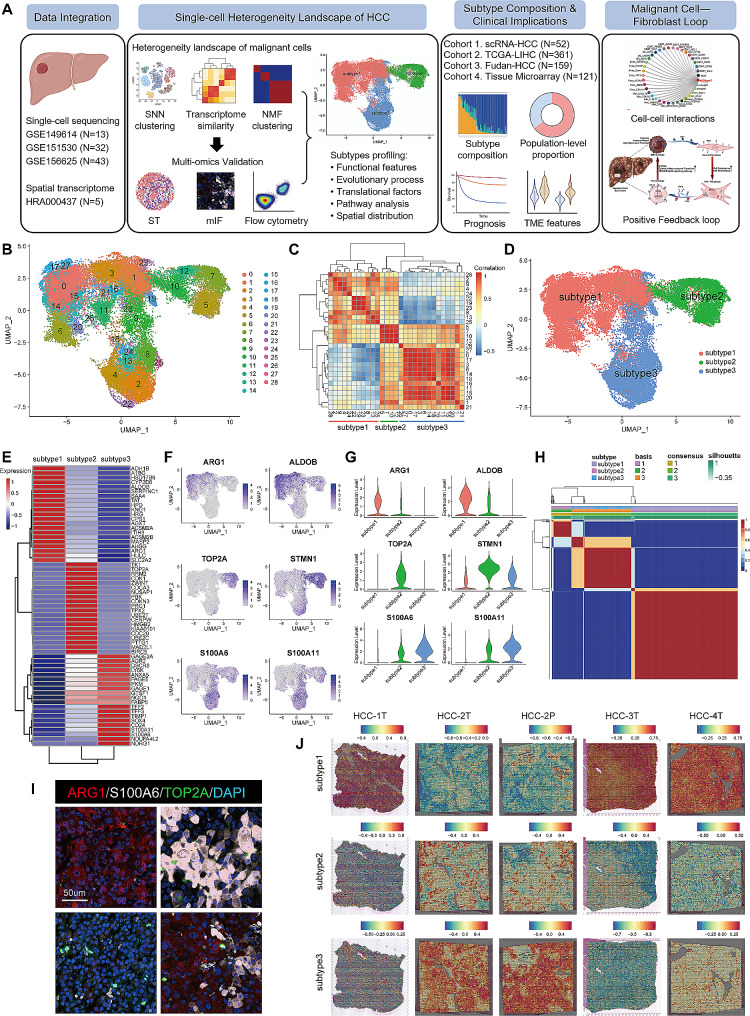
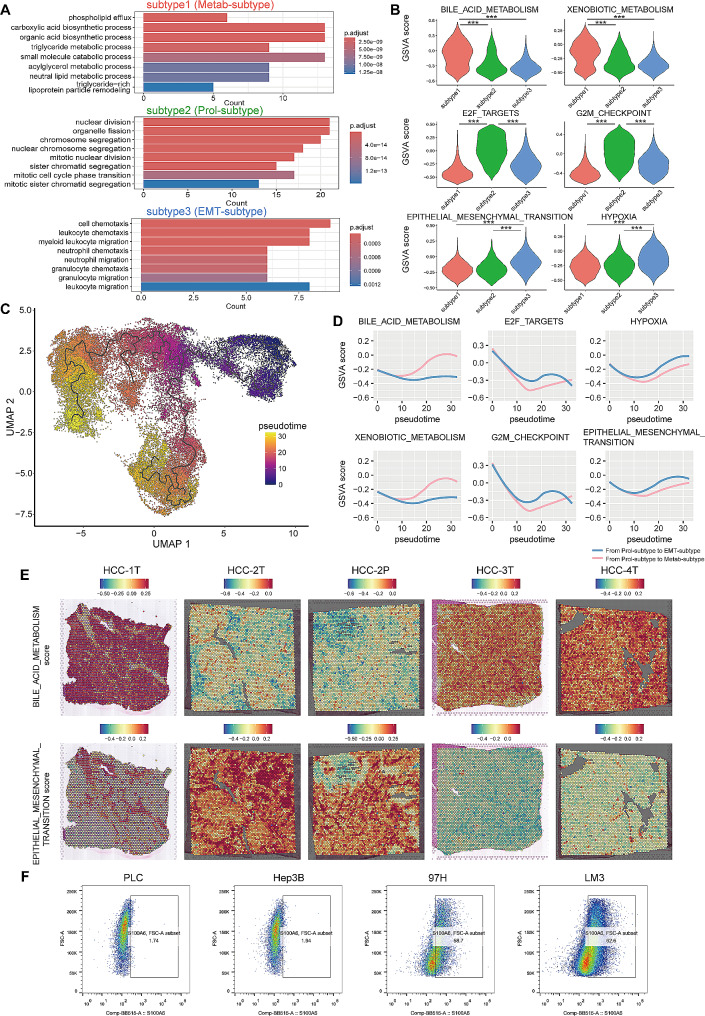
Background: Tumor heterogeneity presents a formidable challenge in understanding the mechanisms driving tumor progression and metastasis. The heterogeneity of hepatocellular carcinoma (HCC) in cellular level is not clear.

Methods: Integration analysis of single-cell RNA sequencing data and spatial transcriptomics data was performed. Multiple methods were applied to investigate the subtype of HCC tumor cells. The functional characteristics, translation factors, clinical implications and microenvironment associations of different subtypes of tumor cells were analyzed. The interaction of subtype and fibroblasts were analyzed.

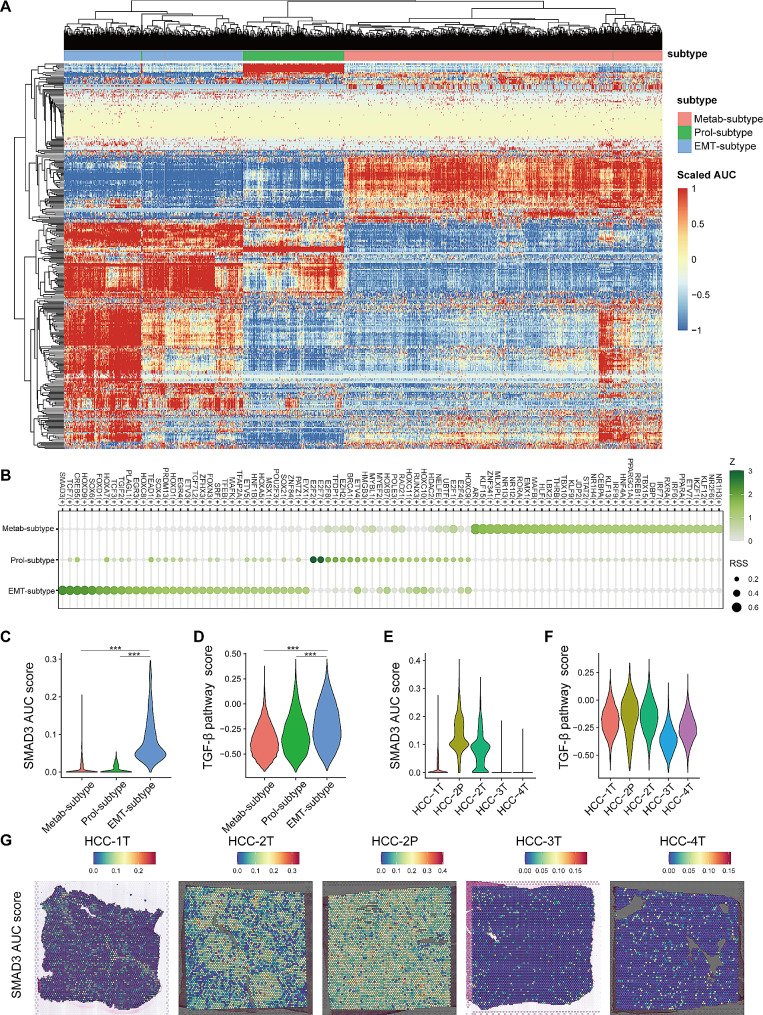
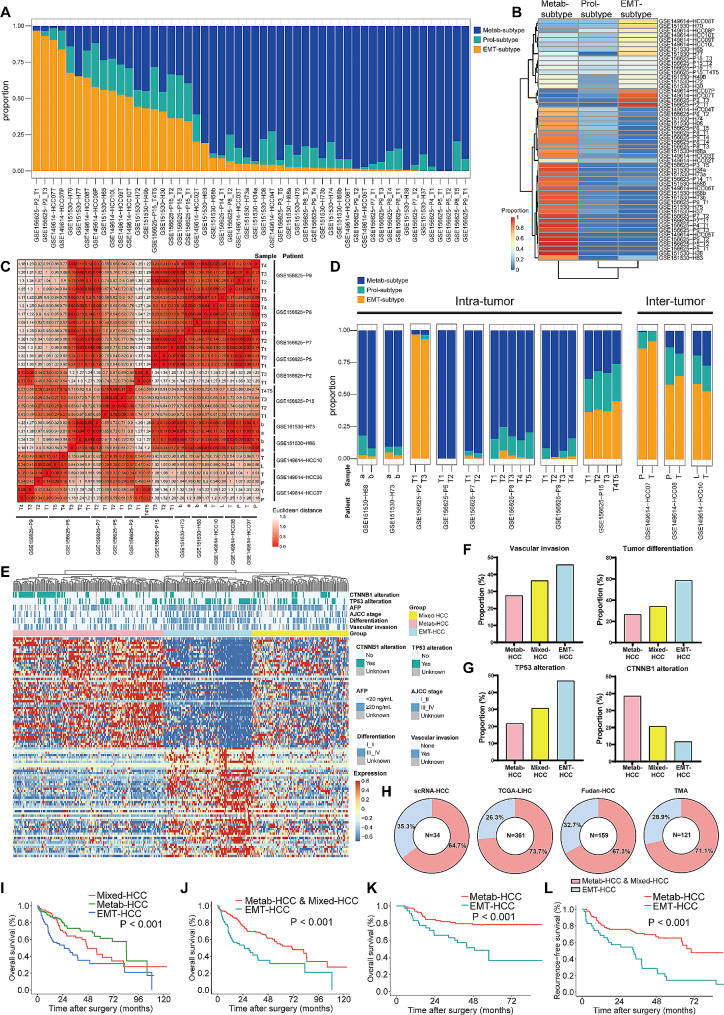
Results: We established a heterogeneity landscape of HCC malignant cells by integrated 52 single-cell RNA sequencing data and 5 spatial transcriptomics data. We identified three subtypes in tumor cells, including ARG1+ metabolism subtype (Metab-subtype), TOP2A+ proliferation phenotype (Prol-phenotype), and S100A6+ pro-metastatic subtype (EMT-subtype). Enrichment analysis found that the three subtypes harbored different features, that is metabolism, proliferating, and epithelial-mesenchymal transition. Trajectory analysis revealed that both Metab-subtype and EMT-subtype originated from the Prol-phenotype. Translation factor analysis found that EMT-subtype showed exclusive activation of SMAD3 and TGF-β signaling pathway. HCC dominated by EMT-subtype cells harbored an unfavorable prognosis and a deserted microenvironment. We uncovered a positive loop between tumor cells and fibroblasts mediated by SPP1-CD44 and CCN2/TGF-β-TGFBR1 interaction pairs. Inhibiting CCN2 disrupted the loop, mitigated the transformation to EMT-subtype, and suppressed metastasis.

Conclusion: By establishing a heterogeneity landscape of malignant cells, we identified a three-subtype classification in HCC. Among them, S100A6+ tumor cells play a crucial role in metastasis. Targeting the feedback loop between tumor cells and fibroblasts is a promising anti-metastatic strategy.

Keywords: Fibroblasts; Hepatocellular carcinoma; Metastasis; Single-cell; Tumor heterogeneity.


Conflict of interest statement

The authors declare no competing interests.

Figures

Fig. 1
Fig. 1
Single cell heterogeneity landscape of HCC identifying three subtypes of tumor cells. (A)The scheme for discovering and validating functional tumor subpopulations in HCC. (B) The UMAP plot of all tumor cells. (C) The heatmap showing the transcriptome correlation between malignant subclusters. (D) The UMAP plot showing the three subtypes of tumor cells. (E) The heat map showing top highly variable genes of the three subtypes of tumor cells. (F) The UMAP plot showing the expression of marker genes of three subtypes in tumor cells. (G) The violin plot showing the expression of marker genes of three subtypes in tumor cells. (H) The non-negative matrix factorization clustering of tumor cells validating the robustness of three-subtype classification. (I) Multiplexed immunofluorescence showing three subtypes of tumor cells, using antibodies ARG1, TOP2A, and S100A6. (J) The spatial distribution of three subtypes of tumor cells in spatial transcriptome data
Fig. 2
Fig. 2
The functional features and evolutionary process of three HCC tumor cell subtypes. (A) Bar chart showing the enrichment of specific biological process, based on the highly variable genes of three subtypes of tumor cells. (B) Violin plot showing hallmark scores stratified by the three subtypes. (C) Evolutionary trajectory of tumor cells, with each color coded for pseudo-time. (D) Gene set variation analysis scores of selected hallmarks along pseudotime from Prol-phenotype to Metab-subtype (red line) and from Prol-phenotype to EMT-subtype (blue line). (E) The spatial distribution of selected hallmarks scores in spatial transcriptome data. (F) Flow cytometry showing S100A6 expression level in four HCC cell lines. PLC, PLC/PRF/5 cells; 97 H, MHCC97H cells; LM3, HCCLM3 cells
Fig. 3
Fig. 3
The transcription factors profile of three HCC tumor cell subtypes. (A) The heat map of the area under the curve (AUC) scores of translation factors (TF) in HCC tumor cells. (B) The top TFs of the three subtypes of tumor cells, ranked by the regulon specificity score. (C) SMAD3 AUC score stratified by the three subtypes. (D) TGF-β pathway score stratified by the three subtypes. (E) SMAD3 AUC score stratified by sample in spatial transcriptome data. (F) TGF-β pathway score stratified by sample in spatial transcriptome data. (G) The spatial distribution of SMAD3 AUC score in spatial transcriptome data
Fig. 4
Fig. 4
The composition of three subtypes in sample-level. (A) The bar chart showing the composition of the three subtypes of tumor cells in each sample from the scRNA-HCC cohort. (B) The heat map showing two groups of HCC based on the composition of the three subtypes. (C) The heat map showing the Elucidation distance between multiple sampling tumors within the same patient based on the composition of the three subtypes. (D) The bar chart showing the composition of the three subtypes in multiple sampling tumors within the same patient. (E) The top 50 highly variable genes of Metab-subtype and EMT-subtype divided HCC tumors into three subgroups (Metab-HCC, EMT-HCC, and Mixed-HCC) in the TCGA-LIHC cohort. (F) The vascular invasion and tumor differentiation in Metab-HCC, Mixed-HCC, and EMT-HCC. (G) The mutation rates of TP53 and CTNNB1 in Metab-HCC, Mixed-HCC, and EMT-HCC. (H) The proportion of EMT-HCC in the population across four cohorts, respectively. (I) Kaplan-Meier curves for overall survival (OS) stratified by the three subgroups of HCC in the TCGA-LIHC cohort. (J) Kaplan-Meier curves for OS of EMT-HCC in the TCGA-LIHC cohort. (K) Kaplan-Meier curves for OS of EMT-HCC in the TMA cohort. (L) Kaplan-Meier curves for recurrence-free survival of EMT-HCC in the TMA cohort
Fig. 5
Fig. 5
The activation of fibroblasts in EMT-HCC. (A) The UMAP plot of stromal cells. (B) Stacked bar chart showing the compositions of endothelial cells and fibroblasts in Metab-HCC and EMT-HCC. (C) Stacked bar chart showing the compositions of subclusters of endothelial cells and fibroblasts in Metab-HCC and EMT-HCC. (D) Box plot showing the fraction of subclusters of endothelial cells and fibroblasts in Metab-HCC and EMT-HCC. (E) Immunohistochemistry images showed the number of FAP+ fibroblasts in Metab-HCC and EMT-HCC. (F) The spatial distribution of FAP+ fibroblasts in spatial transcriptome data. (G) The heat map showing numbers of inferred ligand-receptor pairs between all cell types. (H) Network plots showing inferred ligand-receptor interaction activity between EMT-subtype and other cell types. (I) Dot plot showing selected interactions pairs between tumor subtypes and fibroblasts
Fig. 6
Fig. 6
The interaction loop of SPP1-CD44 and CCN2/TGFβ-TGFBR1 between tumor cells and fibroblasts. (A) Transwell assay showed that the conditioned medium of 97H and LM3 significantly recruited LX2 cells. (B) Western blotting assay showed that the conditioned medium of 97H and LM3 significantly promoted the protein level of FAP in LX2 cells. (C) Transwell assay showed that rhSPP1 significantly promoted the recruitment of LX2 cells, while siCD44 reversed this change. (D) Western blotting showed that rhSPP1 significantly promoted the protein level of FAP in LX2 cells, which was reversed by siCD44. (E) Transwell assay showed that ACTLX2-CM significantly promoted the invasive ability of PLC cells. (F) Western blotting assay showed that ACTLX2-CM significantly increased the expression levels of S100A6, N-cadherin, Vimentin and p-Smad3 while decreased the expression levels of E-cadherin in PLC cells. (G) The expression of CCN2 in fibroblasts subclusters from scRNA-HCC cohort. (H) ELISA assay showed high levels of secreted CCN2 within ACTLX2-CM. (I) Multiplexed immunofluorescence images showing the interaction between malignant cells and fibroblasts, based on the CCN2/TGF-β-TGFBR1, using antibodies S100A6, CCN2, TGF-β, TGFBR1, and FAP. (J) Transwell assay showed that FG-3019 reversed the enhanced invasion capacity of PLC cells induced by ACTLX2-CM. (K) Western blotting assay showed that FG-3019 reversed the up-regulated expression of S100A6, N-cadherin, Vimentin, and p-Smad3 and down-regulated expression of E-cadherin induced by ACTLX2-CM. (L) Bioluminescence images of liver tumors (top) and lung metastasis (bottom) of in situ tumor transplantation model. n = 5 for each group. (M) Schematic diagram of the feedback loop between malignant cells and fibroblasts. NC, Normal Control; PLC, PLC/PRF/5 cells; 97H, MHCC97H cells; LM3, HCCLM3 cells; CM, conditioned medium; Veh, siRNA control vehicle; siCD44, CD44 sensitive siRNA; rhSPP1, recombinant human protein SPP1; ACTLX2-CM, Conditioned medium of SPP1-pretreated LX2 cells

References

    1. Sung H, Ferlay J, Siegel RL, Laversanne M, Soerjomataram I, Jemal A, et al. Global Cancer statistics 2020: GLOBOCAN estimates of incidence and Mortality Worldwide for 36 cancers in 185 countries. CA Cancer J Clin. 2021;71(3):209–49. 10.3322/caac.21660 - DOI - PubMed
    1. Simon TG, Roelstraete B, Sharma R, Khalili H, Hagstrom H, Ludvigsson JF. Cancer Risk in patients with biopsy-confirmed nonalcoholic fatty liver disease: a Population-based Cohort Study. Hepatology (Baltimore MD). 2021;74(5):2410–23. 10.1002/hep.31845 - DOI - PMC - PubMed
    1. Hausser J, Alon U. Tumour heterogeneity and the evolutionary trade-offs of cancer. Nat Rev Cancer. 2020;20(4):247–57. 10.1038/s41568-020-0241-6 - DOI - PubMed
    1. Huang A, Zhao X, Yang XR, Li FQ, Zhou XL, Wu K, et al. Circumventing intratumoral heterogeneity to identify potential therapeutic targets in hepatocellular carcinoma. J Hepatol. 2017;67(2):293–301. 10.1016/j.jhep.2017.03.005 - DOI - PubMed
    1. Gao Q, Zhu H, Dong L, Shi W, Chen R, Song Z, et al. Integrated Proteogenomic characterization of HBV-Related Hepatocellular Carcinoma. Cell. 2019;179(2):561–e7722. 10.1016/j.cell.2019.08.052 - DOI - PubMed

MeSH terms

Substances