. 2024 Aug 2;22(1):466.
doi: 10.1186/s12951-024-02740-w.

Injectable hydrogel encapsulating siMMP13 with anti-ROS and anti-apoptotic functions for osteoarthritis treatment

Affiliations

Injectable hydrogel encapsulating siMMP13 with anti-ROS and anti-apoptotic functions for osteoarthritis treatment

Zhongyin Ji et al. J Nanobiotechnology. .

Abstract

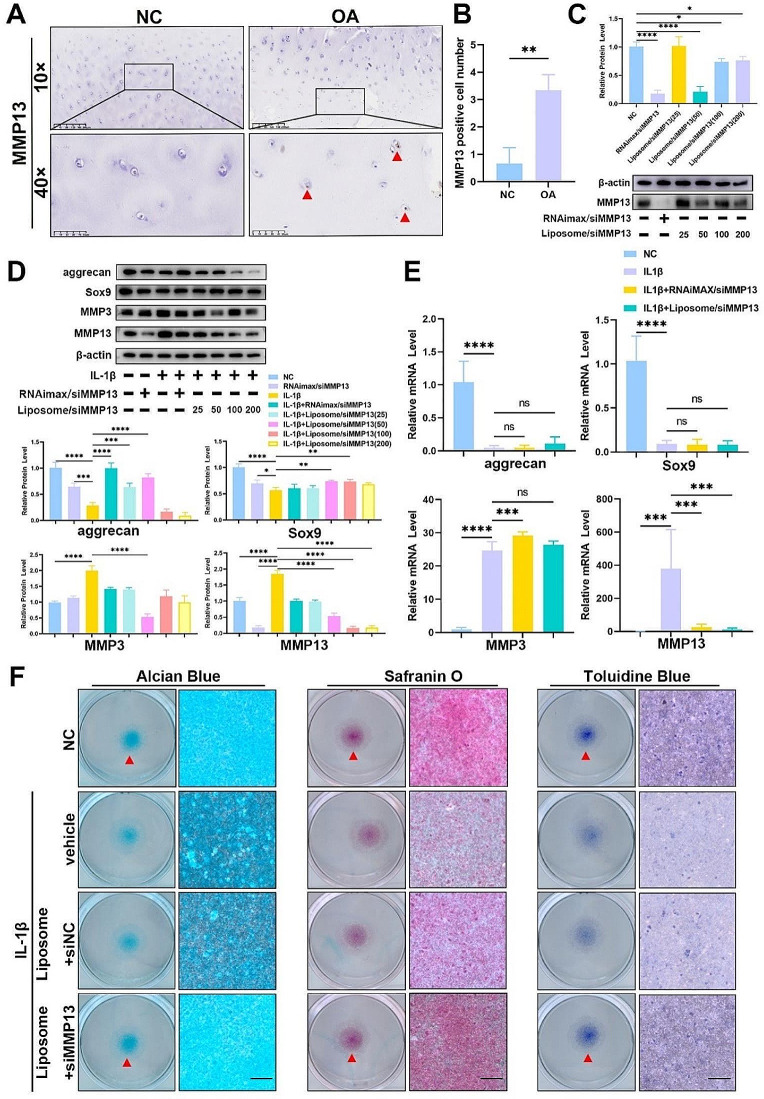
Background: Osteoarthritis (OA) is a degenerative joint disease characterized by the progressive degeneration of articular cartilage, leading to pain, stiffness, and loss of joint function. The pathogenesis of OA involves multiple factors, including increased intracellular reactive oxygen species (ROS), enhanced chondrocyte apoptosis, and disturbances in cartilage matrix metabolism. These processes contribute to the breakdown of the extracellular matrix (ECM) and the loss of cartilage integrity, ultimately resulting in joint damage and dysfunction. RNA interference (RNAi) therapy has emerged as a promising approach for the treatment of various diseases, including hATTR and acute hepatic porphyria. By harnessing the natural cellular machinery for gene silencing, RNAi allows for the specific inhibition of target genes involved in disease pathogenesis. In the context of OA, targeting key molecules such as matrix metalloproteinase-13 (MMP13), which plays a critical role in cartilage degradation, holds great therapeutic potential.

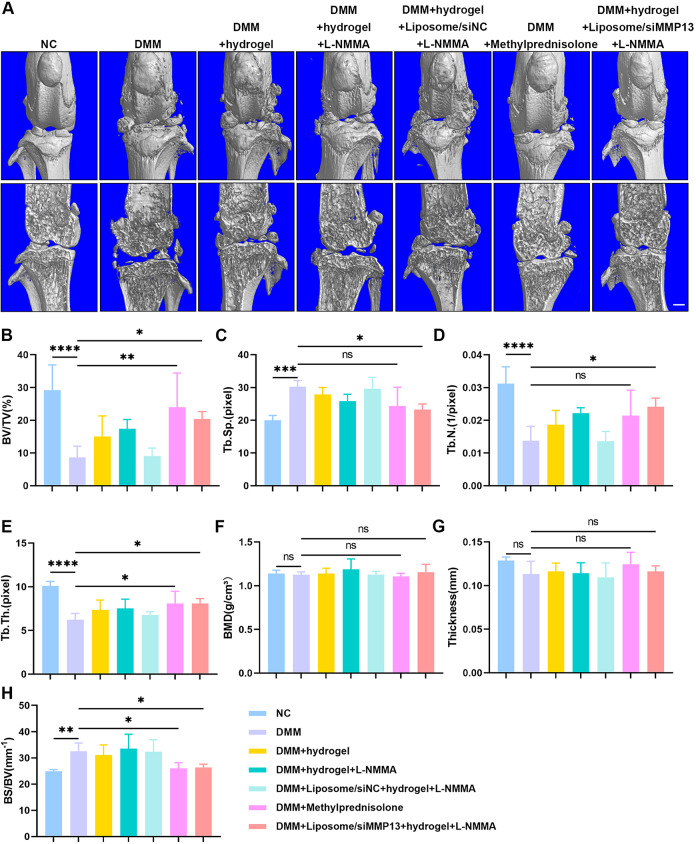
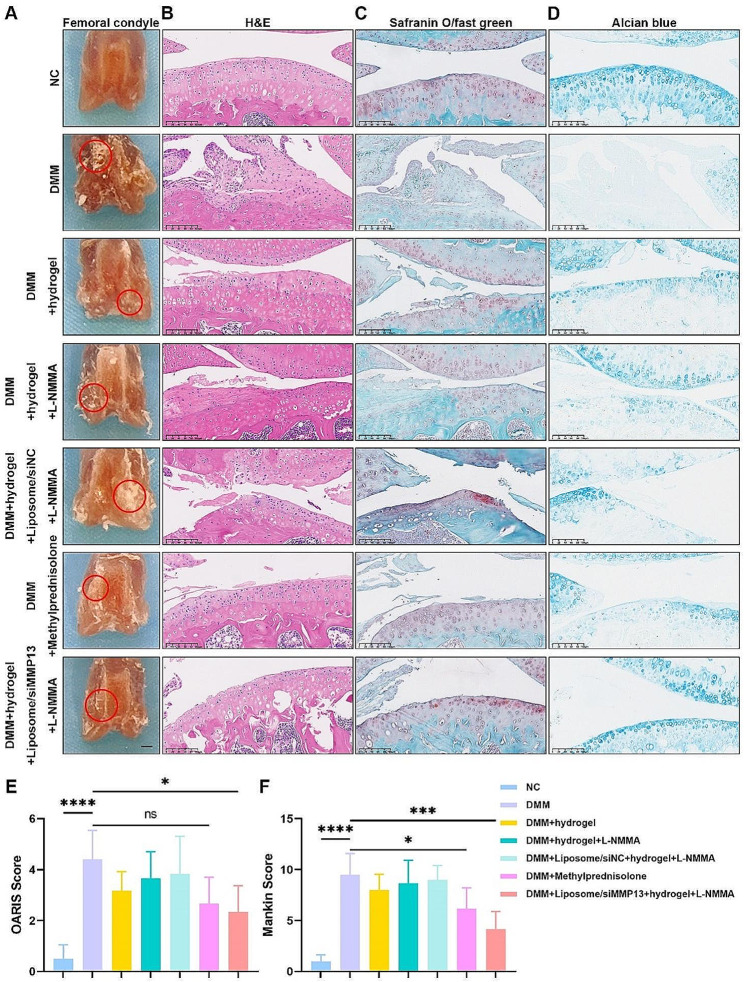
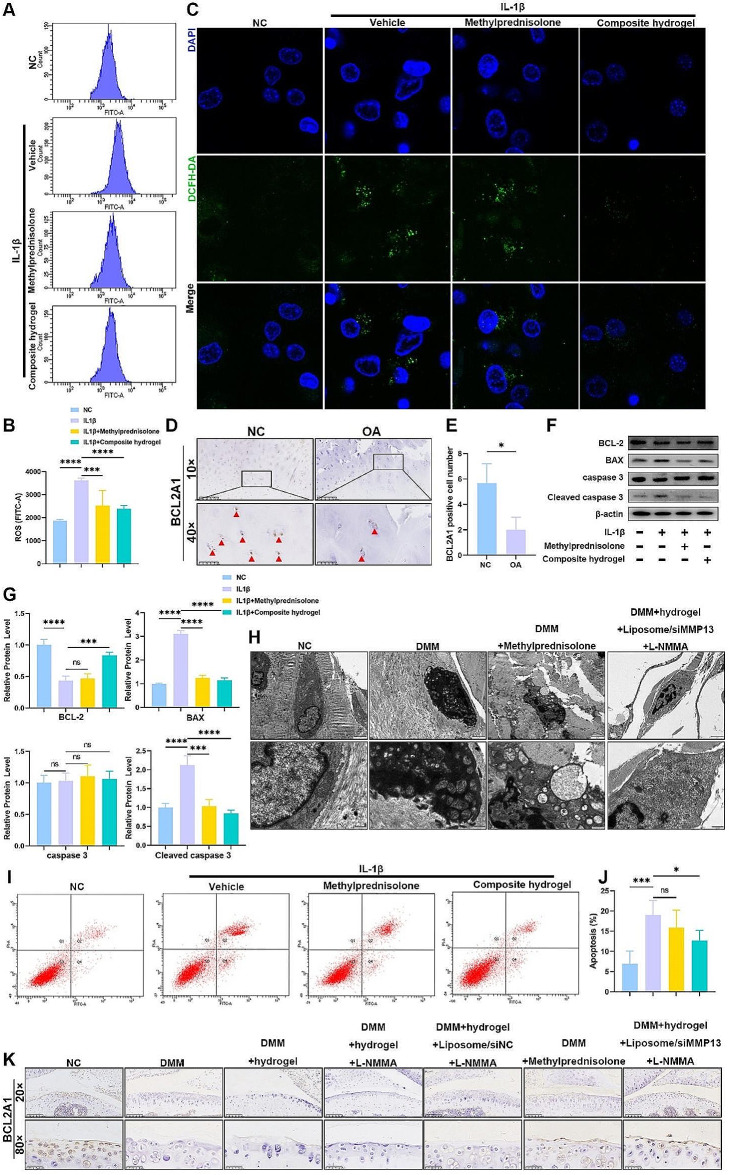
Results: In this study, we developed an innovative therapeutic approach for OA using a combination of liposome-encapsulated siMMP13 and NG-Monomethyl-L-arginine Acetate (L-NMMA) to form an injectable hydrogel. The hydrogel served as a delivery vehicle for the siMMP13, allowing for sustained release and targeted delivery to the affected joint. Experiments conducted on destabilization of the medial meniscus (DMM) model mice demonstrated the therapeutic efficacy of this composite hydrogel. Treatment with the hydrogel significantly inhibited the degradation of cartilage matrix, as evidenced by histological analysis showing preserved cartilage structure and reduced loss of proteoglycans. Moreover, the hydrogel effectively suppressed intracellular ROS accumulation in chondrocytes, indicating its anti-oxidative properties. Furthermore, it attenuated chondrocyte apoptosis, as demonstrated by decreased levels of apoptotic markers.

Conclusion: In summary, the injectable hydrogel containing siMMP13, endowed with anti-ROS and anti-apoptotic properties, may represent an effective therapeutic strategy for osteoarthritis in the future.

Keywords: Apoptosis; Cartilage; Chondrocyte; Hydrogel; Liposome; Osteoarthritis; RNAi; ROS; siMMP13.


Conflict of interest statement

The authors do not have competing interests to declare.

Figures

Fig. 1
Fig. 1
(A) TEM images of liposome/siMMP13. (B) Size distribution of liposome/siMMP13. (C) DLS size measurements of liposome/siMMP13. (D) Zeta potential of liposome/siMMP13. (E) Synthesis scheme of HA-PBA. (F) 1H NMR spectrum of HA-PBA. (G) FTIR spectrum of HA-PBA. Rheological tests of hydrogels by (H) temperature sweep and (I) frequency sweep. (J) F127 and F127/HAPBA hydrogels shear ramps at 37 ℃. (K) siMMP13-FAM release behaviors from hydrogel in DPBS. (L) Degradation behaviors of F127, F127/HAPBA and F127/HAPBA/Liposome hydrogels immersed in DPBS solution for 3 days. Data are expressed as mean ± SD (n = 3)
Fig. 2
Fig. 2
(A) Representative IHC of MMP13 from human tissues of OA patients and non-OA patients. Scale bar, 50 μm (10×), 200 μm (40×). Statistical analysis (n = 3) was presented in (B). (C) WB validation of MMP13 knockdown effect by liposome-encapsulated siRNA at different concentrations in chondrocytes (n = 4). (D) WB validation of aggrecan, Sox9, Adamts5, MMP13, and MMP3 expression levels in chondrocytes post-treatment (n = 4). (E) Real-time Quantitative PCR (qPCR) validation of aggrecan, Sox9, MMP13, and MMP3 expression levels in chondrocytes post-treatment (n = 6). (F) Chondrocytes were subjected to Alcian blue, Safranin O, and Toluidine Blue staining after treatment and cultured at high density. Scale bar, 100 μm. (ns, no significance, *P < 0.05, **P < 0.01, ***P < 0.005, ****P < 0.001)
Fig. 3
Fig. 3
(A) WB validation of iNOS, TNF-α, aggrecan, Sox9, Adamts5, MMP13, and MMP3 expression levels in chondrocytes after treatment with methylprednisolone and composite hydrogel (n = 4). (B) qPCR validation of iNOS, TNF-α, aggrecan, Sox9, MMP13, and MMP3 expression levels in chondrocytes after treatment with methylprednisolone and composite hydrogel (n = 6). (C) ELISA analysis of IL-6 and TNF-α in the supernatant of chondrocytes post-treatment. (n = 6). (D) Schematic diagram of DMM modeling and knee joint injection. (E) Live imaging of MMP 680 fluorescent probe injected into mouse knee joints at 0, 24, and 48 h. Scale bar, 2 mm. The total fluorescence intensity and average fluorescence intensity at 24 h and 48 h were presented in (F) and (G). Data are expressed as mean ± SD (n = 6). (ns, no significance, *P < 0.05, **P < 0.01, ***P < 0.005, ****P < 0.001)
Fig. 4
Fig. 4
(A) The 3D reconstructed images and coronal section images obtained from micro-CT scans of different groups. Scale bar, 1 mm. (B) Bone volume fraction (BV/TV). (C) Trabecular separation (Tb. sp.). (D) Trabecular number (Tb. n.). (E) Trabecular thickness (Tb. Th.). (F) Bone mineral density (BMD). (G) Cortical bone thickness. (H) Bone surface-to‐volume ratio (BS/BV). Data are expressed as mean ± SD (n = 6). (ns, no significance, *P < 0.05, **P < 0.01, ***P < 0.005, ****P < 0.001)
Fig. 5
Fig. 5
(A) Representative gross images of femoral condyles. Scale bar, 1 mm. (B) Representative H&E staining. Scale bar, 200 μm. (C) Representative Safranin O/Fast Green staining. Scale bar, 200 μm. (D) Representative Alcian blue staining. Scale bar, 200 μm. (E) Osteoarthritis Research Society International (OARIS) scores of articular cartilages in seven groups. (F) Mankin scores of articular cartilages in seven groups. Data are expressed as mean ± SD (n = 6). (ns, no significance, *P < 0.05, **P < 0.01, ***P < 0.005, ****P < 0.001)
Fig. 6
Fig. 6
(A) Representative IHC staining of MMP13 from the knee joint of mice in different groups. Quantitative analysis presented in (D). (B) Representative IHC staining of Sox9 from the knee joint of mice in different groups. Quantitative analysis presented in (E). (C) Representative IF staining of Col2 from the knee joint of mice in different groups. Quantitative analysis presented in (F). Data are expressed as mean ± SD (n = 6). Scale bar, 200 μm (20×), 50 μm (80×). (ns, no significance, *P < 0.05, **P < 0.01, ***P < 0.005, ****P < 0.001)
Fig. 7
Fig. 7
(A) Volcano plots of differential gene expression in chondrocytes before and after stimulation by IL-1β. (B) Volcano plot of differential gene expression in chondrocytes responding to IL-1β stimulation before and after treatment with composite hydrogel. (C) Bar chart of GO enrichment for up- and down-regulated genes in chondrocytes before and after stimulation by IL-1β. (D) Bar chart of GO enrichment for up- and down-regulated genes in chondrocytes responding to IL-1β stimulation before and after treatment with composite hydrogel. (E) Top 20 of KEGG enrichment of pathway in chondrocytes before and after stimulation by IL-1β. (F) Top 20 of KEGG enrichment of pathway in chondrocytes responding to IL-1β stimulation before and after treatment with composite hydrogel. (G) WB of PI3K, p-PI3k, Akt, p-Akt, and β-actin (n = 4). (ns, no significance, *P < 0.05, **P < 0.01, ***P < 0.005, ****P < 0.001)
Fig. 8
Fig. 8
(A) Total ROS levels are analyzed by flow cytometry. Quantitative analysis presented in (B) (n = 6). (C) DCFH-DA staining of the intracellular ROS generation. (D) Representative IHC of BCL2A1 from human issues of OA patients and non-OA patients. Scale bar, 50 μm (10×), 200 μm (40×). Quantitative analysis presented in (E) (n = 3). (F) WB of BCL-2, BAX, caspase3, cleaved-caspase3, and β-actin. Quantitative analysis presented in (G) (n = 4). (H) Representative scanning electron microscope images of chondrocytes. (I) Cell apoptosis was analyzed by flow cytometry. Quantitative analysis presented in (J) (n = 6). (K) Representative IHC staining of BCL2A1 from the knee joint of mice in different groups. (ns, no significance, *P < 0.05, **P < 0.01, ***P < 0.005, ****P < 0.001)

References

    1. Barnett R. Osteoarthritis. Lancet (London England). 2018;391:1985. 10.1016/S0140-6736(18)31064-X - DOI - PubMed
    1. Martel-Pelletier J, Barr AJ, Cicuttini FM, Conaghan PG, Cooper C, Goldring MB, et al. Osteoarthr Nat Reviews Disease Primers. 2016;2:16072.10.1038/nrdp.2016.72 - DOI - PubMed
    1. Prieto-Alhambra D, Judge A, Javaid MK, Cooper C, Diez-Perez A, Arden NK. Incidence and risk factors for clinically diagnosed knee, hip and hand osteoarthritis: influences of age, gender and osteoarthritis affecting other joints. Ann Rheum Dis. 2014;73:1659–64. 10.1136/annrheumdis-2013-203355 - DOI - PMC - PubMed
    1. Scanzello CR, Goldring SR. The role of synovitis in osteoarthritis pathogenesis. Bone. 2012;51:249–57. 10.1016/j.bone.2012.02.012 - DOI - PMC - PubMed
    1. Bálint G, Szebenyi B. Diagnosis of osteoarthritis. Guidelines and current pitfalls. Drugs. 1996;52(Suppl 3):1–13. 10.2165/00003495-199600523-00003 - DOI - PubMed

LinkOut - more resources