. 2024 Aug 2;13(1):39.
doi: 10.1186/s40035-024-00427-8.

Neuronal double-stranded DNA accumulation induced by DNase II deficiency drives tau phosphorylation and neurodegeneration

Affiliations

Neuronal double-stranded DNA accumulation induced by DNase II deficiency drives tau phosphorylation and neurodegeneration

Ling-Jie Li et al. Transl Neurodegener. .

Abstract

Background: Deoxyribonuclease 2 (DNase II) plays a key role in clearing cytoplasmic double-stranded DNA (dsDNA). Deficiency of DNase II leads to DNA accumulation in the cytoplasm. Persistent dsDNA in neurons is an early pathological hallmark of senescence and neurodegenerative diseases including Alzheimer's disease (AD). However, it is not clear how DNase II and neuronal cytoplasmic dsDNA influence neuropathogenesis. Tau hyperphosphorylation is a key factor for the pathogenesis of AD. The effect of DNase II and neuronal cytoplasmic dsDNA on neuronal tau hyperphosphorylation remains unclarified.

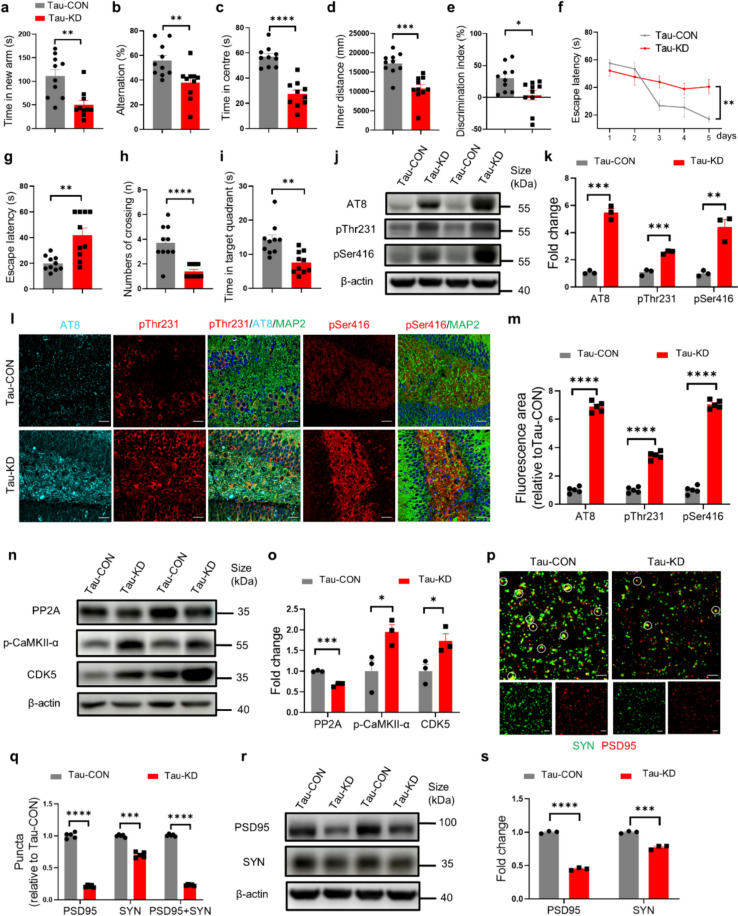
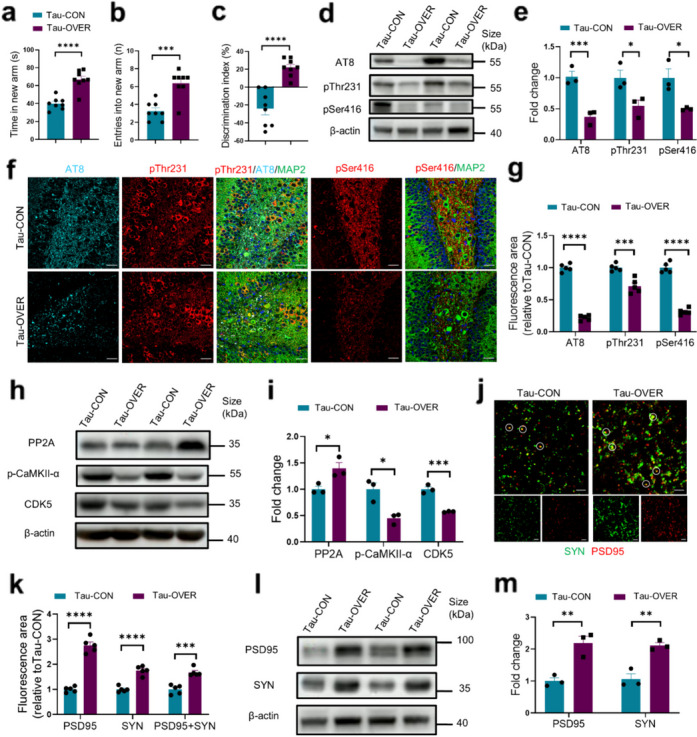
Methods: The levels of neuronal DNase II and dsDNA in WT and Tau-P301S mice of different ages were measured by immunohistochemistry and immunolabeling, and the levels of DNase II in the plasma of AD patients were measured by ELISA. To investigate the impact of DNase II on tauopathy, the levels of phosphorylated tau, phosphokinase, phosphatase, synaptic proteins, gliosis and proinflammatory cytokines in the brains of neuronal DNase II-deficient WT mice, neuronal DNase II-deficient Tau-P301S mice and neuronal DNase II-overexpressing Tau-P301S mice were evaluated by immunolabeling, immunoblotting or ELISA. Cognitive performance was determined using the Morris water maze test, Y-maze test, novel object recognition test and open field test.

Results: The levels of DNase II were significantly decreased in the brains and the plasma of AD patients. DNase II also decreased age-dependently in the neurons of WT and Tau-P301S mice, along with increased dsDNA accumulation in the cytoplasm. The DNA accumulation induced by neuronal DNase II deficiency drove tau phosphorylation by upregulating cyclin-dependent-like kinase-5 (CDK5) and calcium/calmodulin activated protein kinase II (CaMKII) and downregulating phosphatase protein phosphatase 2A (PP2A). Moreover, DNase II knockdown induced and significantly exacerbated neuron loss, neuroinflammation and cognitive deficits in WT and Tau-P301S mice, respectively, while overexpression of neuronal DNase II exhibited therapeutic benefits.

Conclusions: DNase II deficiency and cytoplasmic dsDNA accumulation can initiate tau phosphorylation, suggesting DNase II as a potential therapeutic target for tau-associated disorders.

Keywords: Alzheimer’s disease; DNase II; Double-stranded DNA; Tau phosphorylation; Tauopathy.


Conflict of interest statement

The authors have no conflicts of interest to declare.

Figures

Fig. 1
Fig. 1
Neuronal DNase II is decreased age-dependently in the hippocampus of WT mice, Tau-P301S mice and AD patients. a Immunolabeling of DNase II (red), dsDNA (cyan) and MAP2 (green) in the hippocampus of 4-, 5-, 6-, 8-, 10-, or 12-month-old WT mice. Scale bars, 3 μm. b, c Quantification of DNase II and dsDNA fluorescent areas in (a) by Image J software. n = 5 mice per group. d Immunolabeling of DNase II (red), dsDNA (cyan) and MAP2 (green) in the hippocampus of 3-, 6-, 9-, and 12-month-old Tau-P301S mice. Scale bars, 3 μm. e, f Quantification of DNase II and dsDNA fluorescent areas in (d) by Image J software. n = 5 mice per group. g DNase II levels in plasma samples from healthy control (HC), mild cognitive impairment (MCI) patients and AD patients. n = 13 to 15 samples per group. h Relative mRNA expression of DNase II in the hippocampus of patients with early onset AD cases (EOAD), late onset AD cases (LOAD) and healthy elderly. n = 7 to 20 samples per group. Data are mean ± SEM, Mann–Whitney test. Data in b, c, eg were analyzed with one-way ANOVA followed by Tukey’s multiple comparison test. *P < 0.05, ***P < 0.001, ****P < 0.0001
Fig. 2
Fig. 2
DNase II deficiency promotes tau phosphorylation in primary hippocampal neurons through activation of the CDK5, CaMKII and PP2A signaling pathway. a Representative images of AT8 (red) and pThr231 (red) fluorescence staining in primary hippocampal neurons infected with shDNase2a or shCON. Scale bars, 10 μm. b Quantification of AT8 and pThr231 fluorescent areas in (a) by Image J software. c Western blotting of AT8 and pThr231 in the primary hippocampal neurons infected with shDNase2a or shCON. d Quantitation of the levels of AT8 and pThr231 in (c). e Western blotting of CDK5, Calpain2, p25, p35, CaMKII-α, p-CaMKII-α, PP2A, p-PP2A, CIP2A, GSK-3β, p-GSK-3β, Chk1, p-Chk1, Chk2 and p-Chk2 in the primary hippocampal neurons infected with shDNase2a or shCON. f Quantitation of the bands in (e) by the Image J software. g Representative images of pSer416 (cyan) fluorescence staining in primary hippocampal neurons infected with shDNase2a or shCON. Scale bars, 10 μm. h Quantification of pSer416 fluorescent area in (g) by the Image J software. i Western blotting of pSer416 in the primary hippocampal neurons infected with shDNase2a or shCON. j Quantitation of the levels of pSer416 in (i). In a, c, e, g and i, data are representative of three independent experiments. In b, d, f, h, and j, data were pooled from three independent experiments. Mean ± SEM, unpaired t-test with two-tailed P values was used for statistical analysis. *P < 0.05, **P < 0.01, ***P < 0.001, ****P < 0.0001, ns, not significant
Fig. 3
Fig. 3
DNase II deficiency promotes tau phosphorylation in vivo. a Representative images of AT8 (cyan), pThr231 (red) and pSer416 (red) fluorescence staining in the hippocampal DG region of WT-CON mice and WT-KD mice. Scale bars, 50 μm. b Quantification of AT8, pThr231 and pSer416 fluorescent areas in (a). n = 5 mice per group. c Western blotting of AT8, pThr231 and pSer416 in the hippocampal homogenates of WT-CON mice and WT-KD mice. d Quantitation of the levels of AT8, pThr231 and pSer416 in (c). e The p-tau/total tau ratio in the hippocampal homogenates of WT-CON mice and WT-KD mice measured by electrochemiluminescence assay. In c, data are representative of three independent experiments. In d and e, data were pooled from three independent experiments. Data are presented as mean ± SEM of three independent experiments, and unpaired t-test with two-tailed P values was used for statistical analysis. *P < 0.05, **P < 0.01, ****P < 0.0001
Fig. 4
Fig. 4
Neuronal DNase II deficiency induces cognitive impairment and synaptic loss in WT mice. a Schematic representation of the pharmacological treatment and experimental measurement. b The time spent in the novel arm in the forced Y-maze test. c The alternation in a spontaneous Y-maze. d, e The time spent and distances traveled in the central area of the open field. f Discrimination index in the novel object recognition test. g The latency to find the hidden platform during training trials of MWM test. Data are mean ± SEM, two-way ANOVA followed by Tukey’s multiple comparison test. h The latency to the position of the removed platform during probe trials of MWM test. i The number of platform crossings during probe trials of the MWM test. Mann–Whitney test. j The time spent in the target quadrant during probe trials of MWM test. k Immunolabeling of PSD95 (red) and synaptophysin (SYN) (green) puncta in the brains of WT-CON mice and WT-KD mice. Circles indicate co-localization of PSD95 and SYN puncta. Scale bars, 5 μm. l Quantification of synaptic puncta or their apposition. n = 5 mice per group. m Western blotting of PSD95 and SYN in the hippocampal homogenates of WT-CON mice and WT-KD mice. n Quantitation of the levels of PSD95 and SYN in the brains of mice. In bj, n = 10 mice per group. In m, data are representative of three independent experiments. In n, data are pooled from three independent experiments. In b-f, h, j, l and n, data are presented as mean ± SEM and analyzed with unpaired t-test with two-tailed P values. *P < 0.05, **P < 0.01, ***P < 0.001, ****P < 0.0001
Fig. 5
Fig. 5
Neuronal DNase II deficiency induces tau phosphorylation and exacerbates cognitive impairment and synaptic loss in Tau-P301S mice. a The time spent in the novel arm in forced Y-maze test. b Alternation in the spontaneous Y-maze test. c, d The time spent and distance traveled in the central area of the open field. e Discrimination index in the novel object recognition test. f The latency to find the hidden platform during training trials of MWM test. n = 10 mice per group. g The latency to the position of the removed platform during probe trials of the MWM test. h The number of platform crossings during probe trials of the MWM test. Mann–Whitney test. i The time spent in the target quadrant during probe trials of MWM test. j Western blotting of AT8, pThr231 and pSer416 in the hippocampal homogenates of Tau-CON mice and Tau-KD mice. k Quantitation of the levels of AT8, pThr231 and pSer416 in (j). l Immunolabeling of AT8 (cyan), pThr231 (red) and pSer416 (red) in the hippocampal DG region of Tau-CON mice and Tau-KD mice. Scale bars, 50 μm. m Quantification of AT8, pThr231 and pSer416 fluorescent areas in (l). n = 5 mice per group. n Western blotting of PP2A, p-CaMKII-α and CDK5 in the hippocampus lysates of Tau-CON mice and Tau-KD mice. o Quantitation of the levels of PP2A, p-CaMKII-α and CDK5 in (n). p Immunolabeling of PSD95 (red) and synaptophysin (SYN) (green) puncta in the brains of Tau-CON mice and Tau-KD mice. Circles indicate co-localization of PSD95 and SYN puncta. Scale bars, 5 μm. q Quantification of synaptic puncta or their apposition in (p). n = 5 mice per group. r Western blotting of PSD95 and SYN in the hippocampal homogenates of Tau-CON mice and Tau-KD mice. s Quantitation of the levels of PSD95 and SYN in the brains of mice in (r). In a–i, n = 10 mice per group. In j, n and r, data are representative of three independent experiments. In k, o and s, data are pooled from three independent experiments. Data are presented as mean ± SEM, and analyzed with unpaired t-test with two-tailed P values (ae, g, i, k, m, o, q and s) or two-way ANOVA followed by Tukey’s multiple comparison test (f). *P < 0.05, **P < 0.01, ***P < 0.001, ****P < 0.0001
Fig. 6
Fig. 6
Neuronal DNase II overexpression prevents cognitive deficits and tau phosphorylation in Tau-P301S mice. a, b The time spent and entries in the new arm in forced Y-maze. n = 8 mice per group. c Discrimination index in the novel object recognition test. n = 8 mice per group. d Western blotting of AT8, pThr231 and pSer416 in the hippocampal homogenates of Tau-CON mice and Tau-OVER mice. e Quantitation of the levels of AT8, pThr231 and pSer416 in (d). f Representative images of AT8 (cyan), pThr231 (red) and pSer416 (red) fluorescence staining in the hippocampal DG region of Tau-CON mice and Tau-OVER mice. Scale bars, 50 μm. g Quantification of AT8, pThr231 and pSer416 fluorescent areas in (f). n = 5 mice per group. h Western blotting of PP2A, p-CaMKII-α and CDK5 in the hippocampal homogenates of Tau-CON mice and Tau-OVER mice. i Quantitation of the levels of PP2A, p-CaMKII-α and CDK5 in (h). j Immunolabeling of PSD95 (red) and synaptophysin (SYN) (green) puncta in the brains of Tau-CON mice and Tau-OVER mice. Circles indicate Co-localization of PSD95 and SYN puncta. Scale bars, 5 μm. k Quantification of synaptic puncta or their apposition in (j). n = 5 mice per group. l Western blotting of PSD95 and SYN in the hippocampal homogenates of Tau-CON mice and Tau-OVER mice. m Quantitation of the levels of PSD95 and SYN in the brains of mice in (l). In d, h and l, data are representative of three independent experiments. In e, i and m, data are pooled from three independent experiments. Data are presented as mean ± SEM, and analyzed with unpaired t-test with two-tailed P values (a, c, e, g, i, k, m) or Mann–Whitney test (b). *P < 0.05, **P < 0.01, ***P < 0.001, ****P < 0.0001

References

    1. Lan Yuk Y, Londoño D, Bouley R, Rooney Michael S, Hacohen N. Dnase2a deficiency uncovers lysosomal clearance of damaged nuclear DNA via autophagy. Cell Rep. 2014;9(1):180–92. 10.1016/j.celrep.2014.08.074 - DOI - PMC - PubMed
    1. Chan MP, Onji M, Fukui R, Kawane K, Shibata T, Saitoh S-I, et al. DNase II-dependent DNA digestion is required for DNA sensing by TLR9. Nat Commun. 2015;6(1):5853. 10.1038/ncomms6853 - DOI - PubMed
    1. Matsui H, Ito J, Matsui N, Uechi T, Onodera O, Kakita A. Cytosolic dsDNA of mitochondrial origin induces cytotoxicity and neurodegeneration in cellular and zebrafish models of Parkinson’s disease. Nat Commun. 2021;12(1):3101. 10.1038/s41467-021-23452-x - DOI - PMC - PubMed
    1. Oka T, Hikoso S, Yamaguchi O, Taneike M, Takeda T, Tamai T, et al. Mitochondrial DNA that escapes from autophagy causes inflammation and heart failure. Nature. 2012;485(7397):251–5. 10.1038/nature10992 - DOI - PMC - PubMed
    1. Evans CJ, Aguilera RJ. DNase II: genes, enzymes and function. Gene. 2003;322:1–15. 10.1016/j.gene.2003.08.022 - DOI - PubMed

Publication types

MeSH terms