

Development of thresholds and a visualization tool for use of a blood test in routine clinical dementia practice
- PMID: 39096164
- PMCID: PMC11497719
- DOI: 10.1002/alz.14088
Development of thresholds and a visualization tool for use of a blood test in routine clinical dementia practice
Abstract
Introduction: We developed a multimarker blood test result interpretation tool for the clinical dementia practice, including phosphorylated (P-)tau181, amyloid-beta (Abeta)42/40, glial fibrillary acidic protein (GFAP), and neurofilament light (NfL).
Methods: We measured the plasma biomarkers with Simoa (n = 1199), applied LASSO regression for biomarker selection and receiver operating characteristics (ROC) analyses to determine diagnostic accuracy. We validated our findings in two independent cohorts and constructed a visualization approach.
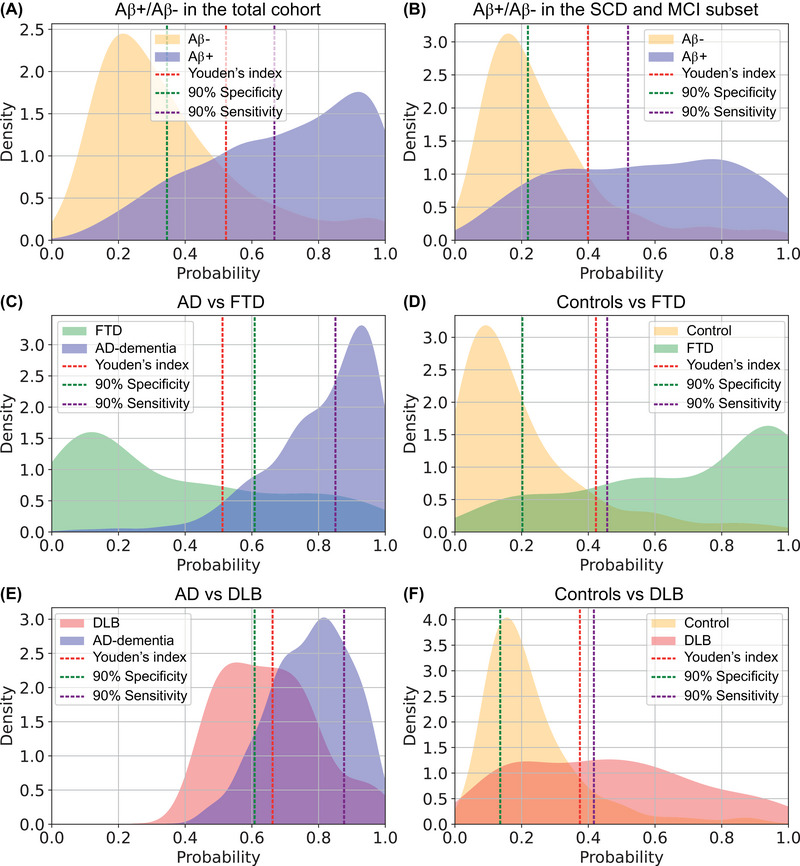
Results: P-tau181, GFAP, and NfL were selected. This combination had area under the curve (AUC) = 83% to identify amyloid positivity in pre-dementia stages, AUC = 87%-89% to differentiate Alzheimer's or controls from frontotemporal dementia, AUC = 74%-76% to differentiate Alzheimer's or controls from dementia with Lewy bodies. Highly reproducible AUCs were obtained in independent cohorts. The resulting visualization tool includes UpSet plots to visualize the stand-alone biomarker results and density plots to visualize the biomarker results combined.
Discussion: Our multimarker blood test interpretation tool is ready for testing in real-world clinical dementia settings.
Highlights: We developed a multimarker blood test interpretation tool for clinical dementia practice. Our interpretation tool includes plasma biomarkers P-tau, GFAP, and NfL. Our tool is particularly useful for Alzheimer's and frontotemporal dementia diagnosis.
Keywords: Alzheimer; biomarker; blood test; dementia; glial fibrillary acidic protein; neurofilament light; phosphorylated tau; plasma.
© 2024 The Author(s). Alzheimer's & Dementia published by Wiley Periodicals LLC on behalf of Alzheimer's Association.
Conflict of interest statement
Jolien Jutte, Maurice Y. Kingma, Sinthujah Vigneswaran, Mariam M.T.E.E. Gouda, Marie‐Paule van Engelen, Claire Chevalier, Moira Marizzoni, Afina W. Lemstra, Yolande A.L. Pijnenburg, Anouk den Braber, and Martijn C. Schut have nothing to disclose. Inge M.W. Verberk received a speaker honorarium from Quanterix, which was paid directly to her institution. Daniel Alcolea received research grants from Pla Estratègic de Recerca i Innovació en Salut (PERIS SLT006/17/125), and from Instituto de Salud Carlos III (PI18/00435, PI22/00611, INT19/00016 and INT23/00048), participated in advisory boards from Fujirebio‐Europe, Roche Diagnostics, Grifols S.A. and Lilly, and received speaker honoraria from Fujirebio‐Europe, Roche Diagnostics, Nutricia, Krka Farmacéutica S.L., Zambon S.A.U. and Esteve Pharmaceuticals S.A. Daniel Alcolea declares a filed patent application (WO2019175379 A1 Markers of synaptopathy in neurodegenerative disease). Javier Arranz received funding from a “Rio Hortega” research grant from the Institute of Health Carlos III. Juan Fortea received research grants from Institute of Health Carlos III, National Institutes of Health, Fundació La Marató de TV3, and Pla Estratègic de Recerca i Innovació en Salut (PERIS). Juan Fortea has served as a consultant for Novartis and Lundbeck, has received honoraria for lectures from Roche, NovoNordisk, Esteve and Biogen and served at advisory boards for AC Immune, Zambon and Lundbeck. Juan Fortea declares a filed patent application (WO2019175379 A1 Markers of synaptopathy in neurodegenerative disease). Alberto Lleó received research grants from CIBERNED, Institute of Health Carlos III, Generalitat de Catalunya (PERIS and AGAUR) and Fundación Tatiana and BBVA. Alberto Lleó participated in advisory boards from Biogen, Eisai, Fujirebio‐Europe, Novartis, NovoNordisk, Nutricia, Otsuka Pharmaceutical, and Zambón, and received speaker honoraria from Lilly, Biogen, KRKA and Zambon. Alberto Lleó declares a filed patent application (WO2019175379 A1 Markers of synaptopathy in neurodegenerative disease). Elsmarieke M. van de Giessen has performed contract research for Heuron Inc. and Roche. Elsmarieke M. van de Giessen has a consultancy agreement with IXICO for the reading of PET scans. All funding is paid directly to her institution. Wiesje M. van der Flier has performed contract research for Biogen MA Inc, and Boehringer Ingelheim. Wiesje M. van der Flier has been an invited speaker at Boehringer Ingelheim, Biogen MA Inc, Danone, Eisai, WebMD Neurology (Medscape), Springer Healthcare. Wiesje M. van der Flier is consultant to Oxford Health Policy Forum CIC, Roche, and Biogen MA Inc. Wiesje M. van der Flier participated in advisory boards of Biogen MA Inc and Roche. All funding is paid to her institution. Wiesje M. van der Flier is a member of the steering committee of PAVE, and Think Brain Health. Wiesje M. van der Flier was associate editor of Alzheimer, Research & Therapy in 2020/2021, and is currently an associate editor at Brain. David Wilson is an employee of Quanterix. Argonde C. van Harten is a member of the advisory board of Brain Research Center. Charlotte E. Teunissen performed contract research for Acumen, ADx Neurosciences, AC‐Immune, Alamar, Aribio, Axon Neurosciences, Beckman‐Coulter, BioConnect, Bioorchestra, Brainstorm Therapeutics, Celgene, Cognition Therapeutics, EIP Pharma, Eisai, Eli Lilly, Fujirebio, Grifols, Instant Nano Biosensors, Merck, Novo Nordisk, Olink, PeopleBio, Quanterix, Roche, Toyama, Vivoryon. Charlotte E. Teunissen is editor in chief of Alzheimer Research and Therapy, and serves on editorial boards of Medidact Neurologie/Springer, and Neurology: Neuroimmunology & Neuroinflammation. Author disclosures are available in the Supporting information.
Figures


References
Publication types
MeSH terms
Substances
Grants and funding
- PI17/01019/Instituto de Salud Carlos III
- Stichting Steun Alzheimercentrum Amsterdam
- 831434/Innovative Medicines Initiatives 3TR
- RF1 AG061566/AG/NIA NIH HHS/United States
- RF1 AG056850/AG/NIA NIH HHS/United States
- 20141210/Marató TV3
- SLT006/17/125/Generalitat de Catalunya
- INT19/00016/Instituto de Salud Carlos III
- PI22/00611/Instituto de Salud Carlos III
- AC19/00103/Instituto de Salud Carlos III
- Noaber Foundation
- 1R01AG056850-01A1/Fondo Europeo de Desarrollo Regional, Unión Europea, "Una manera de hacer Europa" National Institutes of Health
- PI14/01126/Instituto de Salud Carlos III
- R01AG061566/Fondo Europeo de Desarrollo Regional, Unión Europea, "Una manera de hacer Europa" National Institutes of Health
- R21AG056974/Fondo Europeo de Desarrollo Regional, Unión Europea, "Una manera de hacer Europa" National Institutes of Health
- Pasman stichting
- Gieskes-Strijbisfonds
- 101034344/EPND (IMI 2 Joint Undertaking (JU)
- PI18/00435/Instituto de Salud Carlos III
- Alzheimer's Drug Discovery Foundation (ADDF)
- 2017-SGR-547/Generalitat de Catalunya
- #73305095007/ZONMW_/ZonMw/Netherlands
- 860197/Marie Curie International Training Network
- SLT006/17/119/Generalitat de Catalunya
- 044412/Marató TV3
- PI20/01473/Instituto de Salud Carlos III
- PI19/00882/Instituto de Salud Carlos III
- PI17/01896/Instituto de Salud Carlos III
- SLT002/16/408/Generalitat de Catalunya
- PI21/00791/Instituto de Salud Carlos III
- #LSHM20106/Health∼Holland, Topsector Life Sciences & Health
- Stichting Dioraphte
- PI13/01532/Instituto de Salud Carlos III
- R21 AG056974/AG/NIA NIH HHS/United States
- #10510032120003/ZONMW_/ZonMw/Netherlands
- PI18/00335/Instituto de Salud Carlos III
- Stichting Alzheimer Nederland
- PI16/01825/Instituto de Salud Carlos III
- 20142610/Marató TV3
LinkOut - more resources
Full Text Sources
Miscellaneous
