. 2024 Aug 27;43(8):114574.
doi: 10.1016/j.celrep.2024.114574. Epub 2024 Aug 2.

Neurofibrillary tangle-bearing neurons have reduced risk of cell death in mice with Alzheimer's pathology

Affiliations

Neurofibrillary tangle-bearing neurons have reduced risk of cell death in mice with Alzheimer's pathology

Theodore J Zwang et al. Cell Rep. .

Abstract

A prevailing hypothesis is that neurofibrillary tangles play a causal role in driving cognitive decline in Alzheimer's disease (AD) because tangles correlate anatomically with areas that undergo neuronal loss. We used two-photon longitudinal imaging to directly test this hypothesis and observed the fate of individual neurons in two mouse models. At any time point, neurons without tangles died at >3 times the rate as neurons with tangles. Additionally, prior to dying, they became >20% more distant from neighboring neurons across imaging sessions. Similar microstructural changes were evident in a population of non-tangle-bearing neurons in Alzheimer's donor tissues. Together, these data suggest that nonfibrillar tau puts neurons at high risk of death, and surprisingly, the presence of a tangle reduces this risk. Moreover, cortical microstructure changes appear to be a better predictor of imminent cell death than tangle status is and a promising tool for identifying dying neurons in Alzheimer's.

Keywords: Alzheimer’s disease; CP: Neuroscience; neurodegeneration; neurofibrillary tangles; tau; tauopathy; two-photon imaging.


Conflict of interest statement

Declaration of interests B.T.H. has a family member who works at Novartis and owns stock in Novartis; he serves on the SAB of Dewpoint and owns stock. He serves on a scientific advisory board or is a consultant for AbbVie, Avrobio, Axon, Biogen, BMS Cell Signaling, Genentech, Ionis, Novartis, Seer, Takeda, the United States Department of Justice, and Vigil, Voyager. His laboratory is supported by sponsored research agreements with AbbVie and F Prime and research grants from the Cure Alzheimer’s Fund, Tau Consortium, and the JPB Foundation. R.E.B. works on the AbbVie-Hyman Collaboration.

Figures
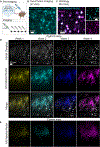
Figure 1.
Figure 1.. Experimental design and analysis methods for tracking individual neurons and the formation of tangles over 4 weeks
(A) Overview of timeline and methods used in these experiments. (B) AAV labeling of neuronal nuclei was visualized in vivo by two-photon microscopy. (C) Immunofluorescence confirms that the nuclear labeling strategy used labels NeuN+ neurons. (D and E) Example of HS-84 tangles and labeled nuclei imaged across 4 weeks (D) in a rTg4510 mouse and AAV-labeled nuclei (E) in a control mouse. Images are color-coded by week.
Figure 2.
Figure 2.. Identifying new neurofibrillary tangle formation in live mice
(A) Image volumes were aligned and cropped to enable quantitative assessment of tangle formation and neuron death across weeks. (B) New tangles were identified based on the appearance of HS-84-labeled objects that were not present the previous week. Image shows labeled neuronal nuclei in magenta, intravenous dextran-labeled blood vessels in red, and tangles in white. Higher magnification images of the boxed area from each week are shown in panels (i–iv). The blue box shows a new tangle appearing on week 3, and the magenta box shows new tangles appearing on week 4. (C) All new tangles were registered and pseudo-colored based on their week of appearance: week 1 (yellow), week 2 (cyan), week 3 (blue), and week 4 (magenta).
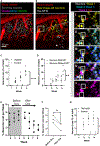
Figure 3.
Figure 3.. Neurofibrillary tangles protect neurons against cell death
(A) All of the labeled neurons were registered to the first week’s data. Neurons that persisted across all weeks are labeled in white, and neurons that disappeared are color-coded based on the week of disappearance: week 2 (green), week 3 (teal), week 4 (magenta). (B) Image of all neurons (yellow) and tangles (white) from week 1. Boxed area is highlighted with higher magnification images of each week (i–iv) showing non-tangle-bearing neurons that disappear between weeks 3 and 4. (v) shows week 4 only, confirming the absence of these neurons. (C) Total neuron loss in rTg4510 mice (black; cohorts 1 and 2, n = 6) and in littermate control mice (gray, cohort 1, n = 4). Mixed effects analysis is of effect of week (p < 0.0001), genotype (p < 0.0001), and week x genotype (p < 0.0001). (D) Comparison of neuron loss in rTg4510 neurons with tangles (gray) and rTg4510 neurons without tangles (black). Plots represent measures of all neurons from cohorts 1 and 2 (rTg4510 mice; n = 6 individuals). Mixed effects analysis effect of week (p < 0.0001), tangle status (p = 0.0037), week x tangle status (p = 0.0002). (E) Neuron loss for n = 3 independent rTg4510 mice (cohort 2) before and after the administration of doxycycline (Dox). (F) Statistical comparison of neurons lost per week in rTg4510 mice (n = 3, cohort 2), using a paired t test to compare the average percent of neurons lost across all weeks before and all weeks after doxycycline (p = 0.016). (G) Total neuron loss in 15-month-old ThyTau22 mice (black, n = 3) and in littermate control mice (gray, n = 4). Mixed effects analysis is of effect of week (p = 0.0065), genotype (p = 0.015), week x genotype (p = 0.0002). Error bars are means ± SE. *p < 0.05, **p < 0.01, and ****p < 0.0001.
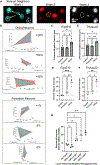
Figure 4.
Figure 4.. Dying neurons show alterations in local microstructure that precede their demise
(A) Disappearing neurons (yellow dashed circle) were identified by their loss of fluorescence across weeks. The distance from the disappearing neurons to its 3-nearest-neighboring neurons (green circle, yellow arrows) was determined regardless of the fate of those nearby neurons. To measure changes over time, we found the center points of 4 nearby persistent neurons (white dashed circle). (B) The center points of nearby persistent neurons were used as vertices to create shapes whose volume change could be measured over time. The cyan polyhedron was made from the center point of nearby neurons from the first week, and the red polyhedron is from the neuron’s position 1 week later. (Top) Representative examples wherein increasing distances between neurons were observed across consecutive weeks before disappearance in rTg4510 mice and (bottom) persistent neuron distances in control mice. (C and E) In rTg4510 (C; cohort 1, one-way ANOVA p = 0.01) and in Thytau22 (E; cohort 3, one-way ANOVA p = 0.007), the average distance between a disappearing neuron and its 3 nearest neighbors during the first week of observation tends to be larger than the average distance for nearby (<30 μm) neurons that are persistent or neurons in control mice. (D) Changes in the volume of the shape formed by the vertices of 4 nearby neurons show that disappearing neurons have a significant increase in the weeks prior to disappearance compared to control neurons and persistent neurons (one-way ANOVA p = 0.0002 and p = 0.0014), while persistent neurons and control neurons do not change in size over time in rTg4510 mice (cohort 1). (F) Dying neurons also changed in volume in ThyTau22 mice when compared to control neurons and persistent neurons (right; cohort 3; one-way ANOVA p = 0.0025 and p = 0.014). (G) Percent of neurons within each rTg4510 mouse that died within the 4 weeks of observation based on comparison to local nearest neighbor distances as cutoff values (one-way ANOVA corrected for multiple comparisons. From left to right, p = 0.9236, 0.1163, 0.0156, and 0.0029). Each point is an independent mouse. Error bars are means ± SE. Asterisks indicate Tukey’s multiple comparisons, *p < 0.05, **p < 0.01, ***p < 0.001, and n.s. = not significant.
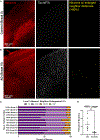
Figure 5.
Figure 5.. Human AD accumulates neurons with enlarged nearest neighbor distance
(A and B) Representative examples of neuron segmentation and nearest neighbor distances from (A) control (n = 5) and (B) AD (n = 6) human inferior temporal gyrus tissue. Images represent Z-projection of neurons stained with HuD (red) and neurofibrillary tangles stained with AT8 (white) through 500-μm tissue slice. Neurons were isolated using Ilastik pixel and object classification, and neurons with >60% enlargement of their 3-nearest-neighbor distance compared to all other neurons within 100 mm are represented in yellow. Non-neuronal objects as determined by the object classification were removed from this visualization. (C) Bar graph showing the proportion of all neurons for each group within that tissue sample. (D) Percent of neurons with >60% enlargement from each tissue sample. Two-tailed t test shows significantly increased number of neurons in this group for AD tissue compared to control tissue (*p = 0.024). Error bars are means ± SE.

References

    1. Bierer LM, Hof PR, Purohit DP, Carlin L, Schmeidler J, Davis KL, and Perl DP (1995). Neocortical neurofibrillary tangles correlate with dementia severity in Alzheimer’s disease. Arch. Neurol. 52, 81–88. 10.1001/archneur.1995.00540250089017. - DOI - PubMed
    1. Arriagada PV, Growdon JH, Hedley-Whyte ET, and Hyman BT (1992). Neurofibrillary tangles but not senile plaques parallel duration and severity of Alzheimer’s disease. Neurology 42, 631–639. 10.1212/wnl.42.3.631. - DOI - PubMed
    1. Braak H, and Braak E (1995). Staging of Alzheimer’s disease-related neurofibrillary changes. Neurobiol. Aging 16, 271–284, discussion 278–284. 10.1016/0197-4580(95)00021-6. - DOI - PubMed
    1. Gomez-Isla T, Hollister R, West H, Mui S, Growdon JH, Petersen RC, Parisi JE, and Hyman BT (1997). Neuronal loss correlates with but exceeds neurofibrillary tangles in Alzheimer’s disease. Ann. Neurol. 41, 17–24. 10.1002/ana.410410106. - DOI - PubMed
    1. Spires TL, Orne JD, Santa-Cruz K, Pitstick R, Carlson GA, Ashe KH, and Hyman BT (2006). Region-specific dissociation of neuronal loss and neurofibrillary pathology in a mouse model of tauopathy. Am. J. Pathol. 168, 1598–1607. 10.2353/ajpath.2006.050840. - DOI - PMC - PubMed

Publication types

LinkOut - more resources