. 2024 Aug 13;57(8):1893-1907.e6.
doi: 10.1016/j.immuni.2024.07.006. Epub 2024 Aug 2.

The amalgam of naive CD4+ T cell transcriptional states is reconfigured by helminth infection to dampen the amplitude of the immune response

Affiliations

The amalgam of naive CD4+ T cell transcriptional states is reconfigured by helminth infection to dampen the amplitude of the immune response

Zachary Even et al. Immunity. .

Abstract

Naive CD4+ T cells in specific pathogen-free (SPF) mice are characterized by transcriptional heterogeneity and subpopulations distinguished by the expression of quiescence, the extracellular matrix (ECM) and cytoskeleton, type I interferon (IFN-I) response, memory-like, and T cell receptor (TCR) activation genes. We demonstrate that this constitutive heterogeneity, including the presence of the IFN-I response cluster, is commensal independent insofar as being identical in germ-free and SPF mice. By contrast, Nippostrongylus brasiliensis infection altered this constitutive heterogeneity. Naive T cell-intrinsic transcriptional changes acquired during helminth infection correlated with and accounted for decreased immunization response to an unrelated antigen. These compositional and functional changes were dependent variables of helminth infection, as they disappeared at the established time point of its clearance in mice. Collectively, our results indicate that the naive T cell pool is subject to dynamic transcriptional changes in response to certain environmental cues, which in turn permutes the magnitude of the immune response.

Keywords: T cells; commensal microbiota; helminth; naive T cell; transcriptional heterogeneity; vaccines.


Conflict of interest statement

Declaration of interests Z.E. is currently a medical student at the University of North Dakota; A.P.M. is a postdoctoral fellow at McGill University; D.A.d.K. is currently a resident at the University of California, San Diego; and Y.W. is currently a postdoctoral fellow at St. Jude Children’s Research Hospital.

Figures
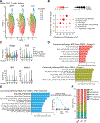
Figure 1.
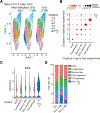
Figure 1.. Constitutive naïve CD4+ T cell transcriptional heterogeneity is independent from commensal microbiota colonization.
scRNAseq of flow cytometry-sorted CD3+CD4+CD8CD62L+CD44B220CD25 T cells. (A) Uniform Manifold Approximation and Projection (UMAP) of splenic naïve CD4+ T cells in each condition. Each dot represents an individual cell and is colored according to cell cluster. (B) Pairwise Jaccard similarity analysis of naïve CD4+ T cell clusters in A and in ElTanbouly et al. (C) Violin plots representing the distribution of normalized expression of Actg1, Klf3, Ifit1 and Nr4a1 by each cell cluster. (D) Significantly enriched categories from GSEA for naïve T cell clusters 0 and 1. (E) GSEA (left) and enrichment score curve for Reactome Interferon Signaling (right) in cluster 3. (F) Percentage of naïve CD4+ T cells in each cluster and condition. Representative of 1 experiment with single cells pooled from 4 mice per group. Please also see Figure S1.
Figure 2.
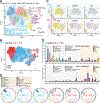
Figure 2.. Constitutive naïve CD4+ T cell transcriptional heterogeneity is modified by helminth infection.
scRNAseq of flow cytometry-sorted CD3+CD4+CD62L+CD44B220CD25CXCR5PD1IL-4-GFPIL21-Kat T cells. (A) Uniform Manifold Approximation and Projection (UMAP) of naïve CD4+ T cells in non-infected (N.i.), 1 week (Wk) or 3 Wk after infection with Nippostrongylus brasiliensis (N.b). Each dot represents an individual cell and is colored according to cell cluster. (B) Pairwise Jaccard similarity analysis of naïve CD4+ T cell clusters in A and those in Figure 1A. (C) Violin plot representing the distribution of normalized expression of IL4ra by each cell cluster upon N.b infection. (D) Percentage of naïve CD4+ T cells assigned to each cluster and condition. Representative of 1 experiment with single cells pooled from 4 mice per group. Please also see Figure S2.
Figure 3.
Figure 3.. Naïve CD4+ T cell transcriptional heterogeneity induced in response to helminth infection is distinct from effector T cell clonal expansion.
scRNAseq of hash-tagged, flow cytometry-sorted CD3+CD4+B220TCRB+ T cells. (A) Uniform Manifold Approximation and Projection (UMAP) of CD4+ T cells in SPF mice (n=3) and after 1 week (Wk) infection with Nippostrongylus brasiliensis (N.b). Each dot represents an individual cell and is colored according to cell cluster. Naïve CD4 T cells cluster names are indicated in light blue. (B) UMAP of all CD4+ T cells in SPF or N.b-infected mice. (C) Expression of indicated genes by CD4+ T cells in SPF (top) and N.b (botton) depicted by UMAP. (D) Percentage of CD4+ T cells in each cluster from SPF or N.b-infected mice (top). Percentage of expanded clonotypes in each cluster from SPF or N.b.-infected mice (bottom). Each data point represents a unique animal. Naïve T cell clusters are within the gray shaded area, effector clusters are within the peach area. ***p<0.001, **p<0.01, *p<0.05. 2-way ANOVA with Holm-Sidak’s multiple comparisons test. Error bars, SEM. (E) Circos plots displaying shared clonotypes within (black) and across (gray) clusters in each individual SPF or N.B-infected mice. Please also see Figure S3.
Figure 4.
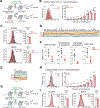
Figure 4.. Helminth infection-induced variegation in naïve CD4+ T cells transcriptional states curbs the response to cognate antigen.
(A) Experimental scheme for (B-F). Naïve CD3+CD4+B220CD25CD44CD62L+ T cells were enriched from spleens of Non-infected (N.i.) or 1 week (Wk) Nippostrongylus brasiliensis (N.b)-infected CD45.2+ OT-II transgenic mice, labeled with CTV and transferred into SPF CD45.1+ recipients. Mice were immunized 24 hours after OT-II T cell transfer with OVA-alum and analyses were performed 4 days later, on cells isolated from draining lymph nodes (LNs). (B) Representative histograms of CTV dilution of CD45.2+CD4+ T cells (left) and quantification of OT-II T cell proliferation (right). (C) Representative histograms and mean fluorescence intensity (MFI) for GATA3 and BCL6 in CD45.2+CD4+ T cells. (D and E) Heatmaps depicting significantly downregulated (D) or upregulated (E) genes in CD45.2+CD4+ OT-II T cells flow cytometry-sorted from draining LNs of OVA-alum immunized recipient mice of N.b-conditioned naïve T cells in comparison to N.i. control naïve T cells and quantified using the nCounter PanCancer Immune Profiling Panel (NanoString Technologies). (F) Pathway score of the dataset represented in (D) and (E). (G-I) Antibiotic (Abx)-treated were sacrificed 28 days after the beginning of the treatment. (G) Experimental scheme for (H-I). Naïve CD4+ T cells were enriched from spleens of N.i. or Abx-treated mice, labeled with CTV and transferred into SPF CD45.1+ recipients. Mice were immunized 24 hours after OT-II T cell transfer with OVA-alum and analyses were performed 4 days later, on cells isolated from draining LNs. (H) Representative histograms of CTV dilution of CD45.2+CD4+ T cells (left) and quantification of OT-II T cell proliferation (right). (I) Representative histograms and mean fluorescence intensity (MFI) for GATA3 and BCL6 in CD45.2+CD4+ T cells. Data in B-C, H-I are representative of two independent experiments. Data in D-F are representative of one experiment where 3–4 mice were used per group. Data were analyzed using 2-way ANOVA with Holm-Sidak’s multiple comparisons test (B and H) or two-tailed Student’s t-test (C, F and I). Each data point represents a unique animal. ****p<0.0001, ***p<0.001, **p<0.01, *p<0.05. n.s. is non-significant. Error bars, SEM. Please also see Figure S4.
Figure 5.
Figure 5.. Helminth infection-induced naïve T cell transcriptional and functional changes are IL-4 dependent.
CD3+CD4+CD62L+CD44B220CD25CXCR5PD1IL-4-GFPIL21-Kat T cells were sorted from mesenteric lymph nodes (mLNs) from Nippostrongylus brasiliensis (N.b)-infected 1 week (Wk) or Non-infected (N.i.) mice. (A) Top20 upregulated genes in cluster 5 in comparison to other clusters from Figure 2. (B) Naïve CD3+CD4+B220CD25CD44CD62L+ T cells were sorted from mesenteric LNs of mice 1 Wk after N.b infection or N.i. control (left) or 1 day after administration of IL-4 complex (IL-4c) or PBS control (right). Volcano plots representing genes differentially regulated at least 2-fold, as determined by RNAseq. Representative of 2 independent experiments each with samples pooled from 4 mice per group. (C) Venn diagram for genes upregulated at least 2-fold in naïve CD4+ T cells from N.b-infected or IL-4c-treated mice in comparison to non-infected or PBS conditions, analyzed using hypergeometric test. (D) mRNA expression of indicated genes in naïve CD4+ T cells stimulated with 20ng/ml of IL-4 by RT-qPCR. Representative of 2 experiments with cells pooled from 4–6 mice. (E) Naïve T cells were pooled from 4–6 mice, stimulated for 6 hours with IL-4, washed and then stimulated for 72 hours with plate bound anti-CD3 and anti-CD28 in the absence (unttd) or presence (IL-4 ttd) of IL-4. Representative histograms of CTV dilution are shown. (F) Naïve CD3+CD4+B220CD25CD44 CD62L+ T cells were sorted from mesenteric LNs of N.i. and N.b-infected 1 Wk mice treated with IL-4 neutralizing antibody or isotype control every 48 hours beginning 2 days before infection. Heatmap depicting the expression of genes upregulated at least 2-fold, 1 Wk post-N.b infection, determined by RNAseq. Representative of 1 experiment with pooled samples from 4 mice per group. (G) Naïve CD4+ T cells were enriched from spleens of N.i. and 1 Wk N.b-infected CD45.2+ OT-II transgenic mice treated with IL-4 neutralizing antibody or isotype control, labeled with CTV and transferred into SPF CD45.1+ recipients. Mice were immunized 24 hours after OT-II T cell transfer with OVA-alum and proliferation of OT-II T cells isolated from draining LNs was assessed 4 days later. (H) Quantification of OT-II T cell proliferation. Data were analyzed using one-way ANOVA (D) or 2-way ANOVA with Holm-Sidak’s multiple comparisons test (H). Each data point represents a unique animal in D and H. ****p<0.0001, ***p<0.001, **p<0.01, *p<0.05. n.s. is non-significant. Error bars, SEM. Please also see Figure S5.
Figure 6.
Figure 6.. Helminth infection-induced naïve T cell transcriptional changes and hypo-responsiveness are reversed upon helminth elimination.
CD3+CD4+B220CD25CD44CD62L+ T cells were sorted from mesenteric LNs of non-infected (N.i.), Nippostrongylus brasiliensis (N.b)-infected 1 week (Wk) and N.b-infected 3 Wk mice. (A and B) Heatmap depicting genes upregulated (A) or downregulated (B) at 7 days, identified by RNAseq. Genes regulated at least 2-fold in naïve CD3+CD4+B220CD25CD44CD62L+ T cells isolated from mesenteric LNs of N.i. mice and after 1 Wk post-infection with N.b are shown. Gene expression is also shown for 3 Wk post-infection. (C) CD3+CD4+B220CD25CD44CD62L+ T cells were enriched from spleens of N.i., N.b 1 Wk, and N.b 3 Wk CD45.2+ OT-II transgenic mice, labeled with CTV and transferred into SPF CD45.1+ recipients. Mice were immunized 24 hours after OT-II T cell transfer with OVA-alum and proliferation of OT-II T cells isolated from draining LNs was assessed 4 days later. (D) Quantification of OT-II T cell proliferation. Data were analyzed using 2-way ANOVA with Holm-Sidak’s multiple comparisons test. Each data point represents a unique animal. ****p<0.0001, **p<0.01. n.s. is non-significant. Error bars, SEM. Please also see Figure S6.

Comment in

References

    1. Aguirre-Gamboa R, Joosten I, Urbano PCM, van der Molen RG, van Rijssen E, van Cranenbroek B, Oosting M, Smeekens S, Jaeger M, Zorro M, et al. (2016). Differential Effects of Environmental and Genetic Factors on T and B Cell Immune Traits. Cell Rep 17, 2474–2487. 10.1016/j.celrep.2016.10.053. - DOI - PMC - PubMed
    1. Brodin P, Jojic V, Gao T, Bhattacharya S, Angel CJ, Furman D, Shen-Orr S, Dekker CL, Swan GE, Butte AJ, et al. (2015). Variation in the human immune system is largely driven by non-heritable influences. Cell 160, 37–47. 10.1016/j.cell.2014.12.020. - DOI - PMC - PubMed
    1. Mangino M, Roederer M, Beddall MH, Nestle FO, and Spector TD (2017). Innate and adaptive immune traits are differentially affected by genetic and environmental factors. Nat Commun 8, 13850. 10.1038/ncomms13850. - DOI - PMC - PubMed
    1. Corse E, Gottschalk RA, and Allison JP (2011). Strength of TCR-peptide/MHC interactions and in vivo T cell responses. J Immunol 186, 5039–5045. 10.4049/jimmunol.1003650. - DOI - PubMed
    1. Beura LK, Hamilton SE, Bi K, Schenkel JM, Odumade OA, Casey KA, Thompson EA, Fraser KA, Rosato PC, Filali-Mouhim A, et al. (2016). Normalizing the environment recapitulates adult human immune traits in laboratory mice. Nature 532, 512–516. 10.1038/nature17655. - DOI - PMC - PubMed

Publication types

MeSH terms

Substances

LinkOut - more resources