. 2024 Jul-Aug;17(4):938-946.
doi: 10.1016/j.brs.2024.07.021. Epub 2024 Aug 2.

Neuromodulation modifies α-synuclein spreading dynamics in vivo and the pattern is predicted by changes in whole-brain function

Affiliations

Neuromodulation modifies α-synuclein spreading dynamics in vivo and the pattern is predicted by changes in whole-brain function

Ehsan Dadgar-Kiani et al. Brain Stimul. 2024 Jul-Aug.

Abstract

Background: Many neurodegenerative disease treatments, such as deep brain stimulation for Parkinson's Disease, can alleviate symptoms by primarily compensating for circuit dysfunctions. However, the stimulation's effect on the underlying disease progression remains relatively unknown. Here, we report that neuromodulation can not only modulate circuit function but also modulate the in vivo spreading dynamics of α-synuclein pathology, the primary pathological hallmark observed in Parkinson's Disease.

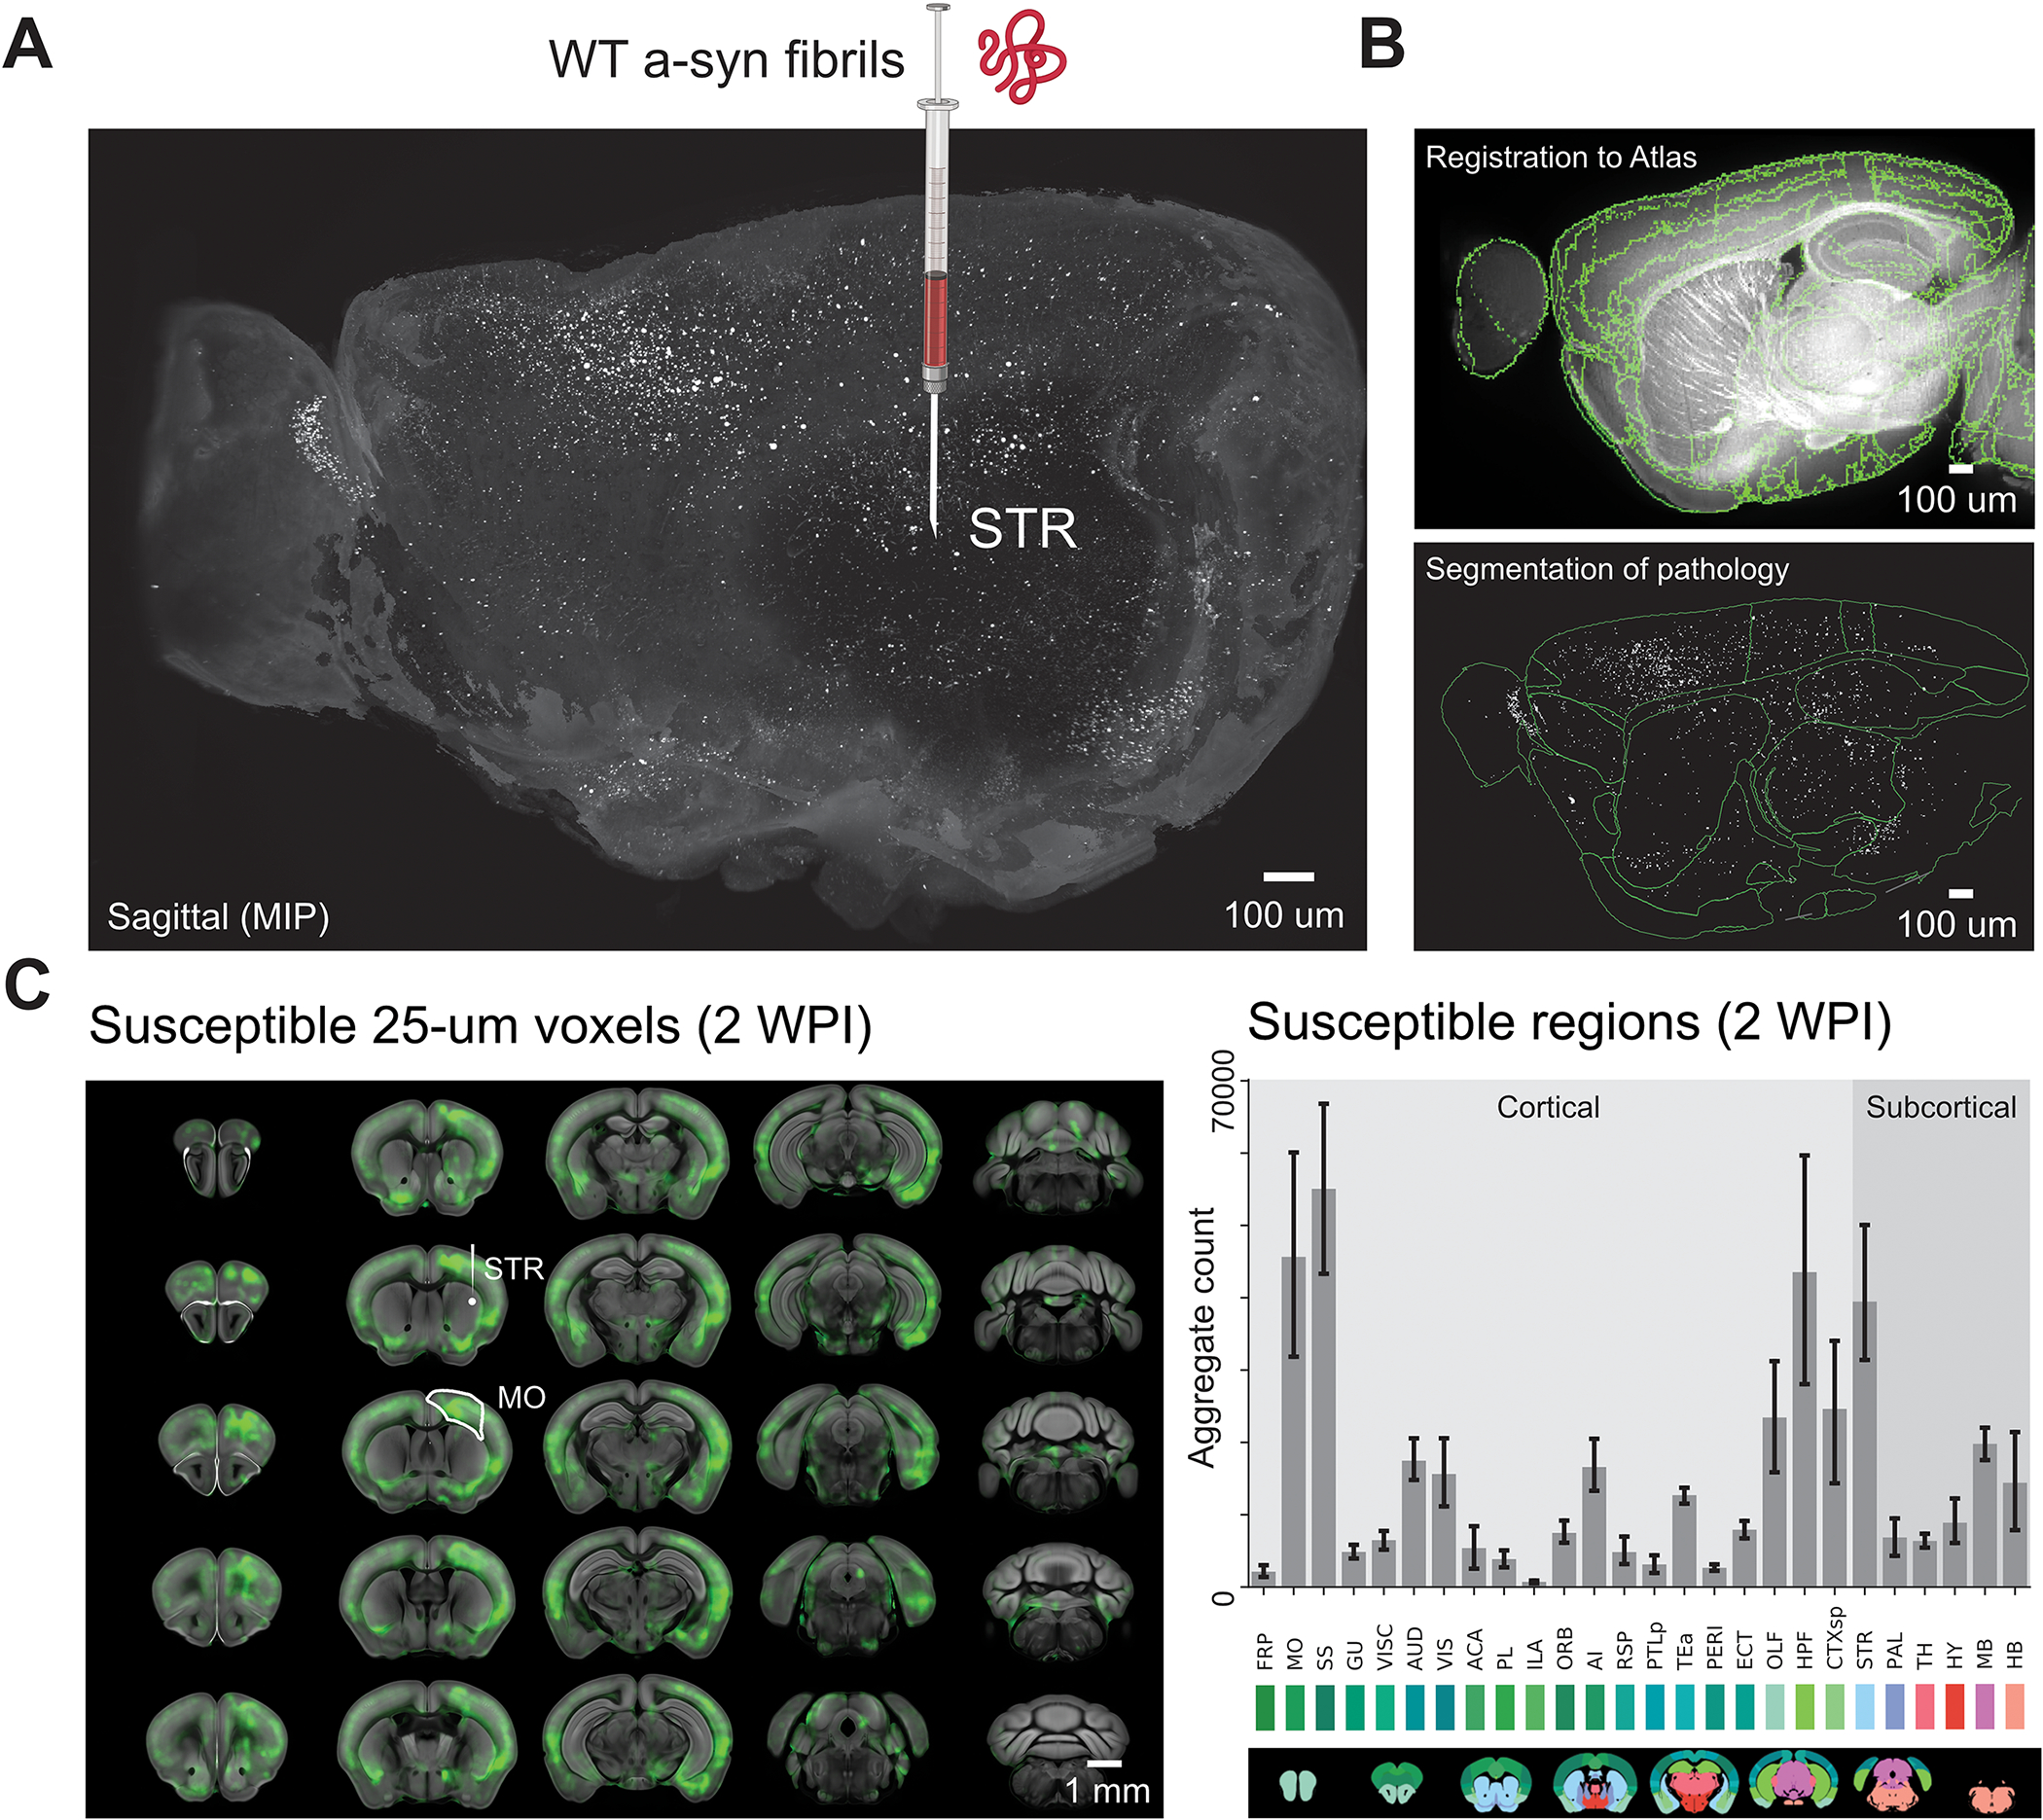
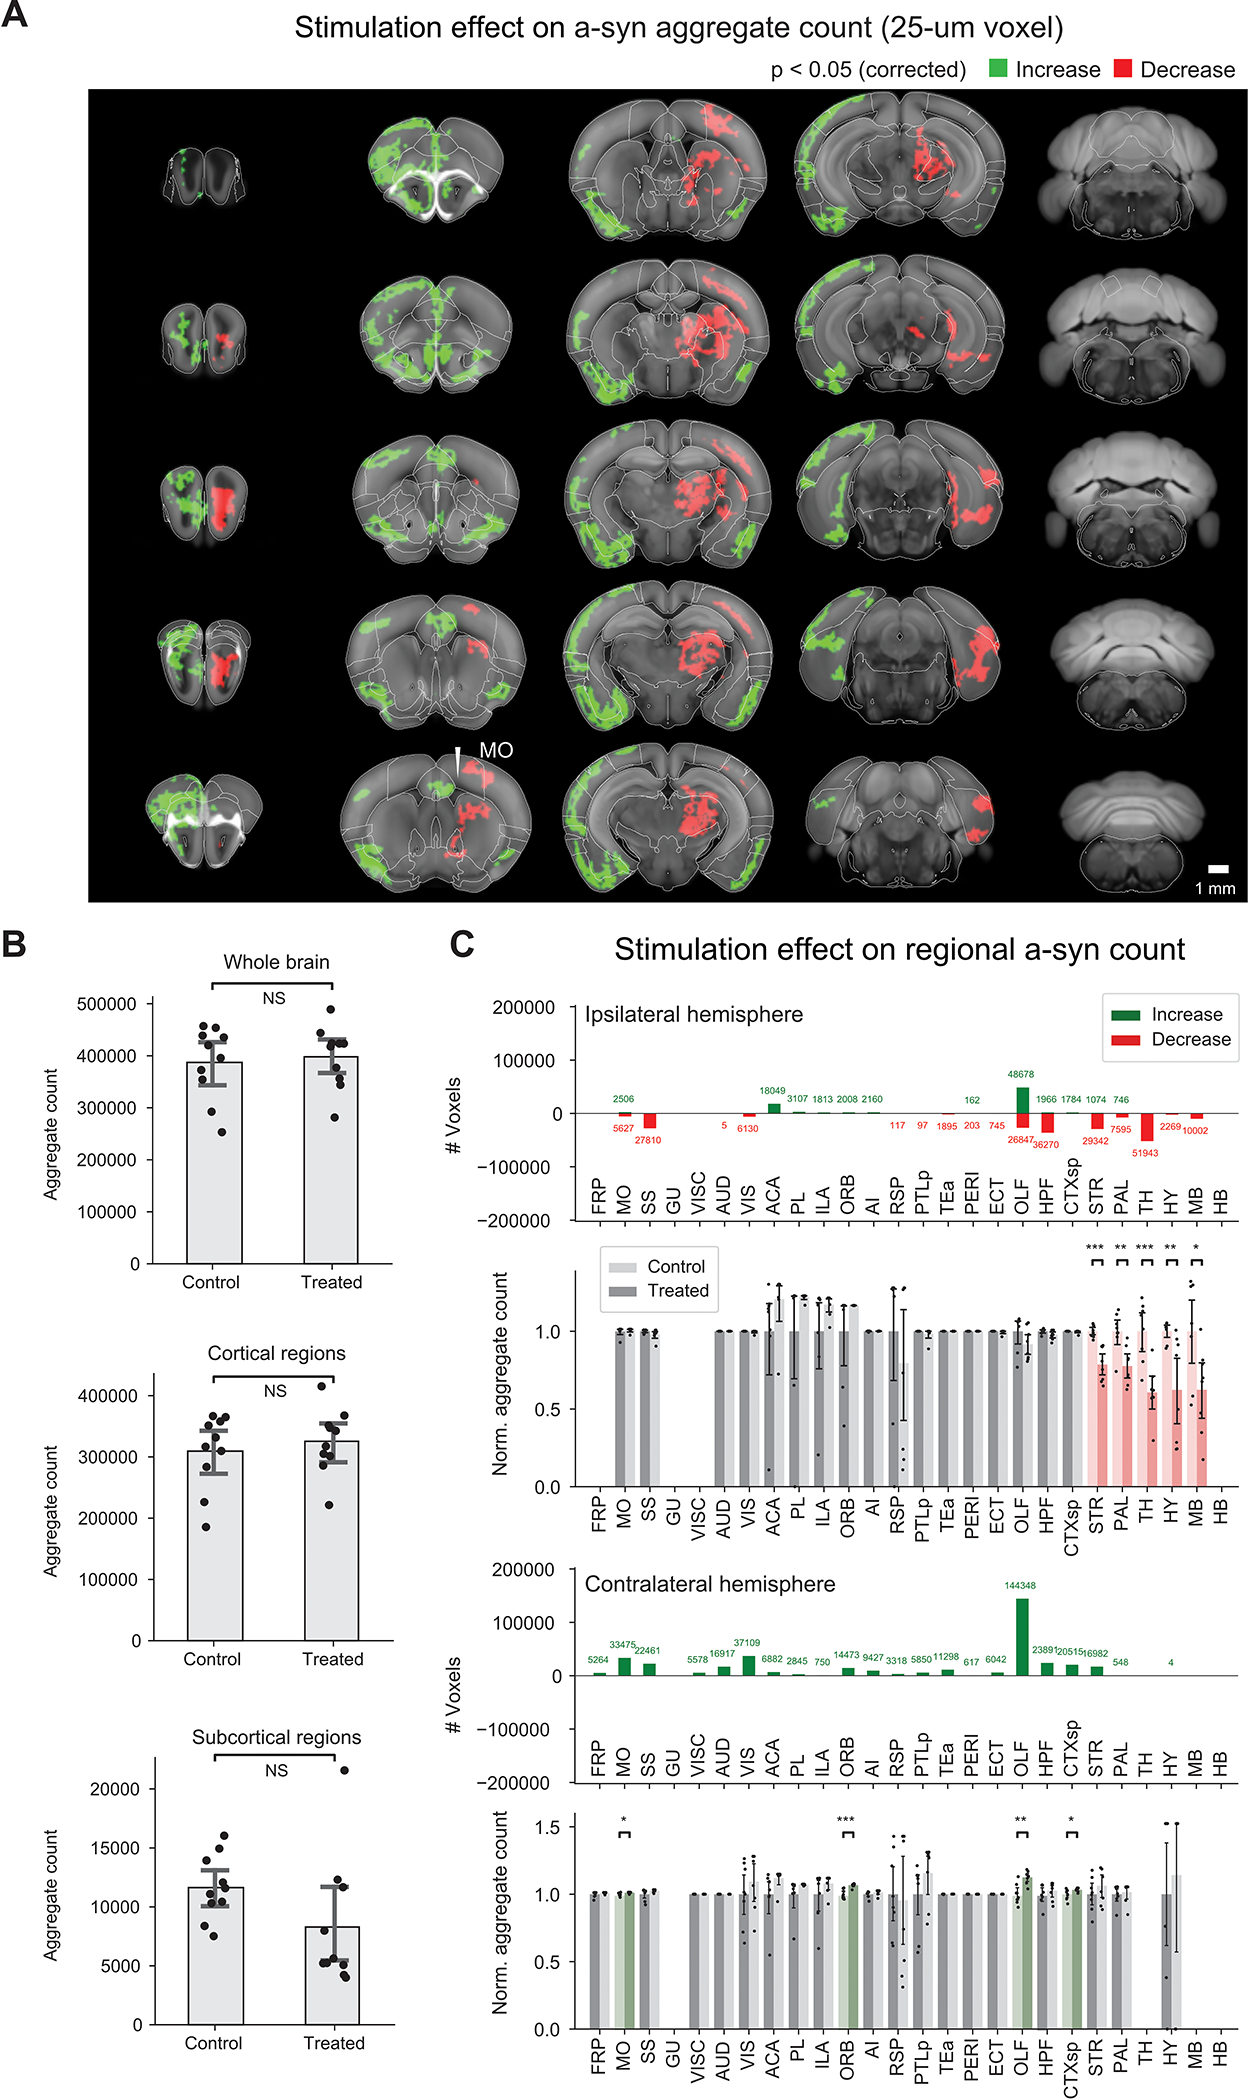
Methods: In a mouse model, pre-formed fibrils were injected into the striatum to induce widespread α-synuclein pathology. Two days after fibril injection, mice were treated for two weeks with daily optogenetic stimulation of the Secondary Motor Area, Layer V. Whole brains were then extracted, immunolabeled, cleared, and imaged with light-sheet fluorescent microscopy.

Results: Repeated optogenetic stimulation led to a decrease in pathology at the site of stimulation and at various cortical and subcortical regions, while the contralateral cortex saw a consistent increase. Aligning the pathology changes with optogenetic-fMRI measured brain activity, we found that the changes in pathology and brain function had similar spatial locations but opposite polarity.

Conclusion: These results demonstrate the ability to modulate and predict whole brain pathology changes using neuromodulation, opening a new horizon for investigating optimized neuromodulation therapies.

Keywords: Circuit function; Neuromodulation; Optogenetics; Parkinson's disease; α-Synuclein.


Conflict of interest statement

Declaration of competing interest J.H.L. is a founder, consultant, and board member of LVIS. The rest of the authors declare no potential conflicts of interest. None of the funding sources played a role in the design, collection, analysis, interpretation of the data, or in the decision to submit the manuscript for publication.

Figures

Figure 1.
Figure 1.. Quantification of α-synuclein pathology following whole brain immunolabeling and clearing informs candidate regions to target for neuromodulation.
(A) Following injection of α-synuclein into the striatum, whole brain tissue-clearing and imaging captures pathological spreading from the striatum to many remote brain regions at 2 WPI. (B) A quantification pipeline performs detection of each aggregate while aligning to the ARA. (C) Regional grouping of α-synuclein spread and comparisons across multiple subjects provides a candidate list of target regions for stimulation, from which the motor areas consistently demonstrate high pathological levels (N = 3, error bar represents a 95% confidence interval).
Figure 2.
Figure 2.. Repeated optogenetic stimulation of motor areas following injection of α-synuclein PFFs into the striatum alters whole brain pathology.
(A) Schematic depicting the experimental paradigm for the injection of α-synuclein PFFs into the striatum and implantation of an optical fiber into the Secondary Motor Area (MOs), followed by daily optogenetic stimulations for two weeks. Each daily stimulation consisted of ten 1-minute stimulation periods with 1-minute rest between each period. The stimulation laser power, ranging from 0.2–1.2 mW, was minimized to only elicit a steady rotational bias in the mice. (B) Maximum intensity projections (MIP) of cleared and labeled brains, alongside zoomed-in cortical sections from the ipsilateral hemisphere, depict the decrease in pathological aggregation from the control to stimulated group.
Figure 3.
Figure 3.. Whole brain quantitative analysis reveals that optogenetic stimulation modulates α-synuclein inclusion count at both the individual voxel and neuroanatomical regional levels.
(A) Statistical comparisons at the voxel-level between the treatment and control group reveal that the pathological aggregate count is significantly decreased in many ipsilateral subcortical clusters and near the site of stimulation, while the aggregate count significantly increases in many contralateral cortical clusters (N = 16, p < 0.05 cluster corrected). (B) Aggregate count across the whole brain, cortical regions, or subcortical regions do not show significant change. (C) The optogenetic stimulation effect quantified across neuroanatomical regions, either by counting the number of significant voxels per region and hemisphere, or by calculating the total aggregate count by region and performing statistical comparisons across treatment and control groups, show results consistent with voxel-level quantifications (N = 16, p < 0.05 corrected using false discovery rate).
Figure 4.
Figure 4.. Whole brain functional activity measured with fMRI during optogenetic stimulation is predictive of downstream pathological changes.
(A) Brain-wide BOLD fMRI was measured during optogenetic stimulation of the Secondary Motor Area (Layer V). (B) BOLD activation map overlaid with statistical changes in pathology as measured by iDISCO show high colocalization between positive BOLD and decrease in aggregate count, while negative BOLD colocalizes with increases in aggregate count. (C) Statistical activation maps depict positive functional activity at the site of stimulation and subcortical regions, and negative activity in the contralateral cortex (N = 3).
Figure 5.
Figure 5.. Variations in optogenetic stimulation timelines reveal distinct spatial modulation patterns of α-synuclein aggregate count.
(A) Statistical comparisons of α-synuclein aggregate count at the voxel-level between treatment and control groups for variations in the optogenetic stimulation timeline. The left map compares a 1-month untreated group with a group that undergoes 2-weeks of no treatment then 2-weeks of treatment (N = 10, p < 0.05 cluster corrected). The right map compares a 1-month untreated group with a group that undergoes 2-weeks of treatment then 2-weeks of no treatment (N = 10, p < 0.05 cluster corrected). (B) This effect was also quantified across neuroanatomical regions, either by counting the number of significant voxels per region and hemisphere, or by calculating the total aggregate count by region and performing statistical comparisons across treatment and control groups.

Similar articles

Cited by

References

    1. Jucker M, Walker LC. Self-propagation of pathogenic protein aggregates in neurodegenerative diseases. Nature 2013;501(7465):45–51. - PMC - PubMed
    1. Oliveira LMA, Gasser T, Edwards R, Zweckstetter M, Melki R, Stefanis L, et al. Alpha-synuclein research: defining strategic moves in the battle against Parkinson’s disease. NPJ Parkinsons Dis 2021;7(1):65. - PMC - PubMed
    1. Goedert M, Spillantini MG, Del Tredici K, Braak H. 100 years of Lewy pathology. Nat Rev Neurol 2013;9(1):13–24. - PubMed
    1. Braak H, Del Tredici K, Bratzke H, Hamm-Clement J, Sandmann-Keil D, Rub U. Staging of the intracerebral inclusion body pathology associated with idiopathic Parkinson’s disease (preclinical and clinical stages). J Neurol 2002;249 Suppl 3:III/1–5. - PubMed
    1. Braak H, Del Tredici K, Rub U, de Vos RA, Jansen Steur EN, Braak E. Staging of brain pathology related to sporadic Parkinson’s disease. Neurobiol Aging 2003;24(2):197–211. - PubMed

LinkOut - more resources