Clinical Trial
. 2024 Aug 4;15(1):6603.
doi: 10.1038/s41467-024-50760-9.

Multiple vaccine comparison in the same adults reveals vaccine-specific and age-related humoral response patterns: an open phase IV trial

Affiliations
Clinical Trial

Multiple vaccine comparison in the same adults reveals vaccine-specific and age-related humoral response patterns: an open phase IV trial

Marieke van der Heiden et al. Nat Commun. .

Abstract

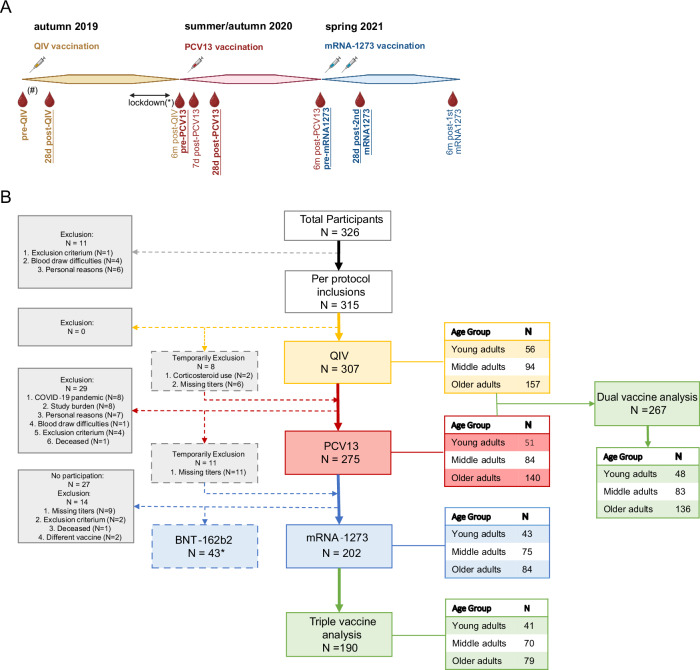
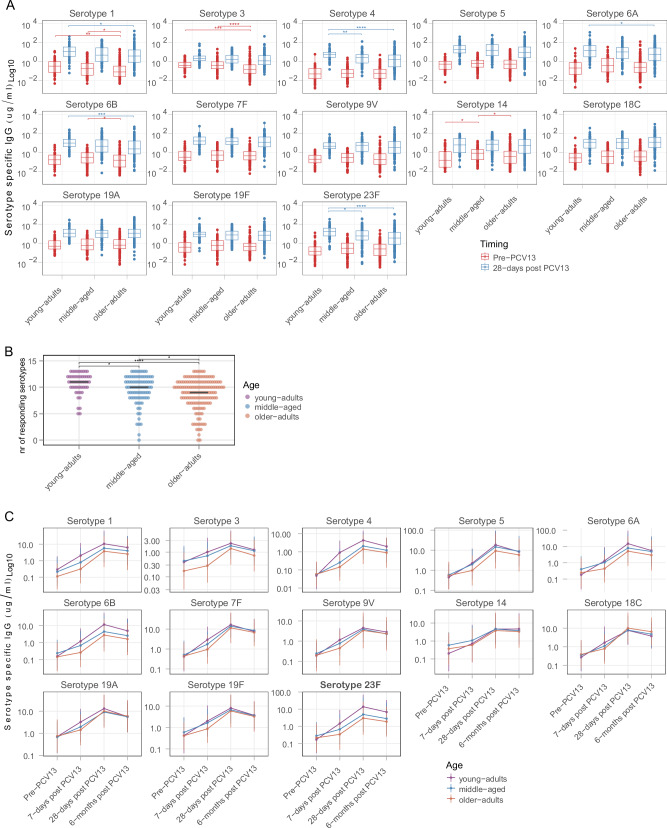
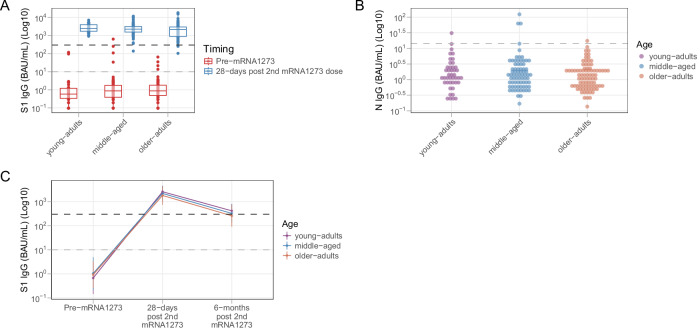
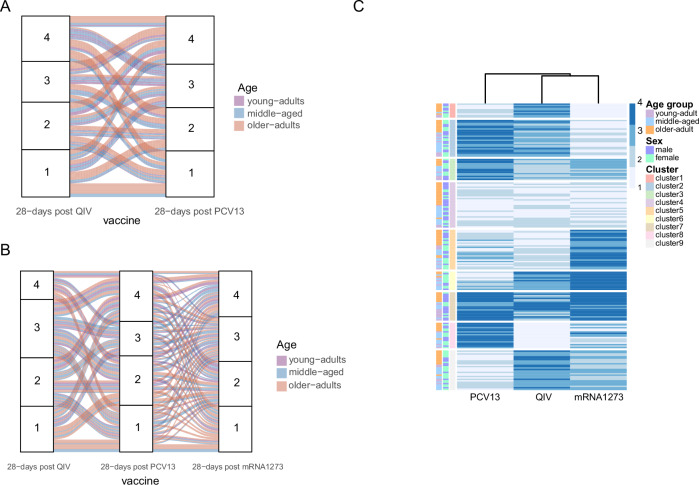
Vaccine responsiveness is often reduced in older adults. Yet, our lack of understanding of low vaccine responsiveness hampers the development of effective vaccination strategies to reduce the impact of infectious diseases in the ageing population. Young-adult (25-49 y), middle-aged (50-64 y) and older-adult ( ≥ 65 y) participants of the VITAL clinical trials (n = 315, age-range: 28-98 y), were vaccinated with an annual (2019-2020) quadrivalent influenza (QIV) booster vaccine, followed by a primary 13-valent pneumococcal-conjugate (PCV13) vaccine (summer/autumn 2020) and a primary series of two SARS-CoV-2 mRNA-1273 vaccines (spring 2021). This unique setup allowed investigation of humoral responsiveness towards multiple vaccines within the same individuals over the adult age-range. Booster QIV vaccination induced comparable H3N2 hemagglutination inhibition (HI) titers in all age groups, whereas primary PCV13 and mRNA-1273 vaccination induced lower antibody concentrations in older as compared to younger adults (primary endpoint). The persistence of humoral responses, towards the 6 months timepoint, was shorter in older adults for all vaccines (secondary endpoint). Interestingly, highly variable vaccine responder profiles overarching multiple vaccines were observed. Yet, approximately 10% of participants, mainly comprising of older male adults, were classified as low responders to multiple vaccines. This study aids the identification of risk groups for low vaccine responsiveness and hence supports targeted vaccination strategies. Trial number: NL69701.041.19, EudraCT: 2019-000836-24.


Conflict of interest statement

T.O. and W.B. are employees of the GSK group of companies. W.B. holds shares in the GSK group of companies. All other authors declare no competing interests.

Figures

Fig. 1
Fig. 1. Cohort timeline and participants flow chart.
A Timeline of vaccination cohort with blood drawing timepoints from which samples are used in this reported indicated. The samples used for the primary endpoint analysis (per vaccine) are indicated in bold and underlined. (#) Pre-QIV blood sampling started in summer 2019, while vaccination started in autumn 2019, when the vaccine was available. (*) The SARS-CoV-2 pandemic lockdown caused a temporary interruption of the trial. N = 40 participants were sampled before the lockdown. For the other participants, the 6 months post-QIV vaccination timepoint was extended up to 12 months. Sampling and PCV13 vaccination started again in summer/autumn 2020. Created with Biorender.com (B) Participants flow chart indicating the number and age of participants included in the primary endpoint analyses of the different arms of the cohort. Exclusions are divided into definite and temporarily exclusions and reasons for exclusion are given. (*) A large group of older participants was excluded for mRNA-1273 vaccination, due to administration of prior COVID-19 vaccination in the general vaccination program of the Netherlands in winter 2021. This group is analyzed separately as BNT162b2 study group.
Fig. 2
Fig. 2. The QIV vaccination induced HI titers.
The pre-QIV and 28 days post-QIV vaccination H3N2 (A) and H1N1 (B) specific HI GMT titers split by age group (young adults n = 56, middle-aged adults n = 94, older adults n = 157). The boxplots indicate the median and interquartile range. All individual values, from min to max, are plotted behind the boxplot. The pre- and post-vaccination timepoints were compared between the different age groups with the Kruskall–Wallis test and corrected for multiple comparisons with Bonferroni correction. *p < 0.05, **p < 0.01, ***p < 0.001, ****p < 0.0001. The exact p-values at the 28 days post-vaccination time are: YA vs MA: p-value = 0.002, YA vs OA: p-value < 0.0001. C The long-term H3N2-specific HI titers per age groups plotted at the timepoint of sampling. D The longitudinal H3N2 HI-specific titers. The lines indicate the mean and standard error of the mean. In both (C and D) n = 52 young adults, n = 87 middle-aged adults, and n = 142 older adults were included and for clarity reasons, no statistics are indicated in these graphs. The gray dotted lines indicate an HI titer of 40, the cut-off level for protection. Source data are provided as a Source data file.
Fig. 3
Fig. 3. PCV13 vaccination induced pneumococcal serotype-specific IgG concentrations.
A The pre- and 28 days post- PCV13 vaccination pneumococcal serotype-specific IgG concentrations (ug/mL) (presented on a log10 scale) split by age group (young adults n = 51, middle-aged adults n = 84, older adults n = 140). The boxplots indicate the median and interquartile range. All individual values, from min to max, are plotted behind the boxplot. Per timepoint, the antibody concentrations are statistically compared between the 3 different age groups with the Kruskall–Wallis test and corrected for multiple comparisons with Bonferroni correction. The exact p-values at the 28 days post-vaccination timepoint comparing YA and OA: serotype 1: p = 0.008, 4: p < 0.0001, 6A: p = 0.007, 6B: p = 0.0002, 23 F: p = 0.0001 and comparing YA and MA: serotype 4: p = 0.002, 23 F: p = 0.01. *p < 0.05, **p < 0.01, ***p < 0.001, ****p < 0.0001. B Comparison of the number of pneumococcal serotypes an individual is responding to 28 days post-PCV13 vaccination based on a serotype-specific IgG concentration of ≥1.3 µg/mL and an at least 2-fold increase as compared to the pre-vaccination timepoint between the different age groups (young adults n = 51, middle-aged adults n = 84, older adults n = 140). The black lines indicate the median. The different age groups are compared with the Kruskall–Wallis test and corrected for multiple comparisons with Bonferroni correction. *p < 0.05, **p < 0.01, ***p < 0.001, ****p < 0.0001. The exact p-values are: MA vs YA: p = 0.027, OA vs YA: p < 0.0001. C The longitudinal (pre-, 7 days, 28 days, and 6 months post PCV12 vaccination) pneumococcal strain-specific IgG concentrations split by the different age groups (young adults n = 45, middle-aged adults n = 78, and older adults n = 134). The lines indicate the mean and standard error of the mean. Source data are provided as a Source data file.
Fig. 4
Fig. 4. The mRNA-1273 vaccination induced Spike S1-specific IgG concentrations.
A The pre- and 28- days post 2nd mRNA-1273 vaccination Spike S1-specific IgG concentrations (BAU/mL) (presented on a log10 scale) split by age group (young adults n = 43, middle-aged adults n = 75, older adults n = 84). The boxplots indicate the median and interquartile range. All individual values, from min to max, are plotted behind the boxplot (B) The nucleocapsid (N) specific IgG concentrations (BAU/mL) at the pre-vaccination timepoint compared between the different age groups. The dotted line indicated the N-specific cut-off for seropositivity (14.3 BAU/mL). C The longitudinal (pre-, 28 days, and 6 months post 2nd mRNA-1273 vaccination) S1-specific IgG concentrations split by the different age groups (young adults n = 41, middle-aged adults n = 73, and older adults n = 82). The lines indicate the mean and standard error of the mean. No statistics are indicated in this graph. In both (A and C), the gray dotted line (S1-specific IgG = 10 BAU/mL) indicates the cut-off for seropositivity. The black dotted line (S1-specific IgG = 300 BAU/mL) indicates the cut-off for a high response. Source data are provided as a Source data file.
Fig. 5
Fig. 5. Multiple vaccine responsiveness.
A Dual (QIV and PCV13) and B Triple (QIV, PCV13, and mRNA-1273) vaccine responsiveness. The 28 days post-vaccination antibody titers are divided into quartiles, where number 1 indicated the lowest and number 4 the highest quartile of responders. Per vaccine, each individual is assigned to a quartile based on the 28 days post-vaccine antibody concentration. Every line indicates the trajectory of an individual between the different vaccines indicated. The line color indicated the age group of an individual. C Hierarchical clustering of all individuals based on the response scores for all three vaccines. The scores indication ranges from gray (low,1) to dark blue (high, 4). Age group, sex, and cluster number are depicted in the different colors on the left side of the heatmap. In (A): young adults n = 48, middle-aged adults n = 83, and older adults n = 136, and in (B, C) young adults n = 41, middle-aged adults n = 70, and older adults n = 79. Source data are provided as a Source data file.

References

    1. Pollard, A. J. & Bijker, E. M. A guide to vaccinology: from basic principles to new developments. Nat. Rev. Immunol.21, 83–100 (2021). 10.1038/s41577-020-00479-7 - DOI - PMC - PubMed
    1. Chang, A. Y., Skirbekk, V. F., Tyrovolas, S., Kassebaum, N. J. & Dieleman, J. L. Measuring population ageing: an analysis of the Global Burden of Disease Study 2017. Lancet Public Health4, e159–e167 (2019). 10.1016/S2468-2667(19)30019-2 - DOI - PMC - PubMed
    1. Rappuoli, R., Mandl, C. W., Black, S. & De Gregorio, E. Vaccines for the twenty-first century society. Nat. Rev. Immunol.11, 865–872 (2015).10.1038/nri3085 - DOI - PMC - PubMed
    1. Niederman, M. S. et al. Efficacy and effectiveness of a 23-valent polysaccharide vaccine against invasive and noninvasive pneumococcal disease and related outcomes: a review of available evidence. Expert Rev. Vaccines20, 243–256 (2021). 10.1080/14760584.2021.1880328 - DOI - PubMed
    1. van den Hoogen, L. L. et al. Reduced antibody acquisition with increasing age following vaccination with BNT162b2: results from two longitudinal cohort studies in The Netherlands. Vaccines10, 1480 (2022). 10.3390/vaccines10091480 - DOI - PMC - PubMed

Publication types

MeSH terms