. 2024 Aug 3;10(1):348.
doi: 10.1038/s41420-024-02119-8.

A testis-specific lncRNA functions as a post-transcriptional regulator of MDM2 and stimulates apoptosis of testicular germ cell tumor cells

Affiliations

A testis-specific lncRNA functions as a post-transcriptional regulator of MDM2 and stimulates apoptosis of testicular germ cell tumor cells

Saya Ito et al. Cell Death Discov. .

Abstract

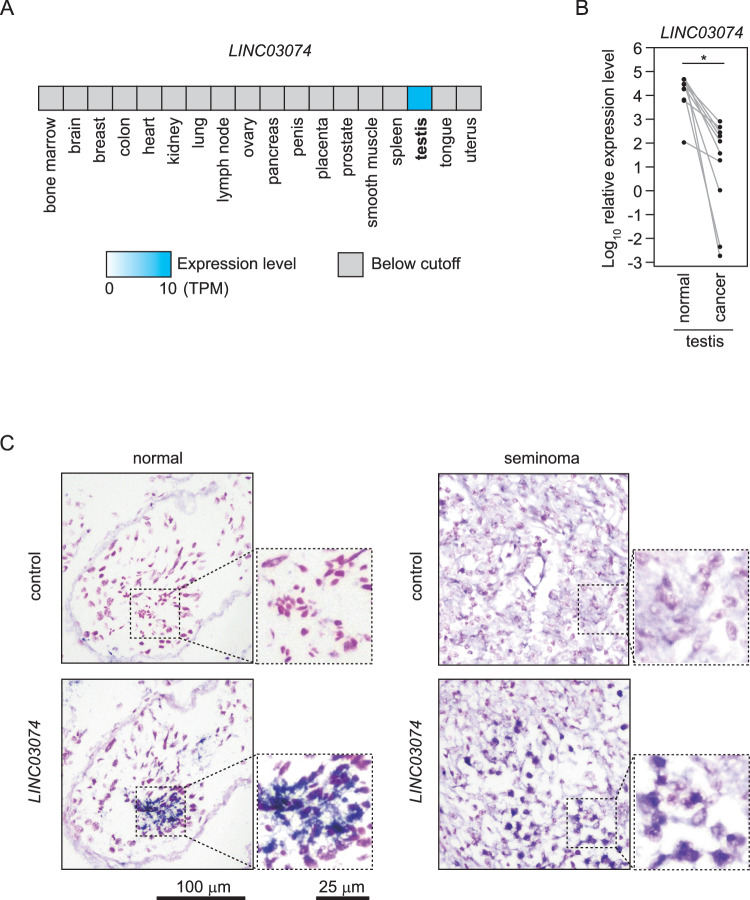
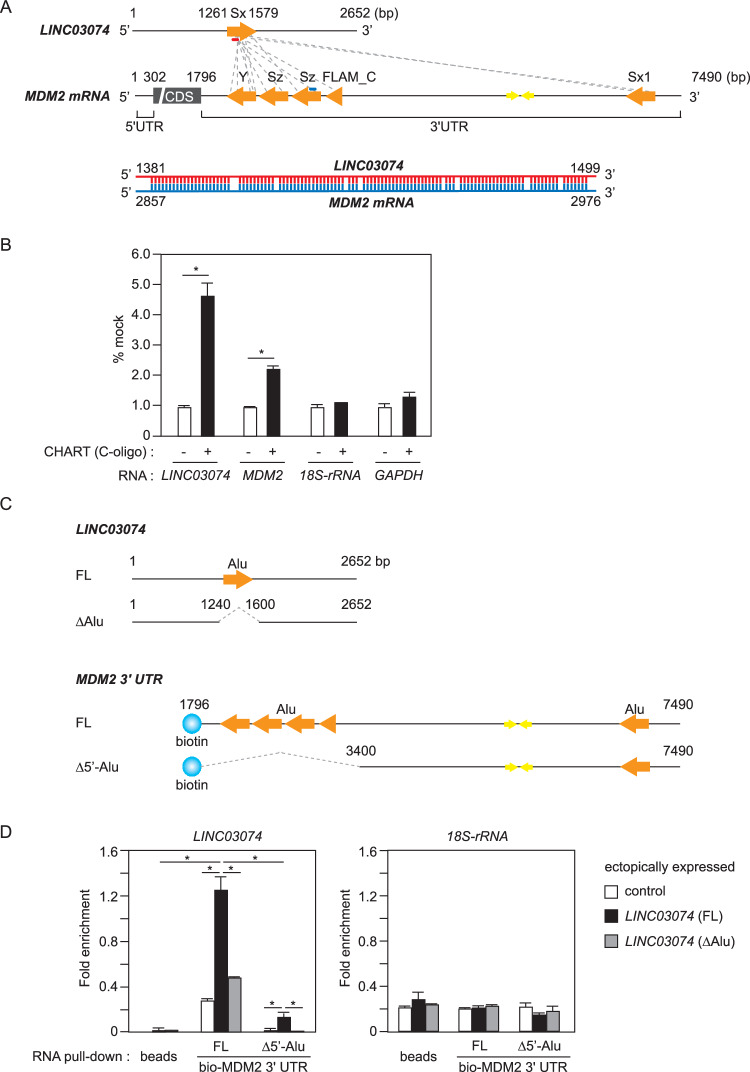
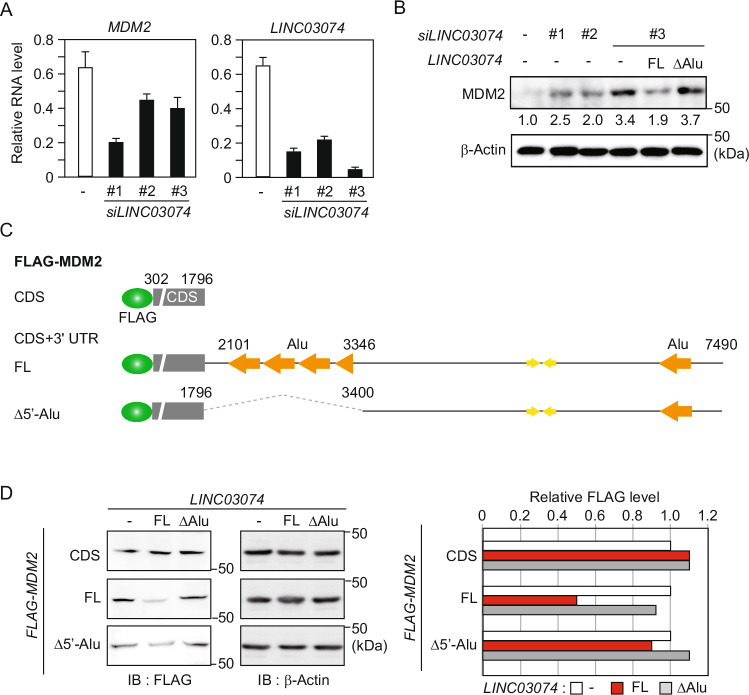
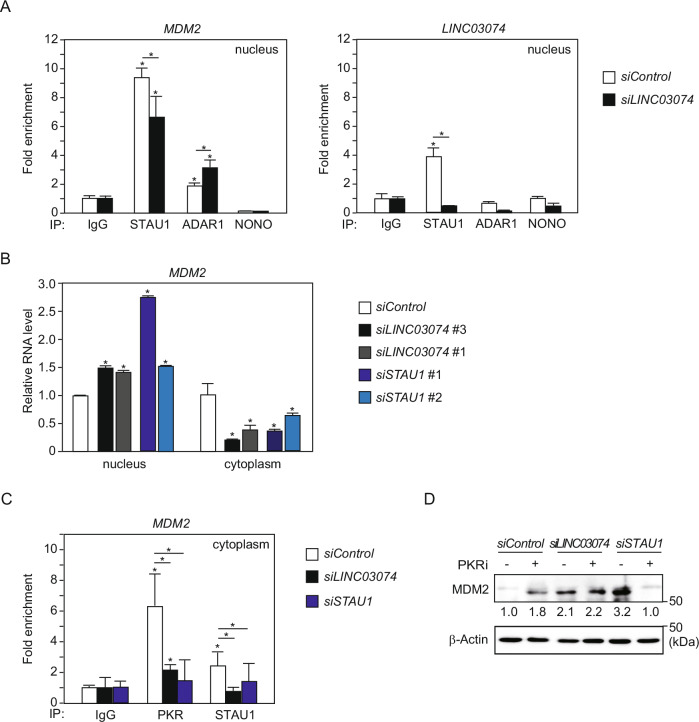
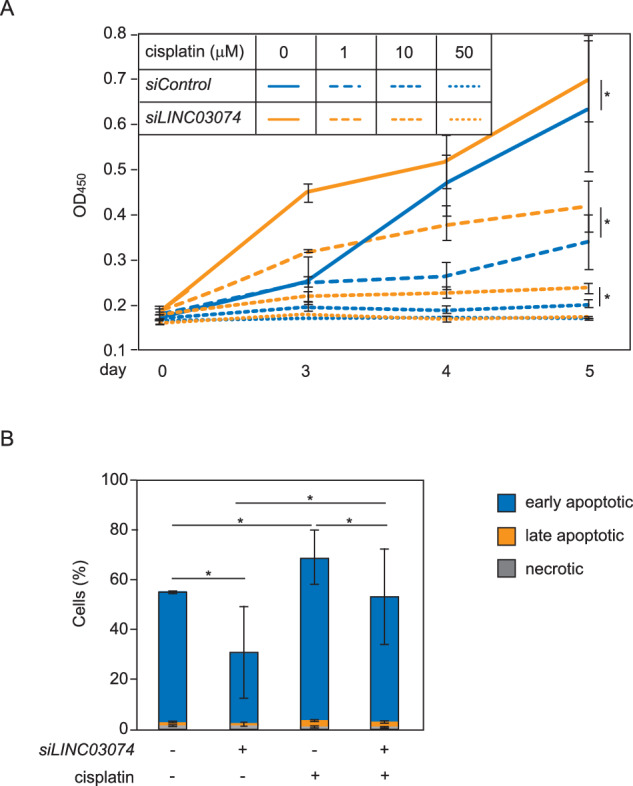
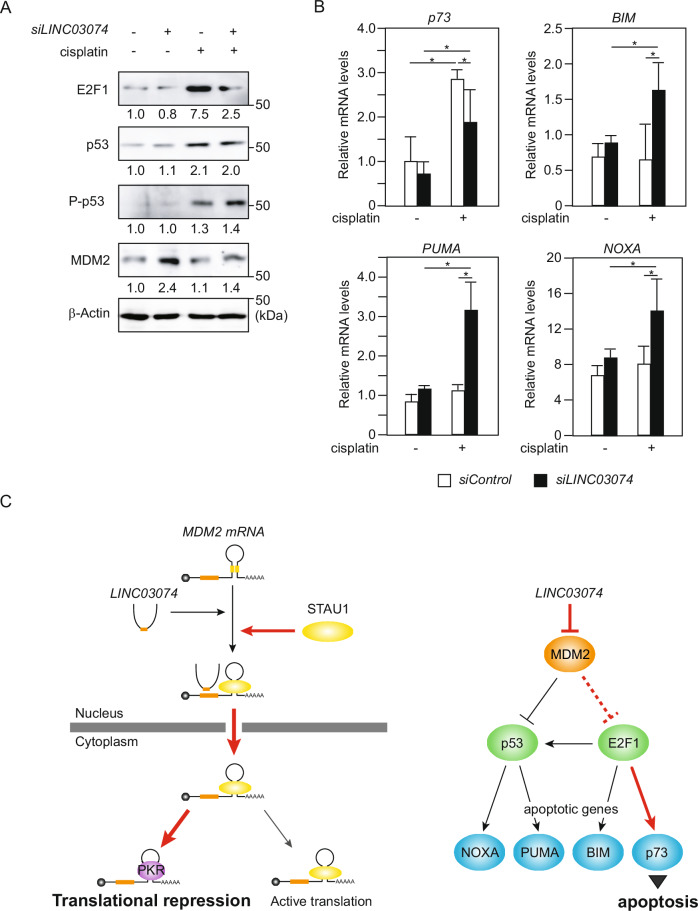
Germ cells preferentially induce apoptosis in response to DNA damage to avoid genomic mutations. Apoptosis of germ cells is closely related to cancer development and chemotherapy resistance; however, its regulatory mechanism is unclear. Here, we suggest that testis-specific lncRNA LINC03074 is involved in male germ cell apoptosis by regulating the expression of the proto-oncogene MDM2. LINC03074 is highly expressed in the sperm of healthy adult testes and cancer cells of testes with testicular germ cell tumors (TGCTs). LINC03074 binds to MDM2 mRNA via an Alu element, thereby reducing MDM2 protein levels. LINC03074 stimulates STAU1-mediated nuclear export of MDM2 mRNA by increasing STAU1 binding to MDM2 mRNA in the cell nucleus, thereby promoting PKR-mediated translational repression in the cytoplasm. The induction of apoptosis in TGCT cells and their responsiveness to the anticancer drug cisplatin is enhanced by LINC03074. Notably, LINC03074 increased E2F1 expression without increasing p53, the primary target of MDM2, and upregulated the apoptotic gene p73, the target gene of E2F1. LINC03074-mediated regulation of apoptosis contributes to the responsiveness of TGCTs to anticancer drug-induced DNA damage.


Conflict of interest statement

The authors declare no competing interests.

Figures

Fig. 1
Fig. 1. Expression of LINC03074 in testis.
A Expression of LINC03074 in major human tissues. The data resulted from an RNA-Seq CAGE analysis of human tissues of the RIKEN FANTOM5 project. Expression levels in tissues other than testis are less than 0.5 TPM, which is below the detection limit of the analysis. B LINC03074 levels in normal and cancer regions of testis tissues from patients with seminoma. Paired normal and cancer tissue samples were obtained from 10 different testicles (paired dots are connected by gray lines). Relative expression levels of LINC03074 to GAPDH were measured using RT-qPCR. *P = 0.00178. C In situ hybridization with detection probes for LINC03074 on testes of healthy adults and of patients with seminoma. The sense strand probe of LINC03074 was used as a negative control. The right small panels show enlarged views of the corresponding left panels. LINC03074 was localized to the nucleus and cytoplasm in normal sperm cells and mainly to the nucleus in seminoma cells.
Fig. 2
Fig. 2. Interaction of LINC03074 with MDM2 mRNA.
A Schematic drawing of predicted interaction regions between human LINC03074 and MDM2 mRNA. Interaction regions predicted by the lncRRIsearch database (gray dot lines), Alu elements (orange arrows), and inverted Alu pairs (yellow arrows) are shown (upper panel). An example of the predicted base pairs for the regions shown in red and blue in the upper panel is shown (ΔG = −60.91 kcal/mol, bottom panel). Sx, Sx1, FLAM_C, Sz and Y, Alu subfamilies; 5′UTR 5′untranslated region, CDS coding sequence, 3′UTR 3′untranslated region. B Enrichment of RNAs by LINC03074 CHART as measured using RT-qPCR. Each enrichment value is shown as a percentage of the measurement for each mock (without C-oligo). Error bars represent +SEM for three qPCR experiments. *P < 0.05. C Schematic representation of full length (FL) and Alu element-deficient (ΔAlu) LINC03074 and biotin-tagged MDM2 3′UTR (FL and Δ5′-Alu). D RNA pull-down assays using the biotin-tagged (bio)-MDM2 3′UTR. In vitro, transcribed bio-MDM2 was incubated with total RNA extracted from HEK293 cells overexpressing LINC03074. RNAs associated with bio-MDM2 3′UTRs were detected via RT-qPCR. Error bars represent +SEM for three qPCR experiments. *P < 0.05.
Fig. 3
Fig. 3. Reduction of MDM2 protein levels by LINC03074.
A MDM2 and LINC03074 RNA levels in LINC03074-knockdown TCam-2 cells measured via RT-qPCR. TCam-2 cells were transfected with siRNAs for LINC03074 (siLINC03074) for 72 h. Data represent the average of three independent measurements normalized to GAPDH mRNA expression. B MDM2 protein levels in LINC03074 knockdown cells transiently expressing the LINC03074 mutant. Western blotting was performed with anti-MDM2 antibody using TCam-2 cells transfected with siLINC03074 for 48 h followed by LINC03074 expression plasmids for 24 h. Band intensity was quantified by Image Lab 6.1. The measurements were normalized to the siControl protein levels that are indicated at the bottom of each band. C Schematic representation of the constructs containing FLAG tag-fused MDM2 CDS alone or in combination with 3′UTR. D Western blot analysis using an anti-FLAG antibody against HEK293 cells transfected with FLAG-tagged MDM2 and LINC03074 expression plasmids (left panels). The relative intensity to the band of the control in each first left lane is shown in the bar graph (right panel).
Fig. 4
Fig. 4. Decrease of LINC03074 suppresses STAU1-mediated mRNA nuclear export and PKR-induced translational repression of MDM2.
A Effect of LINC03074 on the binding of dsRNA binding proteins and MDM2 mRNA in TCam-2 cell nuclei. RIP assay was performed with each dsRNA binding protein antibody using TCam-2 cell nuclear extracts with LINC03074 knockdown. The level of RNA binding with each dsRNA binding protein was measured via RT-qPCR and is shown as a relative value to the IgG binding level. Error bars represent +SEM for three qPCR experiments. An asterisk above each bar indicates statistical significance for IgG values. *P < 0.05. B Effect of LINC03074 on MDM2 mRNA levels in the nucleus and cytoplasm of TCam-2 cells. The relative expression of MDM2 to 5S-rRNA (nucleus) or GAPDH (cytoplasm) was measured using RT-qPCR. Error bars represent +SEM for three qPCR experiments. An asterisk above each bar indicates statistical significance for siControl values. *P < 0.05. C RIP assay using anti-PKR and anti-STAU1 antibodies with cytoplasmic extracts from TCam-2 with knockdown of LINC03074 or STAU1. Error bars represent +SEM for three qPCR experiments. An asterisk above each bar indicates statistical significance for IgG values. *P < 0.05. D Western blotting of LINC03074 or STAU1 knocked-down TCam-2 cells treated with PKR inhibitor. TCam-2 cells were transfected with siLINC03074 and siSTAU1 for 24 h, followed by treatment with 1μM PKR inhibitor for 24 h. Band intensity was quantified by Image Lab 6.1. The measurements were normalized to control (siControl without PKR inhibitor) protein levels that are indicated at the bottom of each band.
Fig. 5
Fig. 5. LINC03074 enhances cisplatin-induced apoptosis.
A Cell growth assay using TCam-2 cells transfected with siLINC03074 and treated with different concentrations of cisplatin. Absorbance at 450 nm (OD450) was used to estimate cell concentration. Data represent the means ± SEM (n = 3). B Apoptosis assay using LINC03074-knockdown TCam-2 cells treated with cisplatin. TCam-2 cells were transfected with siLINC03074 and treated with 20 μM cisplatin for 48 h. Apoptotic cells were identified by the increase in the fluorescence intensity of FITC-labeled Annexin-V using flow cytometry. Percentage of TCam-2 cells (either with or without siLINC03074) in apoptosis in the presence or absence of cisplatin (n = 3). *P < 0.05. siControl, TCam-2 cells transfected with a negative control siRNA.
Fig. 6
Fig. 6. LINC03074 activates E2F1 and p73 pathways.
A Western blotting using TCam-2 cells transfected with siLINC03074 for 72 h. Cisplatin was added to the culture medium at a concentration of 10 μM for 72 h before cell extraction. Band intensity was quantified using Image Lab 6.1, and all measurements were normalized to the protein levels of the siControl without cisplatin (indicated at the bottom of each band). B Relative expression levels of apoptotic genes in LINC03074-knockdown cells were measured using RT-qPCR. TCam-2 cells were transfected with siLINC03074 and treated with cisplatin for 48 h (n = 3). *P < 0.05. C Predicted schematic of LINC03074-mediated mechanisms of MDM2 translational repression (left panel) and apoptosis stimulation (right panel).

Similar articles

References

    1. Singh R, Fazal Z, Freemantle SJ, Spinella MJ. Mechanisms of cisplatin sensitivity and resistance in testicular germ cell tumors. Cancer Drug Resist. 2019;2:580–94. - PMC - PubMed
    1. Atkin NB, Baker MC. i(12p): specific chromosomal marker in seminoma and malignant teratoma of the testis? Cancer Genet Cytogenet. 1983;10:199–204. 10.1016/0165-4608(83)90125-5 - DOI - PubMed
    1. Riou G, Barrois M, Prost S, Terrier MJ, Theodore C, Levine AJ. The p53 and mdm-2 genes in human testicular germ-cell tumors. Mol Carcinog. 1995;12:124–31. 10.1002/mc.2940120303 - DOI - PubMed
    1. Haupt Y, Maya R, Kazaz A, Oren M. Mdm2 promotes the rapid degradation of p53. Nature. 1997;387:296–9. 10.1038/387296a0 - DOI - PubMed
    1. Chen J, Lin J, Levine AJ. Regulation of transcription functions of the p53 tumor suppressor by the mdm-2 oncogene. Mol Med. 1995;1:142–52. 10.1007/BF03401562 - DOI - PMC - PubMed

LinkOut - more resources