. 2024 Aug 3;15(8):559.
doi: 10.1038/s41419-024-06937-7.

Enzalutamide inhibits PEX10 function and sensitizes prostate cancer cells to ROS activators

Affiliations

Enzalutamide inhibits PEX10 function and sensitizes prostate cancer cells to ROS activators

Yuankang Feng et al. Cell Death Dis. .

Abstract

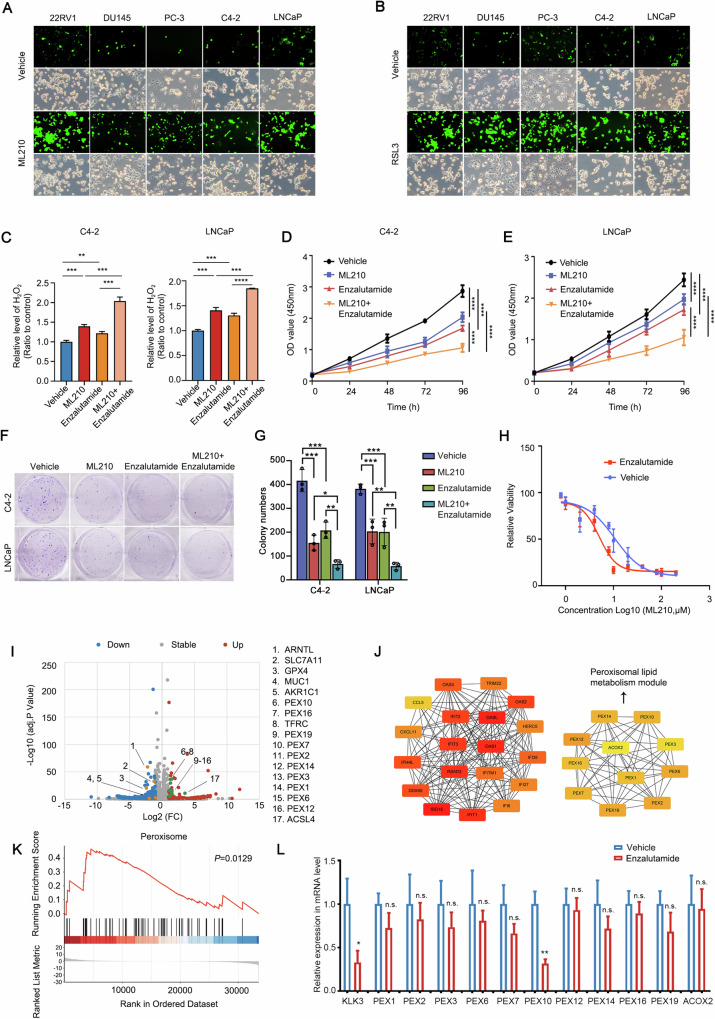
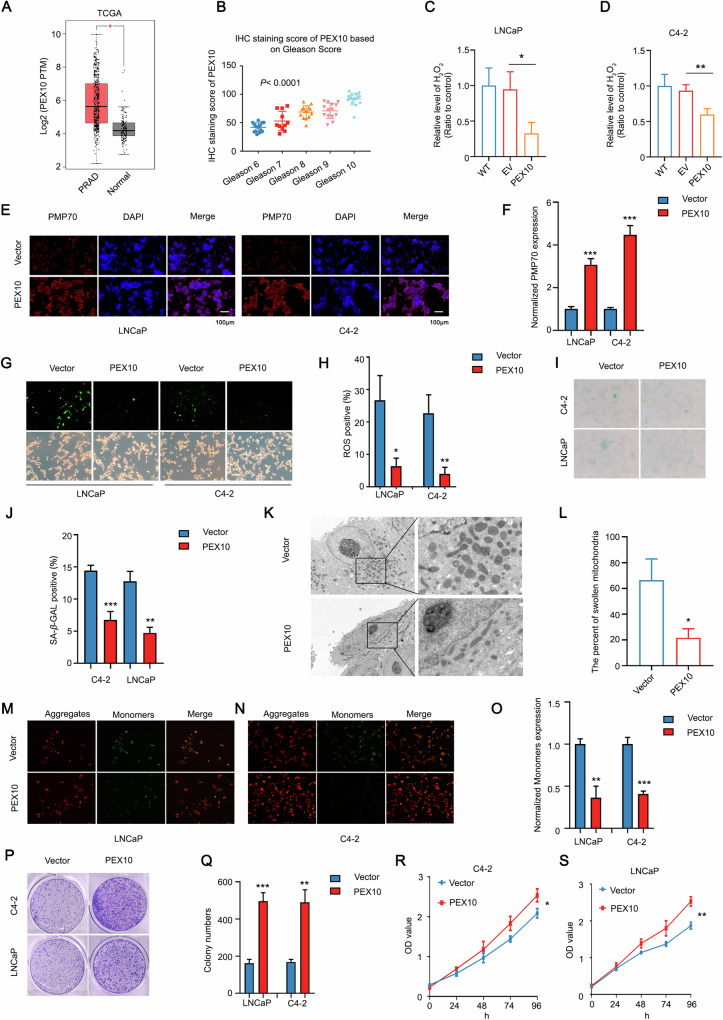
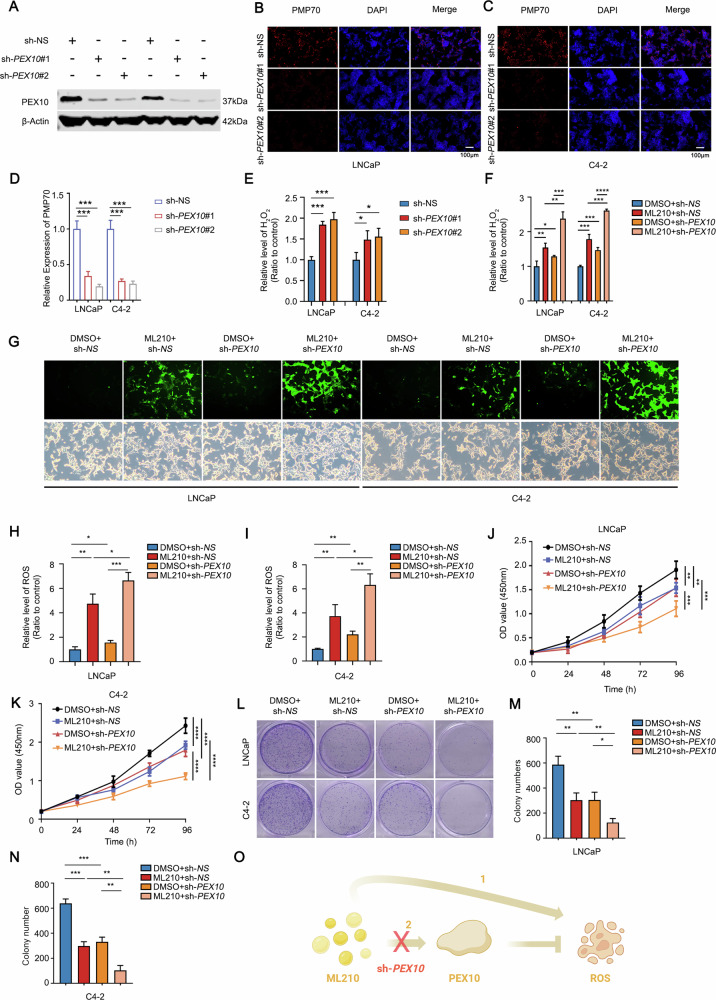
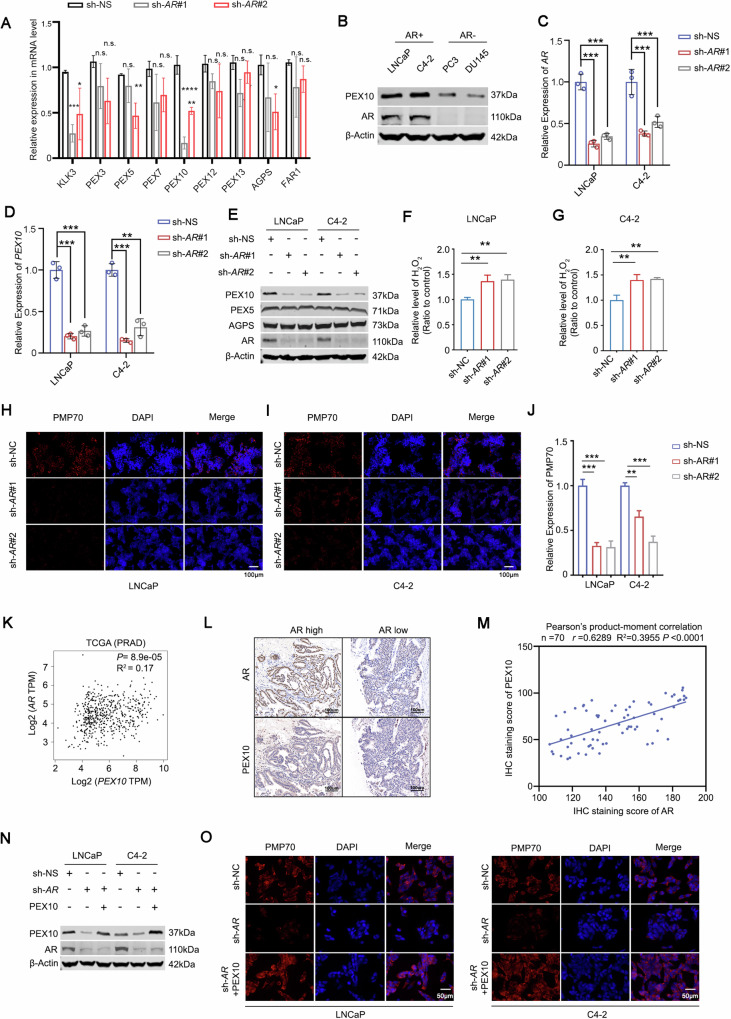
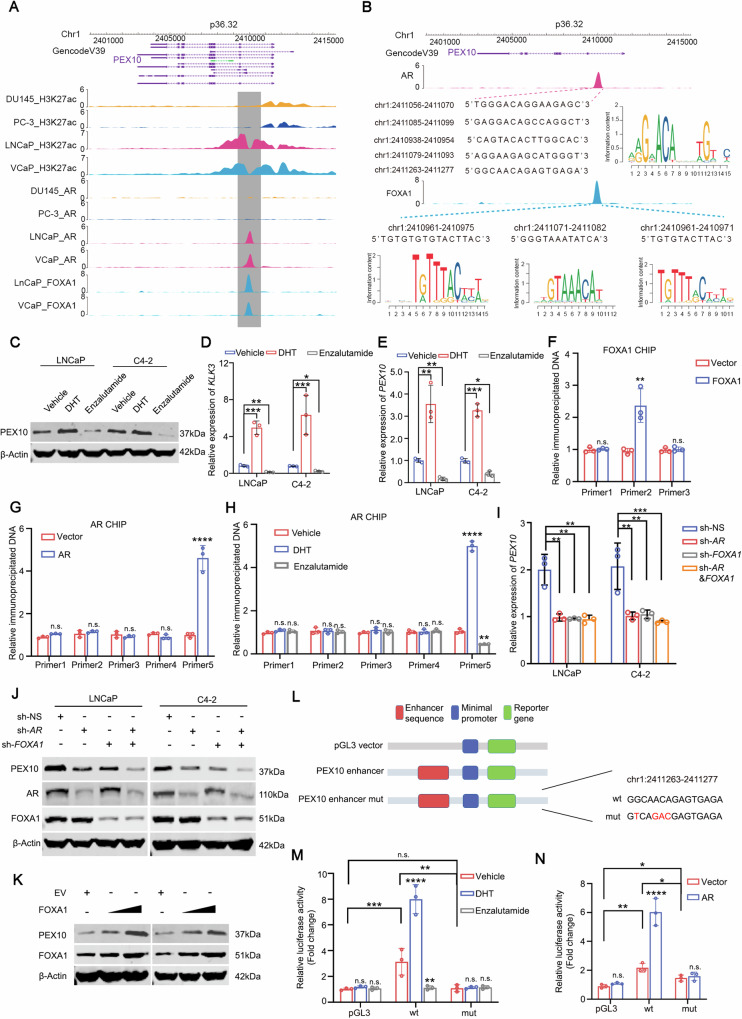
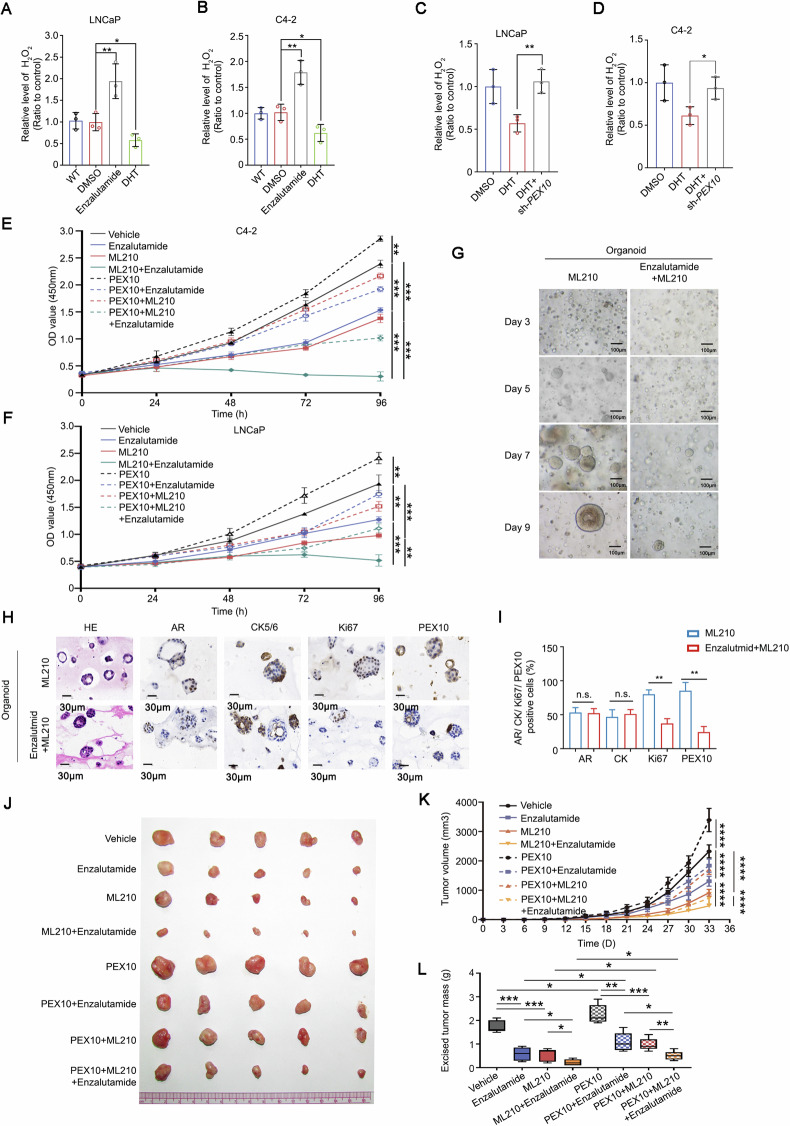
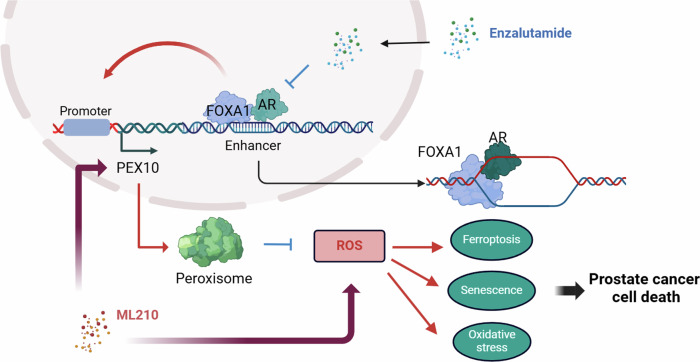
Sharply increased reactive oxygen species (ROS) are thought to induce oxidative stress, damage cell structure and cause cell death; however, its role in prostate cancer remains unclear. Enzalutamide is a widely used anti-prostate cancer drug that antagonizes androgen binding with its receptor. Further exploration of the mechanism and potential application strategies of enzalutamide is crucial for the treatment of prostate cancer. Here, we confirmed PEX10 can be induced by ROS activators while reduce ROS level in prostate cancer cells, which weakened the anti-tumor effect of ROS activators. The androgen receptor (AR) can promote the expression of PEX10 by acting as an enhancer in cooperation with FOXA1. The anti-tumor drug enzalutamide inhibits PEX10 by inhibiting the function of AR, and synergize with ROS activators ML210 or RSL3 to produce a stronger anti-tumor effect, thereby sensitizing cells to ROS activators. This study reveals a previously unrecognized function of enzalutamide and AR by regulating PEX10 and suggests a new strategy of enzalutamide application in prostate cancer treatment.


Conflict of interest statement

The authors declare no competing interests.

Figures

Fig. 1
Fig. 1. PEX10 is involved in ROS in prostate cancer.
A, B Prostate cancer cell lines (22Rv1, DU145, PC-3, C4-2, and LNCaP) treated with vehicle or ML210 (2 μM) (A) or RSL3 (1 μM) (B) and evaluation of the cell count and cell ROS level according to manufacturer’s instructions. C H2O2 level of prostate cancer cells (C4-2 and LNCaP) after treatment with ML210 (2 μM) or enzalutamide (5 μM) or combination. Unpaired t-test. (P < 0.0001 as “****”). D, E The CCK-8 OD value of two cell lines (C4-2-R and C4-2-N) after treating with ML210 (2 μM) and with or without enzalutamide (5 μM) combination. ANOVA. (P < 0.01 as “**”; P < 0.001 as “***”; P < 0.0001 as “****”). F, G Colony formation assay were performed on two cell lines (C4-2-R and C4-2-N) after treated with ML210 (2 μM) alone or in combination with enzalutamide (5 μM). Unpaired t-test. (P < 0.05 as “*”; P < 0.01 as “**”; P < 0.001 as “***”). H The IC50 of ML210 in prostate cell lines (C4-2) with or without enzalutamide (5 μM) treatment. IK The images represented the results of C4-2 sequencing processed by ML210 (2 μM) or vehicle. Three independent samples were taken from each group and treated with ML210 (2 μM) or vehicle for 48 h before sampling. The volcano showed up- and down-regulated genes after ML210 treatment (I). The result of PPI showed that the peroxisome-related genes had changed significantly (J). Peroxisome pathway was the most significantly changed pathway after ML210 treatment in GSEA analysis (K). L The expression of Peroxisome-related genes and other key genes (KLK3) in prostate cancer cells (C4-2) after treatment with enzalutamide (5 μM). Unpaired t-test. (P < 0.05 as “*”; P < 0.01 as “**”; n.s. means nonspecific).
Fig. 2
Fig. 2. PEX10 suppresses cell death by decreasing ROS and H2O2.
A Expression of PEX10 in prostate cancer and normal tissues from the TCGA database. Unpaired t-test. (P < 0.05 as “*”). B The image showed the IHC staining score of PEX10 based on Gleason Score. One-way ANOVA. IHC staining score = ∑ (pi×i) = (percentage of weak intensity area ×1) + (percentage of moderate intensity area ×2) + (percentage of strong intensity area ×3), pi represents the percentage of the area of positive signal pixels; i represents the positive grade. C, D H2O2 level in prostate cancer cells (C4-2 and LNCaP) after overexpression of PEX10. Unpaired t-test. (P < 0.05 as “*”; P < 0.01 as “**”). E, F PMP70 expression level in prostate cancer cells (C4-2 and LNCaP) after overexpression of PEX10. Unpaired t-test. (P < 0.001 as “***”). G, H ROS level in prostate cancer cells (C4-2 and LNCaP) after overexpression of PEX10. Unpaired t-test. (P < 0.001 as “***”). I, J SA-β-GAL level in prostate cancer cells (C4-2 and LNCaP) after overexpression of PEX10. Unpaired t-test. (P < 0.05 as “*”; P < 0.01 as “**”). K, L The percentage of mitochondria with atrophy and increased membrane density and its statistic in C4-2 cells after PEX10 ectopic expression. Unpaired t-test. (P < 0.05 as “*”). MO The immunofluorescence staining of JC-1 and statistic in prostate cancer cells (C4-2 and LNCaP) after overexpression of PEX10. Unpaired t-test. (P < 0.01 as “**”, P < 0.001 as “***”). P, Q Colony numbers and statistic in prostate cancer cells (C4-2 and LNCaP) after overexpression of PEX10. Unpaired t-test. (P < 0.01 as “**”; P < 0.001 as “***”). R, S CCK8 OD value and statistic in prostate cancer cells (C4-2 and LNCaP) after overexpression of PEX10. ANOVA. (P < 0.05 as “*”; P < 0.01 as “**”).
Fig. 3
Fig. 3. Knocking down PEX10 enhances the anticancer efficacy of ML210.
A The expression of PEX10 after knockdown of PEX10. BD PMP70 expression level in prostate cancer cells (C4-2 and LNCaP) after PEX10 knockdown. Unpaired t-test. (P < 0.001 as “***”). E, F H2O2 level in prostate cancer cells (C4-2 and LNCaP) after PEX10 knockdown. Unpaired t-test. (P < 0.05 as “*”; P < 0.01 as “**”). GI ROS level in prostate cancer cells (C4-2 and LNCaP) after treating with ML210 (2 μM) and (or) PEX10 knockdown. Unpaired t-test. (P < 0.05 as “*”; P < 0.01 as “**”, P < 0.001 as “***”). J, K CCK8 OD value and statistic in prostate cancer cells (C4-2 and LNCaP) after treating with ML210 (2 μM) and (or) PEX10 knockdown. ANOVA. (P < 0.01 as “**”; P < 0.001 as “***” ; P < 0.0001 as “****”). LN Colony numbers and statistic in prostate cancer cells (C4-2 and LNCaP) after treating with ML210 (2 μM) and (or) PEX10 knockdown. Unpaired t-test. (P < 0.05 as “*”; P < 0.01 as “**”; P < 0.001 as “***”). O Specific mechanistic diagram of the ML210/PEX10/ROS axis. Created with BioRender.com (www.biorender.com).
Fig. 4
Fig. 4. AR plays a critical role in regulation of PEX10 expression and function.
A The expression of Peroxisome-related genes and other key genes (KLK3, AGPS and FAR1) in prostate cancer cells (C4-2) after AR knockdown. Unpaired t-test. (P < 0.05 as “*”; P < 0.01 as “**”; P < 0.001 as “***”; P < 0.0001 as “****”). B The protein level of PEX10 in AR-positive prostate cancer cells (C4-2 and LNCaP) and AR-negative prostate cancer cells (PC-3 and DU145). C, D AR and PEX10 expression at mRNA level in prostate cancer cells (C4-2 and LNCaP) after AR knockdown, Unpaired t-test. (P < 0.01 as “**”; P < 0.001 as “***”). E AR, PEX5, AGPS and PEX10 expression at the protein level (C4-2 and LNCaP) after AR knockdown. F, G H2O2 level in prostate cancer cells (C4-2 and LNCaP) after AR knockdown. Unpaired t-test. (P < 0.01 as “**”). HJ PMP70 expression level in prostate cancer cells (C4-2 and LNCaP) after AR knockdown. Unpaired t-test. (P < 0.01 as “**”, P < 0.001 as “***”). KM The correlation of AR and PEX10 expression from the TCGA cohort (K). IHC shows the correlation of AR and PEX10 expression in prostate cancer patient tissues (n = 70, r = 0.6289, R2 = 0.3955, P < 0.0001) (L, M). N The expression of PEX10 and AR protein after AR knockdown or combined with ectopic expression of PEX10 in prostate cancer cells (C4-2 and LNCaP). O The expression of PMP70 protein after AR knockdown or combined with ectopic expression of PEX10 in prostate cancer cells (C4-2 and LNCaP).
Fig. 5
Fig. 5. PEX10 is an AR target gene and can be regulated by AR inhibition and activation.
A ChIP-seq binding peak of H3K27ac, AR, and FOXA1 on PEX10 gene of prostate cancer cell lines (DU145, PC-3, VCaP, and LNCaP). B Lists of potential binding sequences of AR and FOXA1 in PEX10 2411280-2410760 region. C PEX10 expression at protein level in AR-positive prostate cancer cells (C4-2 and LNCaP) after treatment with DHT (100 nM) or enzalutamide (5 μM). D, E KLK3 and PEX10 expression at mRNA level in AR-positive prostate cancer cells (C4-2 and LNCaP) after treatment with DHT (100 nM) or enzalutamide (5 μM). Unpaired t-test. (P < 0.05 as “*”; P < 0.01 as “**”; P < 0.001 as “***”). F, G ChIP-qPCR showed the AR or FOXA1 binding change after AR or FOXA1 was ectopically expressed in C4-2 cells. H ChIP-qPCR showed the AR binding change after treatment with DHT (100 nM) or enzalutamide (5 μM). I The expression of PEX10 at the mRNA level after AR or FOXA1 knockdown alone or in combination. J The expression of PEX10 at the protein level after AR or FOXA1 knockdown alone or in combination. K The expression of PEX10 with the supplementation and a different dose of FOXA1. L The diagram shows the construction of the wild type or mutant PEX10 enhancer plasmid. M The luciferase level after transfection with wild-type or mutant PEX10 enhancer plasmid and treated with DHT (100 nM) or enzalutamide (5 μM). Unpaired t-test. (n.s. no specific; P < 0.01 as “**”; P < 0.001 as “***”, P < 0.0001 as “****”). N The luciferase level after transfection with wild-type or mutant PEX10 enhancer plasmid after ectopic expression of AR. Unpaired t-test. (n.s. no specific, P < 0.05 as “*”; P < 0.01 as “**”, P < 0.0001 as “****”).
Fig. 6
Fig. 6. Enzalutamide sensitize prostate cancer cells to ferroptosis inducers.
A, B H2O2 level after treatment with vehicle, DHT (100 nM) or enzalutamide (5 μM) in prostate cancer cell lines (C4-2 and LNCaP). Unpaired t-test. (P < 0.05 as “*”; P < 0.01 as “**”). C, D H2O2 level after treatment with DHT and then knocked down PEX10 in prostate cancer cell lines (C4-2 and LNCaP). Unpaired t-test. (P < 0.05 as “*”; P < 0.01 as “**”). E, F The CCK-8 OD value of two PEX10 overexpression or overexpression control prostate cancer cell lines (C4-2 and LNCaP) after treatment with ML210 (2 μM) and combination with or without enzalutamide (5 μM). ANOVA. (P < 0.01 as “**”; P < 0.001 as “***”). G The growth state of patient prostate cancer tissue original organoid after treatment with ML210 (2 μM) or enzalutamide (5 μM) combination from days 1 to 9. Expression (H) and statistic (I) of AR, CK5/6, Ki67 and PEX10 in organoids of different groups by IHC method. Unpaired t-test. (n.s. no specific; P < 0.01 as “**”). JL The image representative of in vivo tumor xenograft model (C4-2-R) (J) performed on SCID mice (n = 5) and the volume (L) and weight (K) statistic of the tumor with the constant treatment of ML210 (5 mg/kg) and/or enzalutamide (10 mg/kg), ANOVA. (P < 0.0001 as “****”). Unpaired t-test. (P < 0.05 as “*”; P < 0.01 as “**”).
Fig. 7
Fig. 7. Hypothetical model depicting the mechanistic Enzalutamide activates prostate cancer cells to ML210.
AR and FOXA1 bind the PEX10 enhancer and promote PEX10 promoter function. PEX10 participates in peroxisome formation and ROS process and finally inhibits the ROS. Enzalutamide could inhibit AR function and finally promote ROS. Enzalutamide could activate the ROS in prostate cancer cells and sensitize cells to ML210. Created with BioRender.com (www.biorender.com).

Similar articles

Cited by

References

    1. Chang AJ, Autio KA, Roach M 3rd, Scher HI. High-risk prostate cancer-classification and therapy. Nat Rev Clin Oncol. 2014;11:308–23. 10.1038/nrclinonc.2014.68 - DOI - PMC - PubMed
    1. Wang G, Zhao D, Spring DJ, DePinho RA. Genetics and biology of prostate cancer. Genes Dev. 2018;32:1105–40. 10.1101/gad.315739.118 - DOI - PMC - PubMed
    1. Schatten H. Brief overview of prostate cancer statistics, grading, diagnosis and treatment strategies. Adv Exp Med Biol. 2018;1095:1–14. 10.1007/978-3-319-95693-0_1 - DOI - PubMed
    1. Peng S, Chen X, Huang C, Yang C, Situ M, Zhou Q, et al. UBE2S as a novel ubiquitinated regulator of p16 and beta-catenin to promote bone metastasis of prostate cancer. Int J Biol Sci. 2022;18:3528–43. 10.7150/ijbs.72629 - DOI - PMC - PubMed
    1. Zhou Q, Chen X, Yao K, Zhang Y, He H, Huang H, et al. TSPAN18 facilitates bone metastasis of prostate cancer by protecting STIM1 from TRIM32-mediated ubiquitination. J Exp Clin Cancer Res. 2023;42:195. 10.1186/s13046-023-02764-4 - DOI - PMC - PubMed

MeSH terms