. 2024 Aug 4;15(1):6598.
doi: 10.1038/s41467-024-50941-6.

Convergent direct and indirect cortical streams shape avoidance decisions in mice via the midline thalamus

Affiliations

Convergent direct and indirect cortical streams shape avoidance decisions in mice via the midline thalamus

Jun Ma et al. Nat Commun. .

Abstract

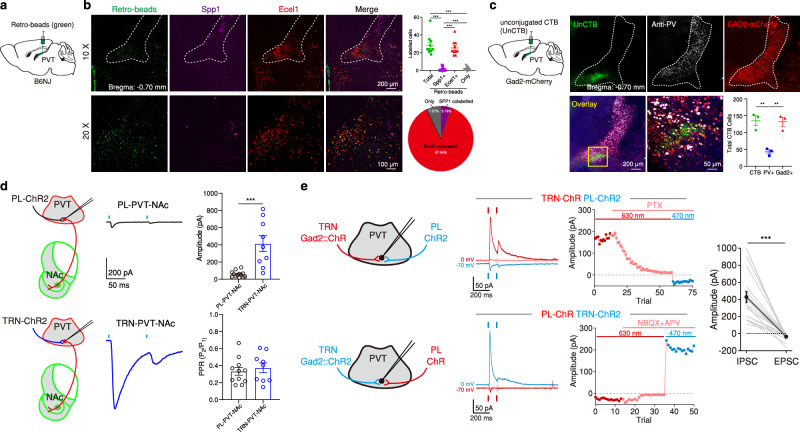
Current concepts of corticothalamic organization in the mammalian brain are mainly based on sensory systems, with less focus on circuits for higher-order cognitive functions. In sensory systems, first-order thalamic relays are driven by subcortical inputs and modulated by cortical feedback, while higher-order relays receive strong excitatory cortical inputs. The applicability of these principles beyond sensory systems is uncertain. We investigated mouse prefronto-thalamic projections to the midline thalamus, revealing distinct top-down control. Unlike sensory systems, this pathway relies on indirect modulation via the thalamic reticular nucleus (TRN). Specifically, the prelimbic area, which influences emotional and motivated behaviors, impacts instrumental avoidance responses through direct and indirect projections to the paraventricular thalamus. Both pathways promote defensive states, but the indirect pathway via the TRN is essential for organizing avoidance decisions through disinhibition. Our findings highlight intra-thalamic circuit dynamics that integrate cortical cognitive signals and their role in shaping complex behaviors.


Conflict of interest statement

The authors declare no competing interests.

Figures

Fig. 1
Fig. 1. Anatomical distribution of PL projections to the PVT and avTRN.
a Schematic of the viral vector strategy used for anterograde tracing of PLL5 (Rbp4-Cre) or PLL6 (Syt6-Cre) projections to the PVT and avTRN. b Representative images showing mCherry expression in Layer 6 neurons of the PL (left) and axon terminals within the PVT (middle) and the avTRN (right). c Representative images showing mCherry expression in Layer 5 neurons of the PL (left) and axon terminals within the PVT (middle) and the avTRN (right). d Schematic of the retrograde tracing strategy used for labeling avTRN- and PVT-projecting PL neurons. e Representative images showing the targets for dual-color CTB injections, green into the avTRN (left) and red into the PVT (right). f, Representative images showing the retrograde labeled avTRN-projecting cells (green) and PVT-projecting cells (red) are present in the PL region. g Left: Quantification of the density of avTRN- and PVT-projecting neurons in the PL (n = 3 mice, 4 slices per subject) one-way ANOVA, F(2, 33) = 28.15, P < 0.0001. Right: Quantification of the percentage of double-projecting cells in the PL. two-tailed t test, t(22) = 4.55, **P = 0.0046. h Quantification of PL cell counts for each projector, normalized by projector type, plotted along the distance from midline. n = 3 mice. i Schematic of the viral vector strategy to trace the PL inputs to PVT–projectors in the avTRN. j Representative image showing the rabies starter cells (Rabies-GFP and TVA-mCherry double-labeled cells) in avTRN region. k Representative images showing the projectors (Rabies-GFP) of avTRN PVT-projecting cells in the PL. All anatomical experimented were repeated at least once, and similar results were obtained. Data are shown as mean ± s.e.m. Source data are provided as a Source Data file.
Fig. 2
Fig. 2. Higher-order sector of the avTRN forms robust monosynaptic connections with NAc-projecting PVT neurons.
a Schematic of the experimental strategy used for molecular identification of PVT-projecting avTRN cells. bTop: Representative images of avTRN with retro-beads injected in the pPVT (green) and RNAscope probes for Spp1 (magenta), Ecel1 (red) and merged. Bottom: Representative 20x images. Top right: Quantification of avTRN cells labeled with retro-beads, n = 10 sections from 3 mice, One-way ANOVA F(3, 27) = 81.16, P < 0.0001. Bottom right: Averaged fraction of Retro-beads labeled avTRN cells for each group. c Top: Schematic of immunostaining and retrograde labeling of PVT-projecting avTRN cells alongside representative images depicting retrogradely-labeled avTRN cells (unCTB, green), parvalbumin (anti-PV, white), and mCherry (GAD2-mCherry). Bottom left: Overlay of representative images and quantification of total number of avTRN cells labeled with unCTB, PV and GAD2, n = 3 mice, 3 slices per mouse, One-way ANOVA F(2,6) = 19.94, P = 0.0022. d Left: Schematic of experimental approach for ex vivo slice whole-cell recordings of optically-evoked EPSC (oEPSC, PL) or IPSCs (oIPSC, avTRN) in pPVT-NAc cells. Middle: representative oEPSC and oIPSC traces. Blue lines denote optical stimulation. Right: Quantification of oEPSC and oIPSC amplitudes (independent two-tailed t test, t(18) = 4.69, ***P < 0.0001), and PPRs (independent two-tailed t test, t(18) = 0.57), n = 11 cells from 4 mice with ChR2 in the PL and 9 cells from 3 mice with ChR2 in the avTRN. e Left: Schematics of experimental approach for dual optogenetic recordings of convergent PL and TRN inputs to pPVT cells. Middle two: Representative traces and quantified PSC amplitudes in ACSF and PTX (100 µM) or NBQX (20 µM) + APV (50 µM). Right: Quantification of oIPSC and oEPSC amplitudes, n = 19 cells from 9 mice, paired two-tailed t test, t(18) = 5.90, P < 0.0001. Data are shown as mean ± s.e.m. Source data are provided as a Source Data file.
Fig. 3
Fig. 3. Optogenetic stimulation of the PL drives inhibitory responses in the PVT that are partially rescued by chemogenetic inhibition of avTRN.
a Schematic of the experimental approach for fiber photometry imaging of NAc-projecting PVT cells in response to PL stimulation with and without avTRN inhibition. b Representative image of ChR2-YFP expression and optical fiber placement in the PL region (top), ChR2-YFP (green), mCherry-hM4Di (red), and anti-PV (white) expression in TRN region (middle), and GCaMP8s, ChR2-YFP (green), and mCherry-hM4Di (red) expression and fiber placement in pPVT (bottom). ce Calcium signal quantification during PL opto-activation and avTRN chemogenetic-inhibition. PL with ChR2-YFP and TRN with mCherry-hM4Di (Gi), n = 4 mice (c), PL with ChR2-YFP and TRN with mCherry, n = 4 mice (d) and PL with YFP and TRN with Gi, n = 3 mice. e Left: Heatmaps of individual trial calcium responses for Saline and CNO treatment. Middle: Average calcium signal and optogenetic (opto) stimulation duration (blue background). Right: Calcium signal AUC quantification during pre-opto, opto and post-opto, Mixed-effects model (REML) n = 60 Trials from 4 mice, F(2, 236) = 10.65, P < 0.0001. d: n = 60 Trials from 4 mice, F(2, 236) = 0.98, P = 0.38. e: n = 45 Trials from 3 mice, F(2, 176) = 1.87, P = 0.16. For all quantifications, multiple comparisons were conducted corrected by two-stage linear step-up procedure. Asterisks indicate where ANOVA multiple comparisons found significance. Data are shown as mean ± s.e.m. Source data are provided as a Source Data file.
Fig. 4
Fig. 4. PL–PVT projections are dynamically engaged during active avoidance.
aTop: Schematic of the experimental approach for fiber photometry imaging of PL–PVT terminals. Bottom: Representative image of GCaMP8s expression and fiber placement in pPVT. b Heatmaps of individual trial calcium responses for avoidance and escape trials (top), and average signal and WS duration (bottom), n = 5 mice. cd Left: Average calcium responses for all avoidance and escape trials during WS onset (c) and shuttle initiate events (d). Mixed-effects model (REML) interactions reported in graphs. WS onset: Avoidance: n = 123 events; Escape: n = 27 events. Shuttle initiate: Avoidance: n = 91 events; Escape: n = 20 events. Right: Calcium signal AUC quantification in 1 s bins. WS onset REML interaction, F(3,444) = 1.63, P = 0.182; Shuttle Initiate REML interaction F(9,981) = 6.71, P < 0.0001. e Schematic for bidirectional optogenetic manipulations of PL–PVT circuit (left) in the 2AA task (right). f Group behavioral data across test sessions normalized to the first light-off session for avoidance rates (left), latencies to avoid (middle), and latencies to escape (right). Ctl: n = 11 mice; Halo: n = 0 mice; ChR: n = 10 mice. Two-way ANOVA. Avoidance rate: F(4,56) = 5.12, P = 0.0014. Latency to avoid: F(4,53) = 1.21, P = 0.32. Latency to escape: F(4,56) = 12.34, P < 0.0001. g Schematic of the approach for fiber photometry imaging of NAc-projecting PVT cells and optogenetic silencing of PL–PVT terminals. Bottom: Representative images of GCaMP8s, Halo-mCherry expression, and fiber placement around pPVT. h Heatmaps of calcium responses for avoidance and escape trials in light-off and light-on sessions, n = 3 mice. i Average calcium signal and WS duration. j Calcium signal AUC quantification for avoidance and escape trials, Mixed-effects model (REML) interactions. Avoidance: Off, n = 144 Trials; On, n = 143 Trials; F(2,570) = 78.46, P < 0.0001. Escape: Off, n = 36 Trials; On, n = 37 Trials; F(2,213) = 14.83, P < 0.0001. kl Averaged calcium responses during WS onset (k) and shuttle initiation (l) events for all avoidance and escape trials, n = 3 mice. Mixed-effects model (REML) interactions shown. WS onset: Avoidance: Off, n = 144 Events; On, n = 143 Events; Escape: Off, n = 36 Events; On, n = 37 Events. Shuttle initiate: Avoidance: Off, n = 117 Events; On, n = 120 Events; Escape: Off, n = 33 Events; On, n = 33 Events. For all quantifications, multiple comparisons were conducted corrected by a two-stage linear step-up procedure, black lines along the x-axis indicate significant changes reported between groups, and red or blue lines denote the first significant change from the previous bin for within trial type comparisons. Asterisks indicate where ANOVA multiple comparisons found significance. Data are shown as mean ± s.e.m. Source data are provided as a Source Data file.
Fig. 5
Fig. 5. Dynamic activity in PL–avTRN neurons signal the decision to and initiation of active avoidance.
a Top: Schematic of the experimental approach for fiber photometry imaging of avTRN-projecting PL neurons. Bottom: Representative images of GCaMP8s expression and optical fiber placement in the PL region. b Top: Heatmaps of calcium responses for avoidance and escape trials. Bottom: Average calcium signal and WS duration, n = 6 mice. c, d Left: Averaged calcium responses for avoidance (blue) and escape (red) trials during WS onset (c) and shuttle initiate events (d). Mixed-effects model (REML) interactions reported in graphs. WS onset: Avoidance, n = 128 events; Escape, n = 52 events. Shuttle initiate: Avoidance, n = 112 events; Escape, n = 50 events. Right: Calcium signal AUC quantification in 1 s bins. WS onset REML interaction, F(3,534) = 2.60, P = 0.051; Shuttle Initiate REML interaction F(9,1440) = 3.20, P = 0.0008. e Top: Viral strategy schematic for optogenetic stimulation of PL–avTRN terminals. Bottom: Representative images of PL mCherry expression and fiber placement around avTRN. f 2AA Task schematic. g Group behavioral data across test sessions normalized to the first light-off session for avoidance rates (left), latencies to avoid (middle), and latencies to escape (right). Two-way ANOVA interactions provided (n = 11 mice per group). Avoidance rate: F(2,40) = 1.74, P = 0.19. Latency to avoid: F(2,40) = 2.23, P = 0.12. Latency to escape: F(2,58) = 0.31, P = 0.73. h 2AA task schematic. i Group behavioral data across test sessions normalized to the first light-off session for avoidance rates (left), latencies to avoid (middle), and latencies to escape (right). Two-way ANOVA interactions provided (Ctl: n = 9 mice; ChR: n = 8 mice). Avoidance rate: F(2,30) = 18.88, P < 0.0001. Latency to avoid: F(2,29) = 7.66, P = 0.0007. Latency to escape: F(2,28) = 35.59, P < 0.0001. For all quantifications, multiple comparisons were conducted corrected by a two-stage linear step-up procedure, black lines along the x-axis indicate significant changes reported between groups, and red or blue lines denote the first significant change from the previous bin for within trial type comparisons. Asterisks indicate where ANOVA multiple comparisons found significance. Data are shown as mean ± s.e.m. Source data are provided as a Source Data file.
Fig. 6
Fig. 6. The avTRN–PVT circuit controls active avoidance behavior.
a Top: Schematic of the experimental approach for fiber photometry imaging of the axon terminals of GAD2+ TRN cells in the pPVT. Bottom: Representative images of GCaMP7s expression and fiber placement around pPVT. b Top: Heatmaps of calcium responses for avoidance and escape trials. Bottom: Average calcium signal and WS duration, n = 5 mice. c, d Left: Average calcium responses for all avoidance (blue) and escape (red) trials during WS onset (c) and shuttle initiate events (d). Mixed-effects model (REML) interaction reported in graphs. WS onset: Avoidance, n = 214 Events; Escape, n = 86 events. Shuttle initiate: Avoidance, n = 158 events; Escape, n = 64 events. Right: Calcium signal AUC quantification in 1 s bins. WS onset REML interaction, F(3,894) = 0.28, P = 0.84; Shuttle Initiate REML interaction F(9,1980) = 9.19, P < 0.0001. e Top: Viral strategy schematic for optogenetic stimulation of avTRN–PVT circuit. Bottom: Representative image of mCherry-opsin expression and fiber placement around pPVT. f 2AA task schematic. g Group behavioral data across test sessions normalized to first light-off session for avoidance rates (left), latencies to avoid (middle), and latencies to escape (right). Two-way ANOVA interactions provided, (Ctl, n = 7 mice; ChR, n = 9 mice). Avoidance rate: F(2, 28) = 4.73, P = 0.017, Latency to avoid: F(2, 28) = 0.13, P = 0.88, Latency to escape: F(2, 42) = 0.94, P = 0.4, h 2AA task schematic. i Group behavioral data across test sessions normalized to first light-off session for avoidance rates (left), latencies to avoid (middle), and latencies to escape (right). Two-way ANOVA interactions provided (Ctl, n = 6 mice; ChR, n = 7 mice). Avoidance rate: F(2, 22) = 4.09, P = 0.031. Latency to avoid: F(2, 21) = 5.96, P = 0.0089. Latency to escape: F(2, 22) = 0.39, P = 0.68. For all quantifications, multiple comparisons were conducted corrected by two-stage linear step-up procedure, black lines along x axis indicate significant changes reported between groups, and red or blue lines denote the first significant change from the previous bin for within trial type comparisons. Asterisks indicate where ANOVA multiple comparisons found significance. Data are shown as mean ± s.e.m. Source data are provided as a Source Data file.
Fig. 7
Fig. 7. The avTRN shapes avoidance-related dynamics in PVT–NAc neurons.
a Top: Schematic of the experimental approach used for fiber photometry imaging of NAc-projecting PVT cells and optogenetic inhibition of the avTRN–PVT pathway. Bottom: Representative image of GCaMP8s and Halo-mCherry expression, and fiber placement around pPVT. b Heatmaps of calcium responses for avoidance and escape trials in light-off and light-on sessions, n = 3 mice. c Average calcium signal and WS duration in (b). d Calcium signal AUC quantification for avoidance and escape trials, Mixed-effects model (REML) interactions reported in graphs. Avoidance: Off, n = 205 Trials; On, n = 192 Trials. Escape: Off, n = 35 Trials; On, n = 48 Trials. ef Averaged calcium responses during WS onset (e) and shuttle initiation (f) events for all avoidance and escape trials, n = 4 mice. Mixed-effects model (REML) interactions reported in graphs. WS onset: Avoidance, Off n = 205 Events, On n = 192 Events. Escape, Off n = 35 Events, On n = 48 Events. Shuttle initiate: Avoidance, Off n = 139 Events, On n = 131 Events; Escape, Off n = 24 Events, On n = 27 Events. For all quantifications, multiple comparisons were conducted corrected by two-stage linear step-up procedure, black lines along x axis indicate significant changes reported between groups. Asterisks indicate where ANOVA multiple comparisons found significance. Data are shown as mean ± s.e.m. Source data are provided as a Source Data file.
Fig. 8
Fig. 8. Optogenetic manipulations of input from avTRN drive rebound responses in NAc-projecting PVT neurons.
a, b Schematic of the experimental approach for fiber photometry imaging of NAc-projecting PVT cells while optogenetically inhibiting avTRN-PVT pathway, and fiber placement around pPVT (n = 3 mice per group). c, d Heatmaps of calcium responses for mCherry and Halo subjects (left two) and average calcium signal (right) before 2AA. e Calcium signal AUC quantification for mCherry and Halo subjects, two-way ANOVA interaction provided (n = 30 Trials from 3 mice for each group); F(2, 116) = 0.08, P = 0.92. f, g Heatmaps (f) and averages (g) of calcium responses for mCherry and Halo subjects from pre 5-s to post 5-s of light onset from (c). Mixed-effects model (REML) interaction reported in graph. h, i Adapted from Fig. 7b, during 2AA. Heatmaps (h) and averages (i) of calcium responses for Light-off and Light-on sessions from 10-s prior to WS onset. Mixed-effects model (REML) interaction reported in graphs, Avoidance: (Off, n = 205 Trials; On, n = 192 Trials); Escape: P < 0.001 (Off, n = 35 Trials; On, n = 48 Trials). j Top: Schematic of the experimental approach for fiber photometry imaging of NAc-projecting PVT cells and optogentically activating avTRN-PVT pathway. Bottom: Representative images of GCaMP7s and ChrimsonR-tdTomato expression, and fiber placement around pPVT. k Heatmap of calcium responses during optical stimulation. l Average calcium signal. m Calcium signal AUC quantification for each stage. One-way ANOVA interaction; F(2, 87) = 144.2, P < 0.0001 (n = 30 Trials from 3 mice). n Left: Schematic of the experimental approach for ex vivo single-cell slice imaging of GCaMP during TRN optogenetic activation. Right: Example 4x image of slice with GCaMP8f expression. o Averaged z-score calcium signal before and after bath application of PTX (50 µM) and CGP55845 (5 µM) during optogenetic stimulation of TRN normalized to the slope of baseline. p Calcium signal AUC quantification before and after bath application of GABA antagonists. Two-way repeated measures ANOVA interaction, F(2, 266) = 31.74, P < 0.0001 (n = 134 cells from 5 mice). For all quantifications, multiple comparisons were conducted corrected by two-stage linear step-up procedure, black lines along x-axis indicate significant changes reported between groups. Asterisks indicate where ANOVA multiple comparisons found significance. Data are shown as mean ± s.e.m. Source data are provided as a Source Data file.

References

    1. Briggs, F. & Usrey, W. M. Emerging views of corticothalamic function. Curr Opin Neurobiol18, 403–407 (2008). 10.1016/j.conb.2008.09.002 - DOI - PMC - PubMed
    1. Cudeiro, J. & Sillito, A. M. Looking back: corticothalamic feedback and early visual processing. Trends Neurosci29, 298–306 (2006). 10.1016/j.tins.2006.05.002 - DOI - PubMed
    1. Sherman, S. M. The thalamus is more than just a relay. Curr. Opin. Neurobiol.17, 417–422 (2007). - PMC - PubMed
    1. Sherman, S. M. & Guillery, R. W. On the actions that one nerve cell can have on another: distinguishing ‘drivers’ from ‘modulators’. Proc. Natl Acad. Sci. USA95, 7121–7126 (1998). 10.1073/pnas.95.12.7121 - DOI - PMC - PubMed
    1. Bickford, M. E. Thalamic circuit diversity: modulation of the driver/modulator framework. Front. Neural Circuits9, 86 (2015). - PMC - PubMed

LinkOut - more resources