. 2024 Aug 3;15(8):560.
doi: 10.1038/s41419-024-06957-3.

Heterozygous knockout of Synaptotagmin13 phenocopies ALS features and TP53 activation in human motor neurons

Affiliations

Heterozygous knockout of Synaptotagmin13 phenocopies ALS features and TP53 activation in human motor neurons

Johannes Lehmann et al. Cell Death Dis. .

Abstract

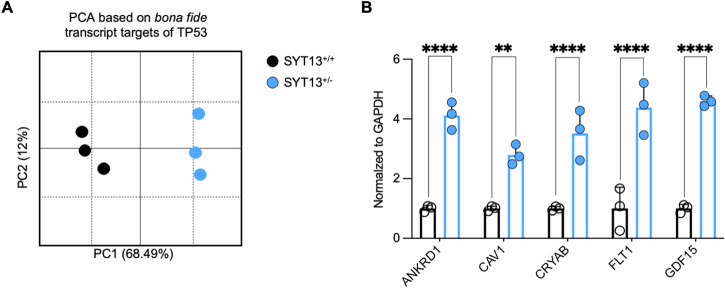
Spinal motor neurons (MNs) represent a highly vulnerable cellular population, which is affected in fatal neurodegenerative diseases such as amyotrophic lateral sclerosis (ALS) and spinal muscular atrophy (SMA). In this study, we show that the heterozygous loss of SYT13 is sufficient to trigger a neurodegenerative phenotype resembling those observed in ALS and SMA. SYT13+/- hiPSC-derived MNs displayed a progressive manifestation of typical neurodegenerative hallmarks such as loss of synaptic contacts and accumulation of aberrant aggregates. Moreover, analysis of the SYT13+/- transcriptome revealed a significant impairment in biological mechanisms involved in motoneuron specification and spinal cord differentiation. This transcriptional portrait also strikingly correlated with ALS signatures, displaying a significant convergence toward the expression of pro-apoptotic and pro-inflammatory genes, which are controlled by the transcription factor TP53. Our data show for the first time that the heterozygous loss of a single member of the synaptotagmin family, SYT13, is sufficient to trigger a series of abnormal alterations leading to MN sufferance, thus revealing novel insights into the selective vulnerability of this cell population.


Conflict of interest statement

The authors declare no competing interests.

Figures

Fig. 1
Fig. 1. Reduced levels of SYT13 correlate with disease outcome in male patients.
A SYT13 expression levels are significantly reduced in the transcriptome of C9orf72-mutant MNs. N = 2 control and ALS lines (n = 6 replicates for each genotype). B Phospho-SYT13 is only detected in the proteome of control MNs, and not in ALS. N = 3 CTRLs and N = 8 ALS patients. C SYT13 is differentially expressed in females and male subjects: female ALS patients have higher levels of the synaptotagmin than sex-matched controls, whose SYT13 expression is lower than their male counterparts. In contrast, MNs derived from male patients show lower abundance of SYT13 transcript than healthy individuals. N = 101 CTRLs (50 females and 51 males) and 340 = ALS (122 females and 218 males). Box and whiskers represent Mean ± SD. D Linear regression model highlighting a significant correlation between the SYT13 levels and disease outcome. E Sex and expression levels of synaptotagmins do not yield significant prediction models using different machine learning pipelines. F MultiSURF algorithm highlights that SYT13 has the most relative feature importance associated with ALS.
Fig. 2
Fig. 2. Heterozygous loss of SYT13 triggers typical ALS phenotypes in 5-weeks old human MNs.
A Schematic representation and sequencing of the CRISPR-Cas9 strategy to generate the SYT13+/− hiPSC line. B Rt-qPCR of the SYT13 levels in SYT13+/− and SYT13+/+ MNs. N = 6. *p < 0.05. C Representative image of DIV21 hiPSC-derived MNs positively stained against CHAT and MAP2. The expression levels of typical neuronal markers are not altered SYT13+/− MNs at this stage of culture. Scale bar 20 μm. D DIV35 SYT13+/− MNs have higher levels of SQSTM1/p62 than their isogenic controls. Scale bar 5 μm. N = 75 MNs from 3 independent differentiations. ****p < 0.0001. E Accumulation of aberrant cytosolic aggresomes is also detected in DIV35 SYT13+/− MNs. Scale bar 5 μm. N = 75 MNs from 3 independent differentiations. **p < 0.01. F SYT13+/− MNs do not show signs of TDP43 pathology. Scale bar 5 μm. Scale bar 5 μm. N = 55 MNs from 3 independent differentiations. Data are represented as the mean ± SD. G The phosphorylation levels of the stress marker Jun are significantly higher in SYT13+/− MNs than SYT13+/+ ones. Scale bar 20 μm. N = 90 MNs from 3 independent differentiations. ****p < 0.0001. H Excitatory synapses are reduced in SYT13-deficient neurons. Scale bar 3 μm. N = 30 MNs from 3 independent differentiations. ****p < 0.0001. Data are represented as the mean ± SD.
Fig. 3
Fig. 3. The SYT13+/− transcriptome is characterized by impaired MN development and increased stress response.
A PCA displaying the transcriptional separation between SYT13+/− and SYT13+/+ MNs. B Heatmap showing the differentially expressed genes in SYT13+/− cultures. C Representative GO biological processes terms obtained by enrichment analysis based on the SYT13+/− transcriptome. D GSEA plots showing processes most related to SYT13+/+ or SYT13+/− neurons. E Confirmation of LHX3 and LHX4 expression in SYT13+/− MNs with rt-qPCR. N = 5 differentiations. F SYT13+/− MNs have fewer primary dendrites than isogenic controls. Scale bar 10 μm. N = 3 differentiations. G GSEA plot showing significant correlation between the SYT13+/− transcriptome and ALS ontology. H Western blot analysis showing reduced levels of NfH in SYT13+/− cultures. N = 3 differentiations. *p < 0.05. Data are represented as the mean ± SD.
Fig. 4
Fig. 4. The SYT13+/− transcriptional fingerprint correlates with ALS signatures and highlights TP53 activation.
A PCA plot integrating the SYT13+/− transcriptome with an in-house RNAseq [32] performed with ALS mutants and healthy MNs. Reduced levels of SYT13 are sufficient to shift the transcriptional program of human MNs within the ALS centroid. B Machine learning-based integrative analysis of the SYT13+/− and ALS spinal cord transcriptome identifies 60 genes positively correlating with both signatures. C Enrichment analysis based on the 60 genes highlighted by the integrative transcriptome analysis. D Gene network and enrichment based on the transcripts commonly shared by the SYT13+/− and ALS transcriptomes highlights stress, inflammation, and pro-apoptotic terms. E TP53 is the transcription factor mostly associated with the gene cluster shared by the SYT13+/− and ALS transcriptional signatures. F Heatmap displaying the top 10 mimicker and reverser signatures identified with the SigCom LINCS algorithm and associated with SYT13. G The genes of the top mimicker transcriptomes are linked to toll-like receptor signaling and apoptosis, linking SYT13 and ALS signatures. H Transcriptomes that significantly correlate with the SYT13+/− signature are associated with ALS, neurodegeneration, and TP53.
Fig. 5
Fig. 5. The transcriptional program linked to TP53 separates SYT13+/− MNs from their isogenic control.
A PCA plot generated using the expression of 242 TP53 target genes and displaying a clear separation between SYT13+/− and SYT13+/− transcriptomes along PC1. B Single-tube qPCRs confirming the higher expression of five TP53 targets in SYT13+/− MNs than in isogenic controls. N = 3. **p < 0.01, ****p < 0.0001. Data are represented as the mean ± SD.

References

    1. Ghasemi M, Brown RH. Genetics of amyotrophic lateral sclerosis. Cold Spring Harb Perspect Med. 2018;8:a024125. 10.1101/cshperspect.a024125 - DOI - PMC - PubMed
    1. Suzuki N, Nishiyama A, Warita H, Aoki M. Genetics of amyotrophic lateral sclerosis: seeking therapeutic targets in the era of gene therapy. J Hum Genet. 2023;68:131–52. 10.1038/s10038-022-01055-8 - DOI - PMC - PubMed
    1. Brenner D, Freischmidt A. Update on genetics of amyotrophic lateral sclerosis. Curr Opin Neurol. 2022;35:672–7. 10.1097/WCO.0000000000001093 - DOI - PubMed
    1. Megat S, Mora N, Sanogo J, Roman O, Catanese A, Alami NO, et al. Integrative genetic analysis illuminates ALS heritability and identifies risk genes. Nat Commun. 2023;14:342. 10.1038/s41467-022-35724-1 - DOI - PMC - PubMed
    1. Burke RE, Dum RP, Fleshman JW, Glenn LL, Lev‐Tov A, O’Donovan MJ, et al. An HRP study of the relation between cell size and motor unit type in cat ankle extensor motoneurons. J Comp Neurol. 1982;209:17–28. 10.1002/cne.902090103 - DOI - PubMed

MeSH terms