. 2024 Aug 3;15(1):6592.
doi: 10.1038/s41467-024-50885-x.

Translational T-box riboswitches bind tRNA by modulating conformational flexibility

Affiliations

Translational T-box riboswitches bind tRNA by modulating conformational flexibility

Eduardo Campos-Chavez et al. Nat Commun. .

Abstract

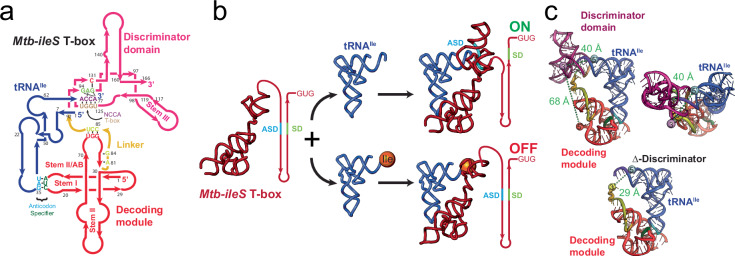
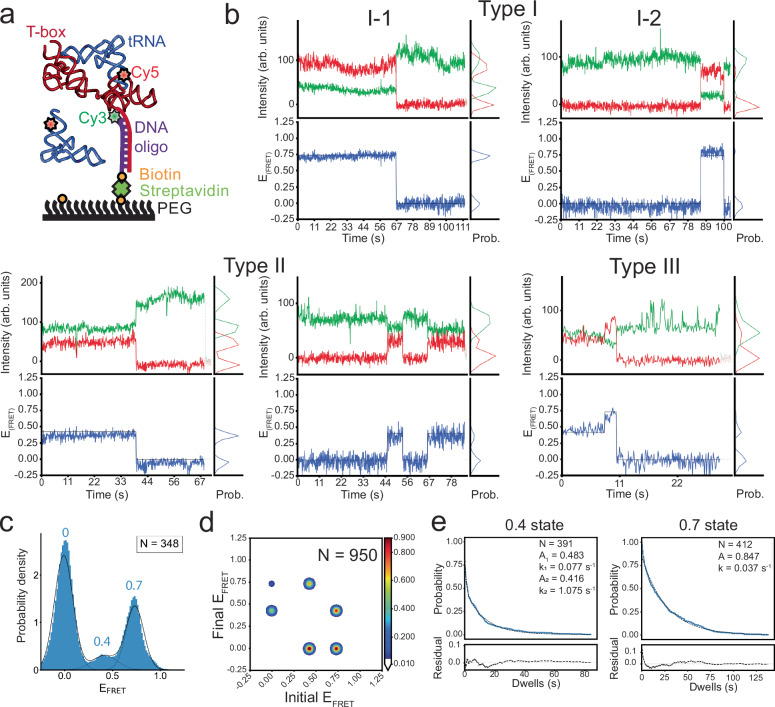
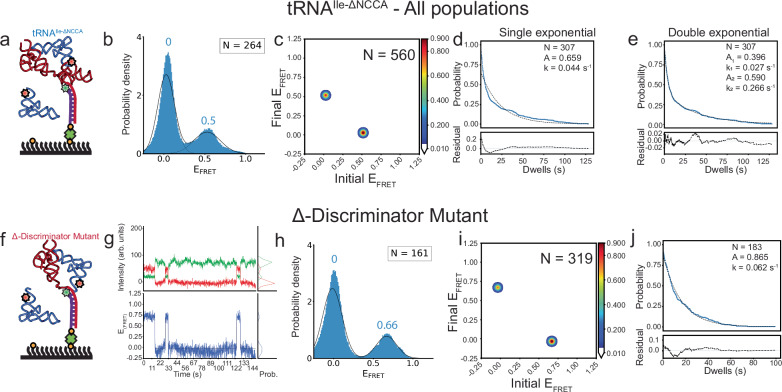
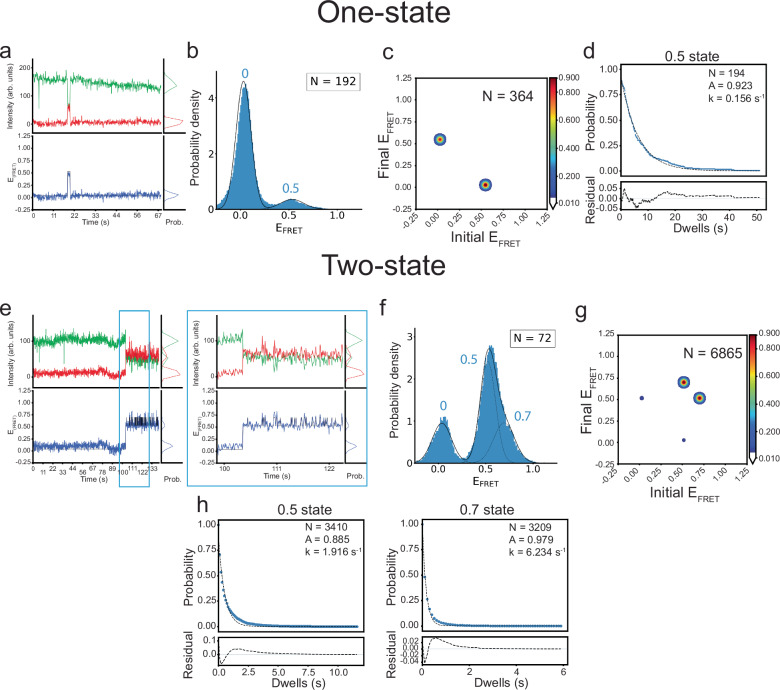
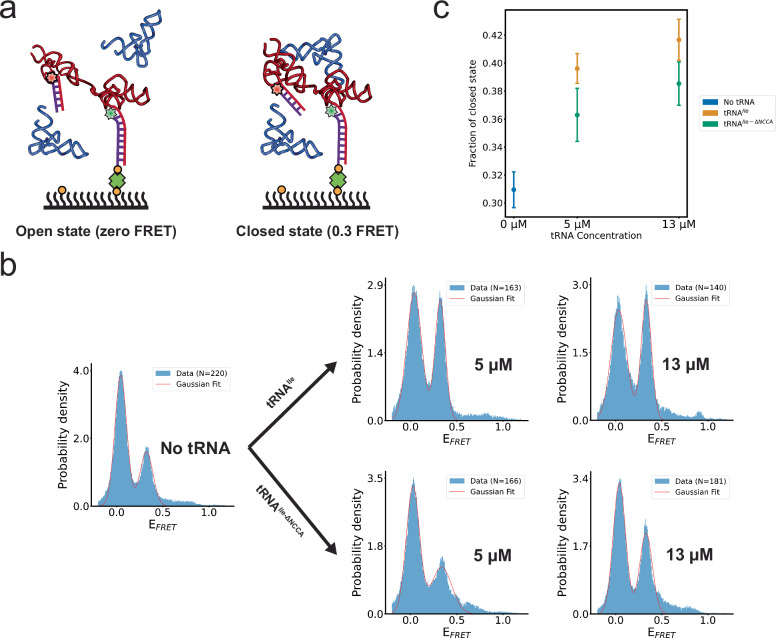
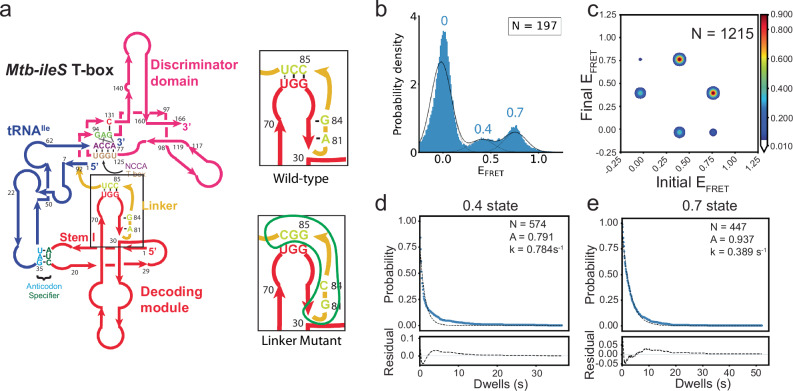
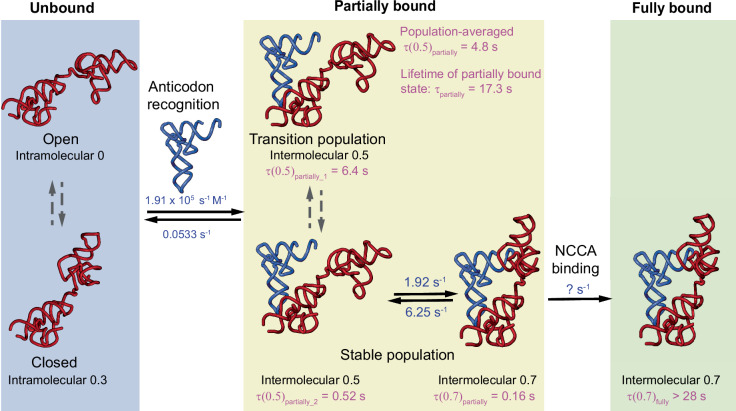
T-box riboswitches are noncoding RNA elements involved in genetic regulation of most Gram-positive bacteria. They regulate amino acid metabolism by assessing the aminoacylation status of tRNA, subsequently affecting the transcription or translation of downstream amino acid metabolism-related genes. Here we present single-molecule FRET studies of the Mycobacterium tuberculosis IleS T-box riboswitch, a paradigmatic translational T-box. Results support a two-step binding model, where the tRNA anticodon is recognized first, followed by interactions with the NCCA sequence. Furthermore, after anticodon recognition, tRNA can transiently dock into the discriminator domain even in the absence of the tRNA NCCA-discriminator interactions. Establishment of the NCCA-discriminator interactions significantly stabilizes the fully bound state. Collectively, the data suggest high conformational flexibility in translational T-box riboswitches; and supports a conformational selection model for NCCA recognition. These findings provide a kinetic framework to understand how specific RNA elements underpin the binding affinity and specificity required for gene regulation.


Conflict of interest statement

The authors declare no competing interests.

Figures

Fig. 1
Fig. 1. Structure and mechanism of the Mtb-ileS T-box riboswitch.
a Secondary structure diagram showing the Mtb-ileS T-box riboswitch (pink/red) and tRNAIle (blue). The T-box has two distinct structural domains, the decoding module (red) is involved in recognizing specific tRNAs through anticodon-specifier interactions (cyan, green), whereas the discriminator domain (pink) contains the T-box sequence (brown) involved in recognizing the 3’ NCCA region of the tRNA (purple) and assessing the aminoacylation status. The two domains are joined by a linker region (yellow). The secondary structure diagram is based on the structure of the complex. b Proposed mechanism for translation-regulating T-box riboswitches. The T-box decodes the tRNA identity of the tRNA and aminoacylation status at the 3’ end. Depending on the aminoacylation status of the tRNA, it exposes or sequesters the Ribosome Binding Site or Shine Dalgarno sequence (SD, green). If the tRNA is uncharged, the 3’ NCCA of the tRNA forms base pairs with the T-box sequence leading to a conformation where the SD region is accessible, and translation is allowed (top). If the tRNA is charged, the interactions with the T-box sequence are precluded, leading to a conformation where the SD and the Anti Shine Dalgarno (ASD, cyan) regions interact, the SD is inaccessible, and translation is not allowed (bottom). c Structure of the Mtb-ileS T-box riboswitch/tRNAIle complex. The molecules are colored as in (a). The top two pictures show two orientations of the complex. The bottom picture shows a model of a truncated T-box missing the Discriminator domain (Δ-Discriminator mutant). Approximate distances between the 3’ and 5’ ends of the T-box (69 Å), the 3’ end of T-box and the 5’ end of the tRNA (40 Å), and the 3’ end of the Δ-Discriminator Mutant and the 5’ end of the tRNA (29 Å) are shown.
Fig. 2
Fig. 2. smFRET experiments show binding of tRNAIle to the wild-type Mtb-ileS T-box riboswitch.
a Schematic diagram illustrating the smFRET experiment. The T-box was anchored to the surface via hybridization to a DNA oligonucleotide (purple) biotinylated on the 5’ end and Cy3-labeled at the 3’ end. The tRNAIle was labeled on the 5’ end with Cy5. Cartoon based on a similar cartoon from. b Representative Cy3 (green) and Cy5 (red) fluorescence intensity (top) and smFRET trajectories (bottom) of the Mtb-ileS T-box riboswitch/tRNAIle. The smFRET efficiency was calculated as (ICy5/(ICy3-ICy5)). Three types of trajectories were observed: Type I trajectories only show FRET efficiency around 0.7, Type II trajectories only show FRET values around 0.4, and Type III trajectories sample the 0.4 and 0.7 states. c FRET efficiency histogram of the data. Dotted black lines show the individual populations obtained from the consensus HMM modeling, while the model’s population-weighted set of efficiency distributions is plotted with a solid black line. N reports the number of traces included in the histogram. d Transition density plot constructed using the idealized Viterbi paths modelled to the entire dataset using tMAVEN. The contour level colors report the normalized counts. N reports the total number of transitions. e Dwell time survival plot for the 0.4 and 0.7 FRET states. The data were fitted using either a single (0.7 state) or double (0.4 state) exponential decay function. The number of events (N) used for the analysis and the fitting parameters are shown. Data are shown in blue and the fitting curves are shown in dotted black lines. The fit residuals are shown in the bottom plot. Detailed fitting results are reported in Supplementary Table VI. Source data are provided as a Source Data file.
Fig. 3
Fig. 3. smFRET experiments show consequences of the absence of the NCCA/specifier interactions.
a Schematic diagram illustrating the smFRET experiment with the tRNAIle-ΔNCCA-Cy5 construct. Cartoon based on a similar cartoon from. b FRET efficiency histogram for tRNAIle-ΔNCCA-Cy5 mutant. Fitted populations using consensus HMM modeling are shown as in Fig. 2c. c Transition density plot for tRNAIle-ΔNCCA-Cy5 mutant for all data constructed using the idealized Viterbi paths modelled with tMAVEN, plotted the same way as described in Fig. 2d. d, e Dwell time survival plots for the 0.5 FRET state. The data were fitted using either a single (left) or double (right) exponential decay function. The double exponential decay function better fits the data. Data and fitting results are presented as described in Fig. 2e. f Schematic diagram illustrating the smFRET experiment with the Mtb-ileS T-box riboswitch Δ-Discriminator Mutant and tRNAIle. Cartoon based on a similar cartoon from. g Representative Cy3 (green) and Cy5 (red) fluorescence intensity (top) and smFRET trajectories (blue, bottom) of the Δ-Discriminator Mutant and tRNAIle complex. h FRET efficiency histogram of the data with the Δ-Discriminator Mutant. Fitted populations using consensus HMM modeling are plotted as in Fig. 2c. i Transition density plot constructed using the idealized Viterbi paths, as described in Fig. 2d. j Dwell time survival plot and fitting results using a single exponential decay function. Data and fitting results are presented as described in Fig. 2e. N in each plot reports the number of traces or events included in the analysis. Source data are provided as a Source Data file.
Fig. 4
Fig. 4. smFRET experiments with tRNAIle-ΔNCCA reveal conformational sampling in the partially bound state.
a Representative Cy3 (green) and Cy5 (red) fluorescence intensity (top) and smFRET trajectories (blue, bottom) for the One-state population of the Mtb-ileS T-box riboswitch/ tRNAIle-ΔNCCA-Cy5 complex. b FRET efficiency histogram of the One-state population, shown as in Fig. 2c. c Transition density plot for the One-state population constructed using the idealized Viterbi paths, plotted the same way as described in Fig. 2d. d Dwell time survival plots for the 0.5 state in the One-state population, fitted using a single exponential decay function. Data and fitting results are presented as described in Fig. 2e. e Representative fluorescence intensity and smFRET trajectory for the Two-state population of the Mtb-ileS T-box riboswitch/ tRNAIle-ΔNCCA-Cy5 complex. A zoom of a region framed by cyan boxes is displayed on the right, which shows rapid transitions between the 0.5 and 0.7 states. f FRET efficiency histogram of the Two-state population, shown as in Fig. 2c. g Transition density plot constructed using the idealized Viterbi paths for the Two-state population, plotted the same way as described in Fig. 2d. h Dwell time survival plots for the 0.5 and 0.7 states fitted a single exponential decay function. Data and fitting results are presented as described in Fig. 2e. N in each plot reports the number of traces or events included in the analysis. Source data are provided as a Source Data file.
Fig. 5
Fig. 5. The Mtb-ileS T-box riboswitch samples open and closed conformations.
a Schematic diagram illustrating the smFRET experiment using an intramolecularly labeled Mtb-ileS T-box construct. Two FRET states were observed, assigned to an open (zero FRET, left) and a closed (0.3 FRET, right) state. Cartoon based on a similar cartoon from. b FRET efficiency histograms of intramolecularly labeled Mtb-ileS T-box in the absence of tRNA (left), and in the presence of different concentrations of tRNAIle (right, top) and tRNAIle-ΔNCCA (right, bottom). The orange line corresponds to the fits of a Gaussian function to each peak. N reports the number of traces in each histogram. Only the first 40 frames from FRET trajectories are included in the histogram to avoid including data after photobleaching of the fluorophores. c Changes in the fraction of the closed conformation as a function of tRNAIle or tRNAIle-ΔNCCA concentration. The fraction of the closed state was calculated by 1) fitting Gaussian curves to each peak, which provided an estimate of the standard deviation, 2) using these fits to obtain the area under each peak by integration, and 3) calculating the fraction by dividing the area corresponding to the 0.3 FRET state by the sum of the areas corresponding to the zero and the 0.3 FRET states in (b). The error of each fraction was estimated by standard error propagation using the fitting uncertainties as described in the Methods section and correspond to the error bars in the figure. Source data are provided as a Source Data file.
Fig. 6
Fig. 6. Linker Mutations destabilize the Mtb-ileS T-box/tRNA complex.
a Left, schematic diagram of the Mtb-ileS T-box with the linker region shown inside the black box. Right, schematic diagrams showing the linker region (top) and the mutations introduced in the Linker Mutant (bottom). The region affected is circled in green in the mutant diagram. b FRET efficiency histogram of the data with the Linker Mutant. Fitted populations using consensus HMM modeling are plotted as in Fig. 2c. c Transition density plot constructed using the idealized Viterbi paths, as described in Fig. 2d. d, e Dwell time survival plots and fitting result using a single exponential decay function for the 0.4 FRET state (d) and 0.7 FRET state (e). Data and fitting results are presented as described in Fig. 2e. N in each plot reports the number of traces or events included in the analysis. Source data are provided as a Source Data file.
Fig. 7
Fig. 7. The RAG sequence is important for aminoacylation state recognition.
a Left: Schematic diagram of the Mtb-ileS T-box with the NCAA/T-box and RAG sequence regions shown inside the black box. Right, schematic diagrams showing the RAG sequence region (GAG) (top) and the mutations introduced in the RAG Sequence mutant (bottom). The interactions affected are circled in green in the mutant diagram. b FRET efficiency histogram of the data with the Linker Mutant. Fitted populations using consensus HMM modeling are plotted as in Fig. 2c. c Transition density plot constructed using the idealized Viterbi paths, as described in Fig. 2d. df Dwell time survival plots and fitting result using a single or double exponential decay function for the (d) 0.4 FRET state, (e) 0.7 FRET state and the (f) 0.9 FRET state. Data and fitting results are presented as described in Fig. 2e. N in each plot reports the number of traces or events included in the analysis. Source data are provided as a Source Data file.
Fig. 8
Fig. 8. Proposed kinetic model for the binding process of the Mtb-ileS T-box to tRNA.
In the absence of tRNA, the T-box samples both an open and a closed conformation (left, blue background). In the presence of tRNA, the T-box binds tRNA through a two-step process where interactions with the anticodon are established first, forming a partially bound state (middle, yellow background). The partially bound state exhibits conformational heterogeneity revealed by the WT T-box/ tRNAIle-ΔNCCA complex. In the One-state subpopulation (middle, top), tRNAIle-ΔNCCA transiently binds, leading to a 0.5 FRET state, with a 6.4 s lifetime (τ(0.5)partially_1) before dissociating. In the Two-state subpopulation (middle, bottom), tRNAIle-ΔNCCA remains stably bound, and rapidly fluctuates between a 0.5 FRET state (with a lifetime of τ(0.5)partially_2) and a 0.7 FRET state (with a lifetime of τ(0.7)partially). The 0.7 FRET state in the partially bound state resembles the 0.7 FRET state in the fully bound state (right, green background), but with a much shorter lifetime due to the absence of the NCCA-discriminator interactions. In the presence of an intact, uncharged NCCA end, the NCCA end of tRNA engages with the discriminator domain, leading to a long-lived fully bound state (right, green background, τ(0.7)fully). Rate constants (blue) are shown for the different binding states. Rate constants for the binding and dissociation during anticodon recognition step and for the conformational fluctuations within the Two-state subpopulation of the partially bound state are determined from the experiments using WT T-box riboswitch and tRNAIle-ΔNCCA at a tRNA concentration of 100 nM. The lifetimes of all FRET states are shown in pink and are calculated from dwell time analysis (Supplementary Table 6). The lifetimes of different FRET states in the partially bound state are determined from the experiments using WT T-box riboswitch and tRNAIle-ΔNCCA. The lifetime of the fully bound state is determined from the experiments using WT T-box riboswitch and tRNAIle. A detailed explanation of how the rates and lifetimes were assigned is given in Supplementary Fig. 8.

References

    1. Chantranupong, L., Wolfson, R. L. & Sabatini, D. M. Nutrient-sensing mechanisms across evolution. Cell161, 67–83 (2015). 10.1016/j.cell.2015.02.041 - DOI - PMC - PubMed
    1. Henkin, T. M. Riboswitch RNAs: using RNA to sense cellular metabolism. Genes Dev.22, 3383–3390 (2008). 10.1101/gad.1747308 - DOI - PMC - PubMed
    1. Salvail, H. & Breaker, R. R. Riboswitches. Curr. Biol.33, R343–R348 (2023). 10.1016/j.cub.2023.03.069 - DOI - PMC - PubMed
    1. Grundy, F. J. & Henkin, T. M. tRNA as a positive regulator of transcription antitermination in B. subtilis. Cell74, 475–482 (1993). 10.1016/0092-8674(93)80049-K - DOI - PubMed
    1. Bullwinkle, T. J. & Ibba, M. Translation quality control is critical for bacterial responses to amino acid stress. Proc. Natl Acad. Sci. USA113, 2252–2257 (2016). 10.1073/pnas.1525206113 - DOI - PMC - PubMed

MeSH terms

LinkOut - more resources