. 2024 Aug 3;14(1):17981.
doi: 10.1038/s41598-024-68447-y.

Proteomics and machine learning in the prediction and explanation of low pectoralis muscle area

Collaborators, Affiliations

Proteomics and machine learning in the prediction and explanation of low pectoralis muscle area

Nicholas A Enzer et al. Sci Rep. .

Erratum in

Abstract

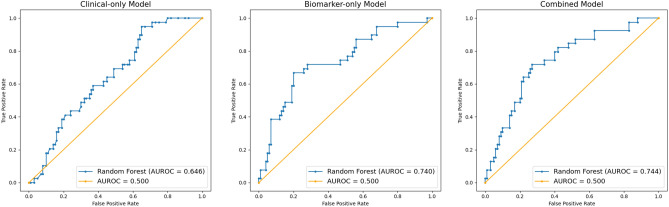
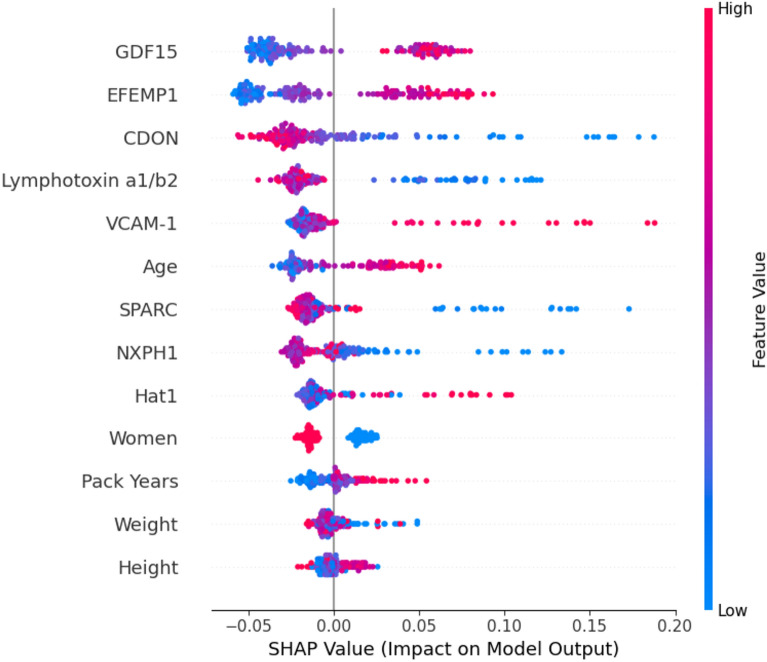
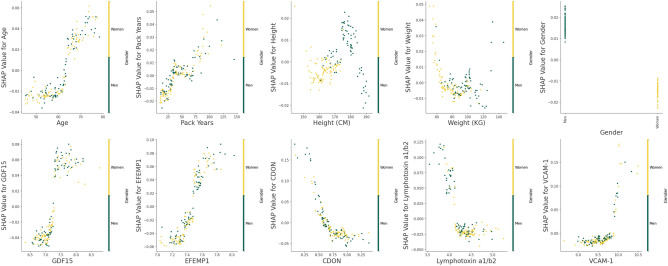
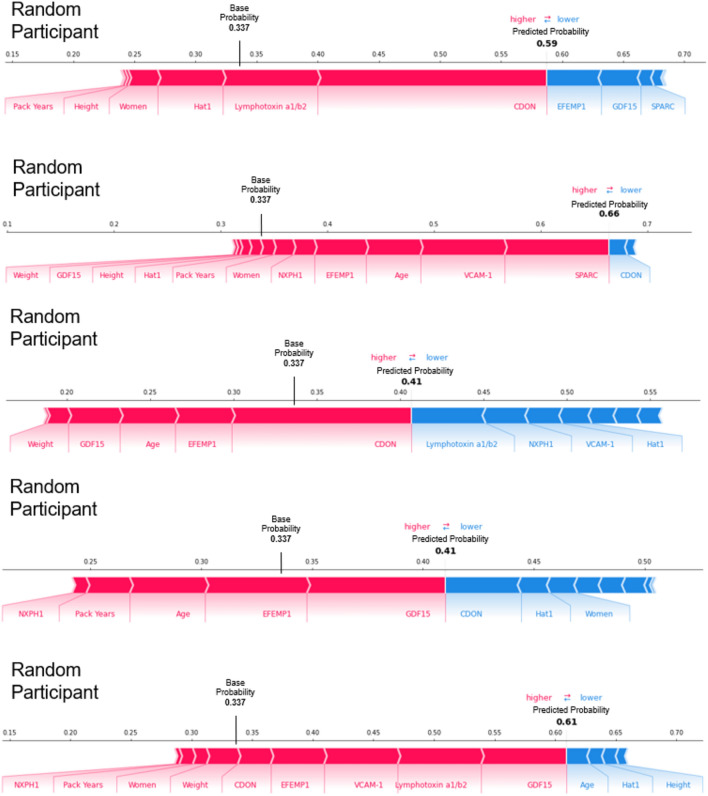
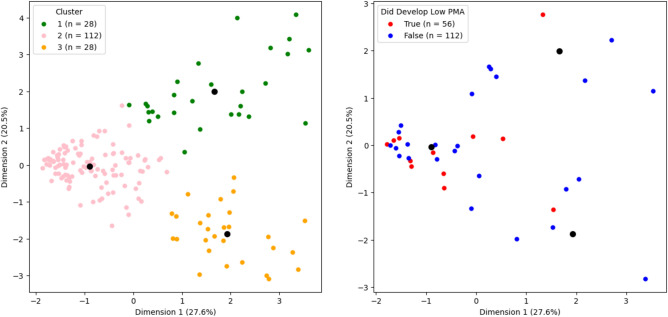
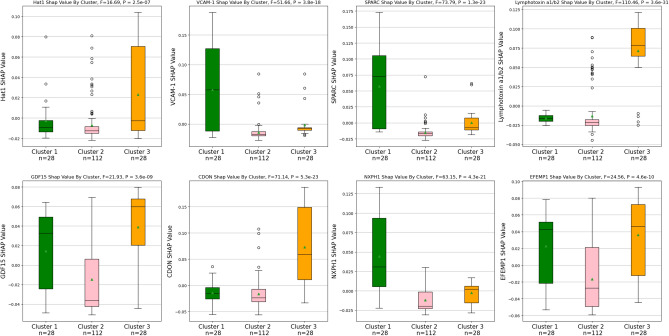
Low muscle mass is associated with numerous adverse outcomes independent of other associated comorbid diseases. We aimed to predict and understand an individual's risk for developing low muscle mass using proteomics and machine learning. We identified eight biomarkers associated with low pectoralis muscle area (PMA). We built three random forest classification models that used either clinical measures, feature selected biomarkers, or both to predict development of low PMA. The area under the receiver operating characteristic curve for each model was: clinical-only = 0.646, biomarker-only = 0.740, and combined = 0.744. We displayed the heterogenetic nature of an individual's risk for developing low PMA and identified two distinct subtypes of participants who developed low PMA. While additional validation is required, our methods for identifying and understanding individual and group risk for low muscle mass could be used to enable developments in the personalized prevention of low muscle mass.


Conflict of interest statement

Mr. Enzer reports no conflicts of interest. Dr. Mason reports employment by Sarepta Therapeutics, outside of this current work, and grant funding from the National Institutes of Health (NIH), related to this current work. Dr. Chiles reports grant funding from the NIH. Dr. McDonald reports no conflicts of interest. Dr. Shirahata reports no conflicts of interest. Ms. Yuan reports no conflicts of interest. Mr. Castro reports no conflicts of interest. Dr. Regan reports no conflicts of interest. Dr. Choi reports consulting fees from Quantitative Imaging Solutions, outside of this current work. Dr. Diaz reports no conflicts of interest. Dr Washko reports ownership/dividend from Quantitative Imaging Solutions, outside of this current work. Dr. Estépar reports ownership/dividend from Quantitative Imaging Solutions, outside of this current work. Dr. Ash reports ownership/dividend from Quantitative Imaging Solutions, outside of this current work, and grant funding from the National Institutes of Health (NIH), related to this current work. The COPDGene study consortium (NCT00608764) is supported by NHLBI U01 HL089897 and U01 HL089856, as well as by the COPD Foundation through contributions made to an Industry Advisory Board comprised of AstraZeneca, Bayer Pharmaceuticals, Boehringer-Ingelheim, Genentech, GlaxoSmithKline, Novartis, Pfizer, and Sunovion. The remaining authors do not have any competing interests to declare.

Figures

Figure 1
Figure 1
Random forest model discrimination. Areas under the receiver operating characteristic curves (AUROC) of our three random forest classification models built to predict low pectoralis muscle area (PMA). Five clinical measures were used in the clinical-only model: age, gender, pack years, height, and weight. Eight feature selected biomarkers for predicting the development of low PMA were used in the biomarker-only model: Histone acetyltransferase type B catalytic subunit (Hat1), Secreted protein acidic and rich in cysteine (SPARC), Lymphotoxin alpha 1/ beta 2 (Lymphotoxin a1/b2), Growth/differentiation factor 15 (GDF15), Cell adhesion molecule-related/down-regulated by oncogenes (CDON), Neurexophilin-1 (NXPH1), Vascular cell adhesion protein 1 (VCAM-1), and EGF-containing fibulin-like extracellular matrix protein 1 (EFEMP1). The combined model used predictors from both the clinical-only and biomarker-only models. The combined model and the clinical-only model were significantly different (P = 0.032). The combined model and the biomarker-only model were not significantly different (P = 0.78). The clinical-only model and the biomarker-only model were not significantly different (P = 0.09).
Figure 2
Figure 2
Random forest combined model summary plot. The combined random forest classification model’s training set’s (n = 168) predictors ordered by importance for predicting low pectoralis muscle area (PMA). Shapley additive explanation (SHAP) values indicate the predictors' impact on the probability of developing low PMA. For numeric predictors, red indicates a high value and blue indicates a low value. For the sole categorical predictor, “Women”, red and blue represent women and men respectively. Five clinical measures were used: age, gender, pack years, height, and weight. Eight feature selected biomarkers for predicting the development of low PMA were used: Histone acetyltransferase type B catalytic subunit (Hat1), Secreted protein acidic and rich in cysteine (SPARC), Lymphotoxin alpha 1/ beta 2 (Lymphotoxin a1/b2), Growth/differentiation factor 15 (GDF15), Cell adhesion molecule-related/down-regulated by oncogenes (CDON), Neurexophilin-1 (NXPH1), Vascular cell adhesion protein 1 (VCAM-1), and EGF-containing fibulin-like extracellular matrix protein 1 (EFEMP1).
Figure 3
Figure 3
Predictor measurements vs. Shapley additive explanation values (random forest combined model). The relationships between the clinical predictors: age, pack years, height, weight, and gender, and the 5 most important feature selected biomarkers for predicting the development of low pectoralis muscle area (PMA): Growth/differentiation factor 15 (GDF15), EGF-containing fibulin-like extracellular matrix protein 1 (EFEMP1), Cell adhesion molecule-related/down-regulated by oncogenes (CDON), Lymphotoxin alpha 1/ beta 2 (Lymphotoxin a1/b2), Vascular cell adhesion protein 1 (VCAM-1) with their respective Shapley additive explanation (SHAP) values. SHAP values indicate the predictors' impact on the probability of developing low PMA. Yellow and green indicate whether the participant is a woman or a man respectively. This is solely examining the combined random forest classification model’s training set (n = 168).
Figure 4
Figure 4
Force plots for participants with a predicted probability of developing low pectoralis muscle area greater than the mean probability of the random forest combined model’s training set. Force plots for 5 randomly selected participants from the combined random forest classification model’s training set (n = 168) with a predicted probability of developing low pectoralis muscle area (PMA) greater than the mean probability of the combined model’s training set (0.337). Each predictor has a Shapley additive explanation (SHAP) value that indicates the predictors' impact on the probability of developing low PMA. Red and blue indicate whether the impact is positive or negative respectively. Five clinical measures were used: age, gender, pack years, weight, and height. Eight feature selected biomarkers for predicting the development of low PMA were used: Histone acetyltransferase type B catalytic subunit (Hat1), Secreted protein acidic and rich in cysteine (SPARC), Lymphotoxin alpha 1/ beta 2 (Lymphotoxin a1/b2), Growth/differentiation factor 15 (GDF15), Cell adhesion molecule-related/down-regulated by oncogenes (CDON), Neurexophilin-1 (NXPH1), Vascular cell adhesion protein 1 (VCAM-1), and EGF-containing fibulin-like extracellular matrix protein 1 (EFEMP1).
Figure 5
Figure 5
Clustering participants via principal component analysis and K-means clustering. The plot on the left illustrates the participants in the training set (n = 168) of the combined random forest classification model, for predicting the development of low PMA, clustered based on the similarity of their feature selected biomarkers’ Shapley additive explanation (SHAP) values using principal component analysis (PCA) and K-means clustering. There were 2 PCA components. The plot on the right illustrates whether the individuals in the clusters did or did not develop low pectoralis muscle area (PMA). Black dots indicate the centroids of the clusters. The SHAP values of eight feature selected biomarkers for predicting the development of low PMA were used: Histone acetyltransferase type B catalytic subunit (Hat1), Secreted protein acidic and rich in cysteine (SPARC), Lymphotoxin alpha 1/ beta 2 (Lymphotoxin a1/b2), Growth/differentiation factor 15 (GDF15), Cell adhesion molecule-related/down-regulated by oncogenes (CDON), Neurexophilin-1 (NXPH1), Vascular cell adhesion protein 1 (VCAM-1), and EGF-containing fibulin-like extracellular matrix protein 1 (EFEMP1).
Figure 6
Figure 6
Comparing feature selected biomarker Shapley additive explanation values between clusters. Box plots comparing the feature selected biomarkers for predicting the development of low PMA’s SHAP values between the three clusters that were illustrated using principal component analysis (PCA) and K-means clustering. All the biomarkers’ SHAP values were significantly different between the three clusters via one-way ANOVA (P < 0.001). Eight feature selected biomarkers for predicting the development of low PMA were used: Histone acetyltransferase type B catalytic subunit (Hat1), Secreted protein acidic and rich in cysteine (SPARC), Lymphotoxin alpha 1/ beta 2 (Lymphotoxin a1/b2), Growth/differentiation factor 15 (GDF15), Cell adhesion molecule-related/down-regulated by oncogenes (CDON), Neurexophilin-1 (NXPH1), Vascular cell adhesion protein 1 (VCAM-1), and EGF-containing fibulin-like extracellular matrix protein 1 (EFEMP1). The black lines indicate the medians, the red triangles indicate the means, the circles represent outliers, and the error bars represent 1.5 × the interquartile range. There were 168 participants between the 3 groups.

Update of

References

    1. Cruz-Jentoft, A. J. et al. Sarcopenia: Revised European consensus on definition and diagnosis. Age Ageing48, 16–31 (2019). - PMC - PubMed
    1. Singer, J. P., Lederer, D. J. & Baldwin, M. R. Frailty in pulmonary and critical care medicine. Ann. Am. Thorac. Soc.13, 1394–1404 (2016). - PMC - PubMed
    1. Yoon, H. G. et al. Machine learning model for predicting excessive muscle loss during neoadjuvant chemoradiotherapy in oesophageal cancer. J. Cachexia Sarcopenia Muscle12, 1144–1152 (2021). - PMC - PubMed
    1. McDonald, M.-L.N. et al. Chest computed tomography-derived low fat-free mass index and mortality in COPD. Eur. Respir. J.50, 1701134 (2017). - PMC - PubMed
    1. Diaz, A. A. et al. Chest CT measures of muscle and adipose tissue in COPD: Gender-based differences in content and in relationships with blood biomarkers. Acad. Radiol.21, 1255–1261 (2014). - PMC - PubMed

LinkOut - more resources